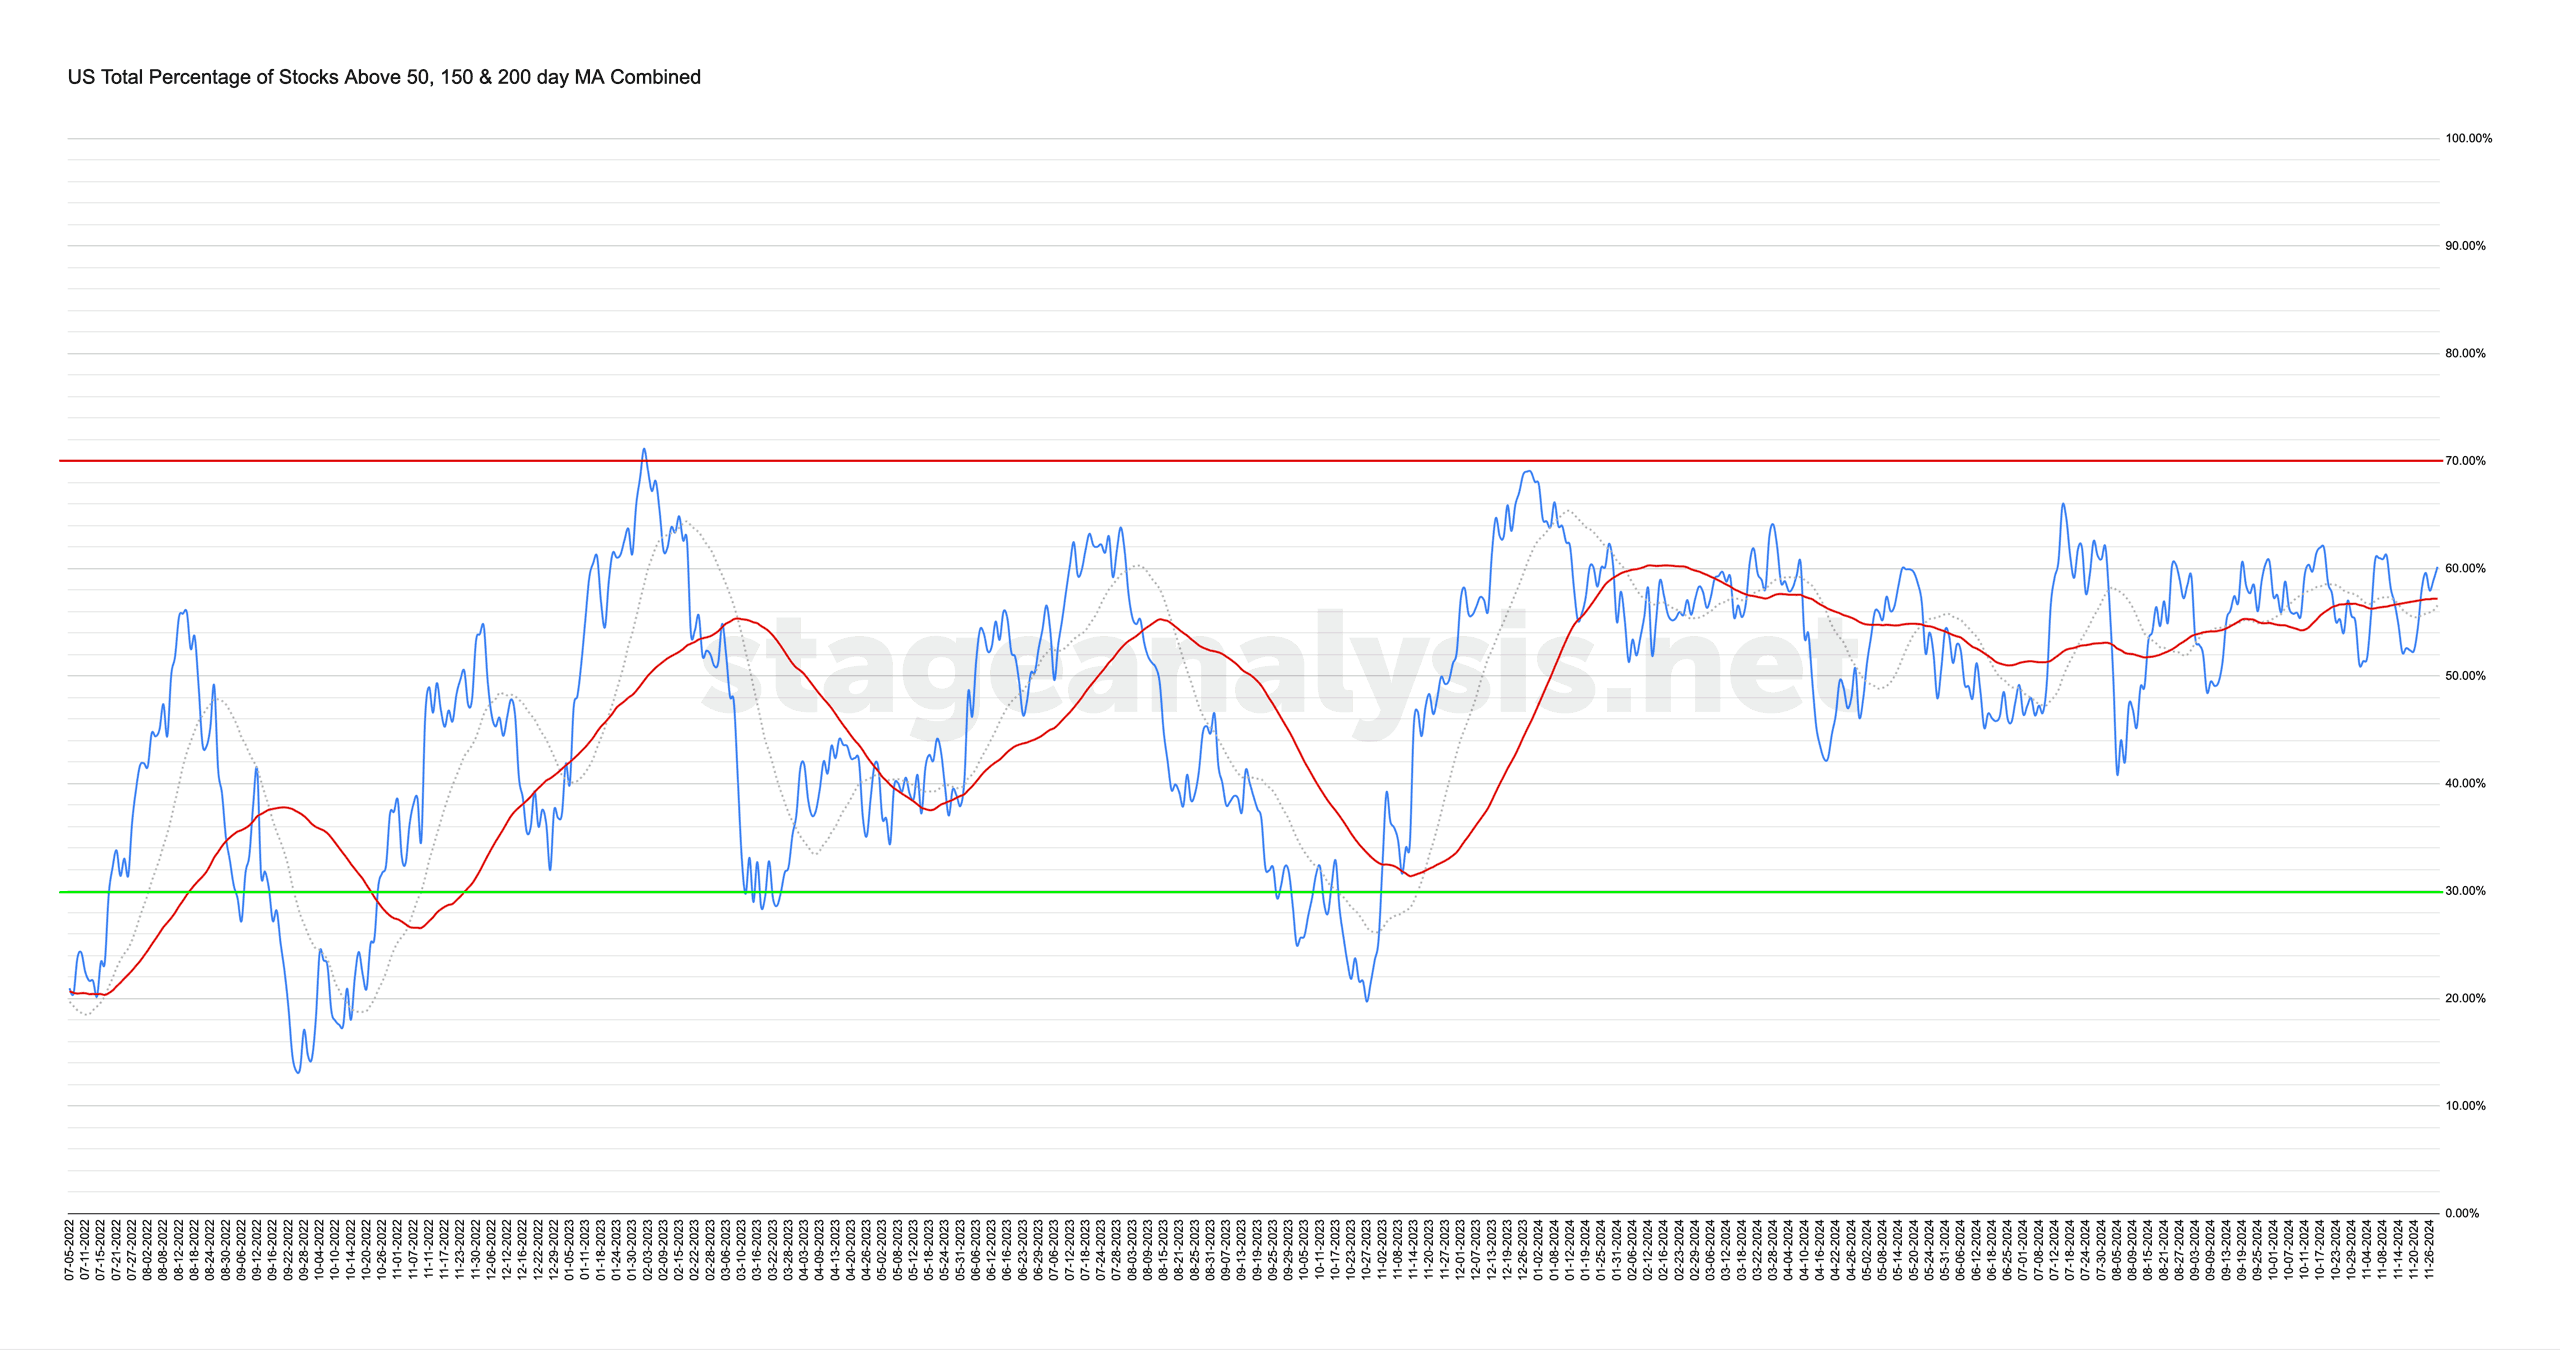
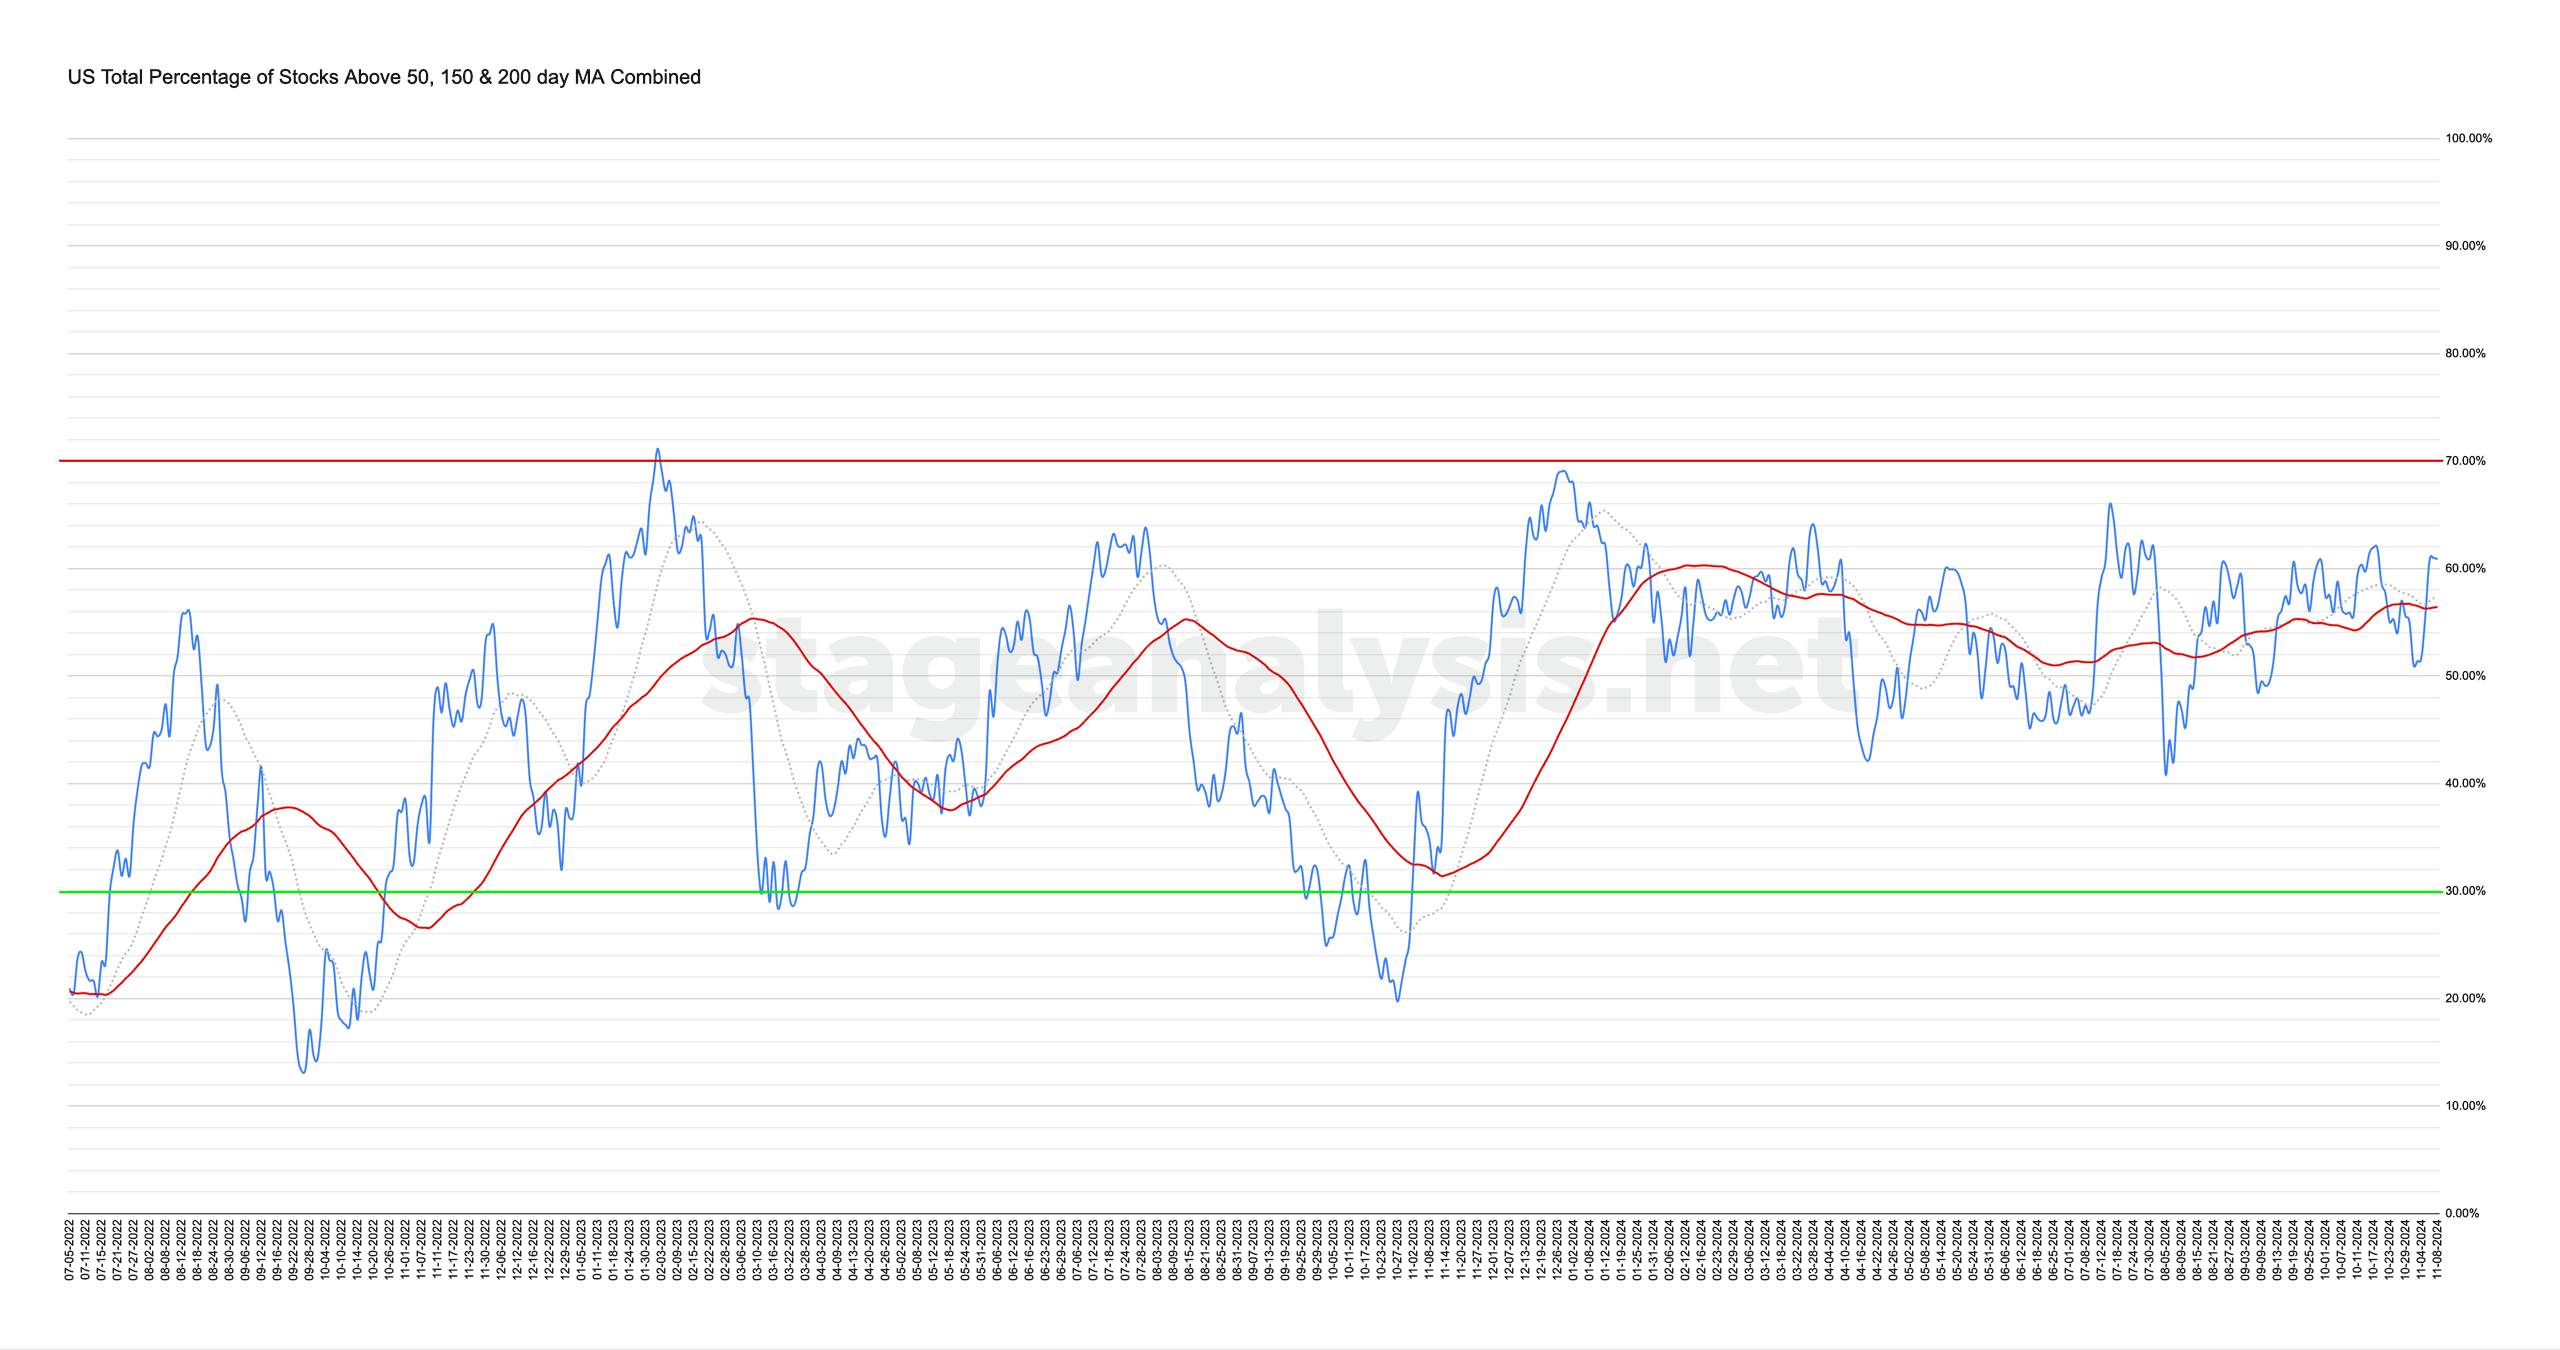
The US Total Percentage of Stocks above their 50 Day, 150 Day & 200 Day Moving Averages (shown above) increased by +1.98% this week. Therefore, the overall combined average is at 60.16% in the US market (NYSE and Nasdaq markets combined) above their short, medium and long term moving averages.
Read More

Blog
24 November, 2024
Stage Analysis Members Video – 24 November 2024 (58mins)
Stage Analysis members video beginning with a discussion of the weeks Significant Bars, the US Watchlist Stocks in detail on multiple timeframes, the Sector breadth and Sub-industries Bell Curves, the key Market Breadth Charts to determine the Weight of Evidence, the major Crypto Coins and the Major US Stock Market Indexes Update.
Read More
23 November, 2024
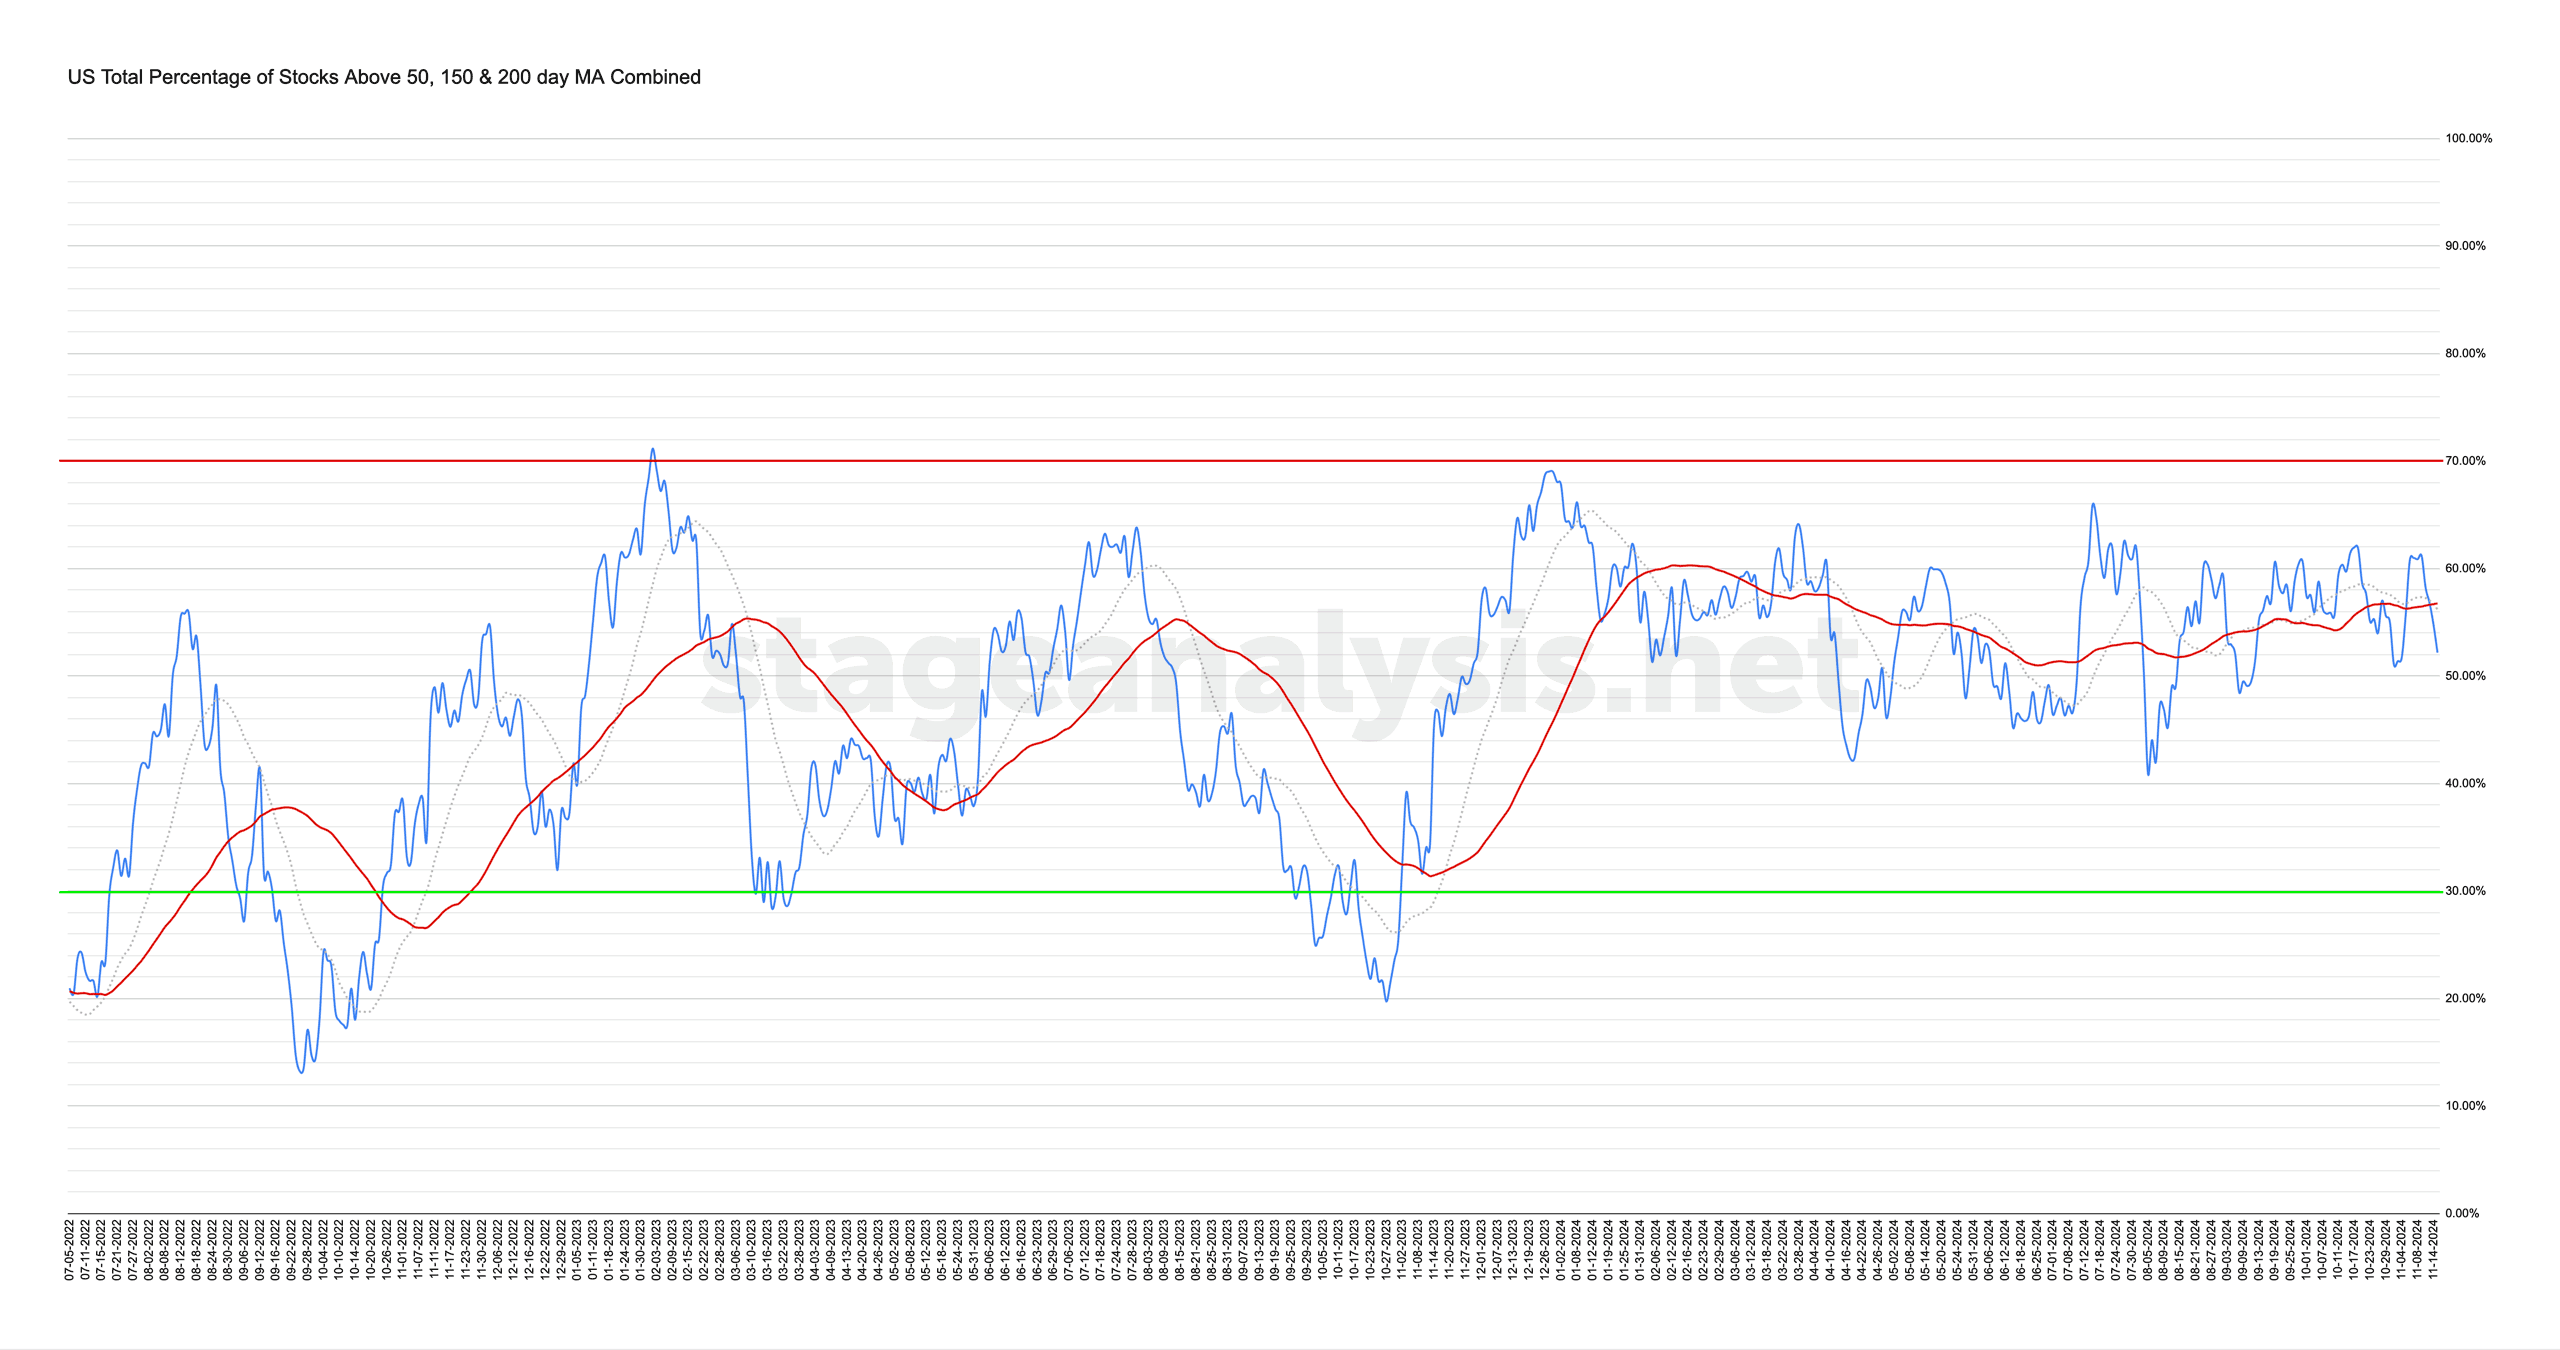
Market Breadth: Percentage of Stocks Above their 50 Day, 150 Day & 200 Day Moving Averages Combined
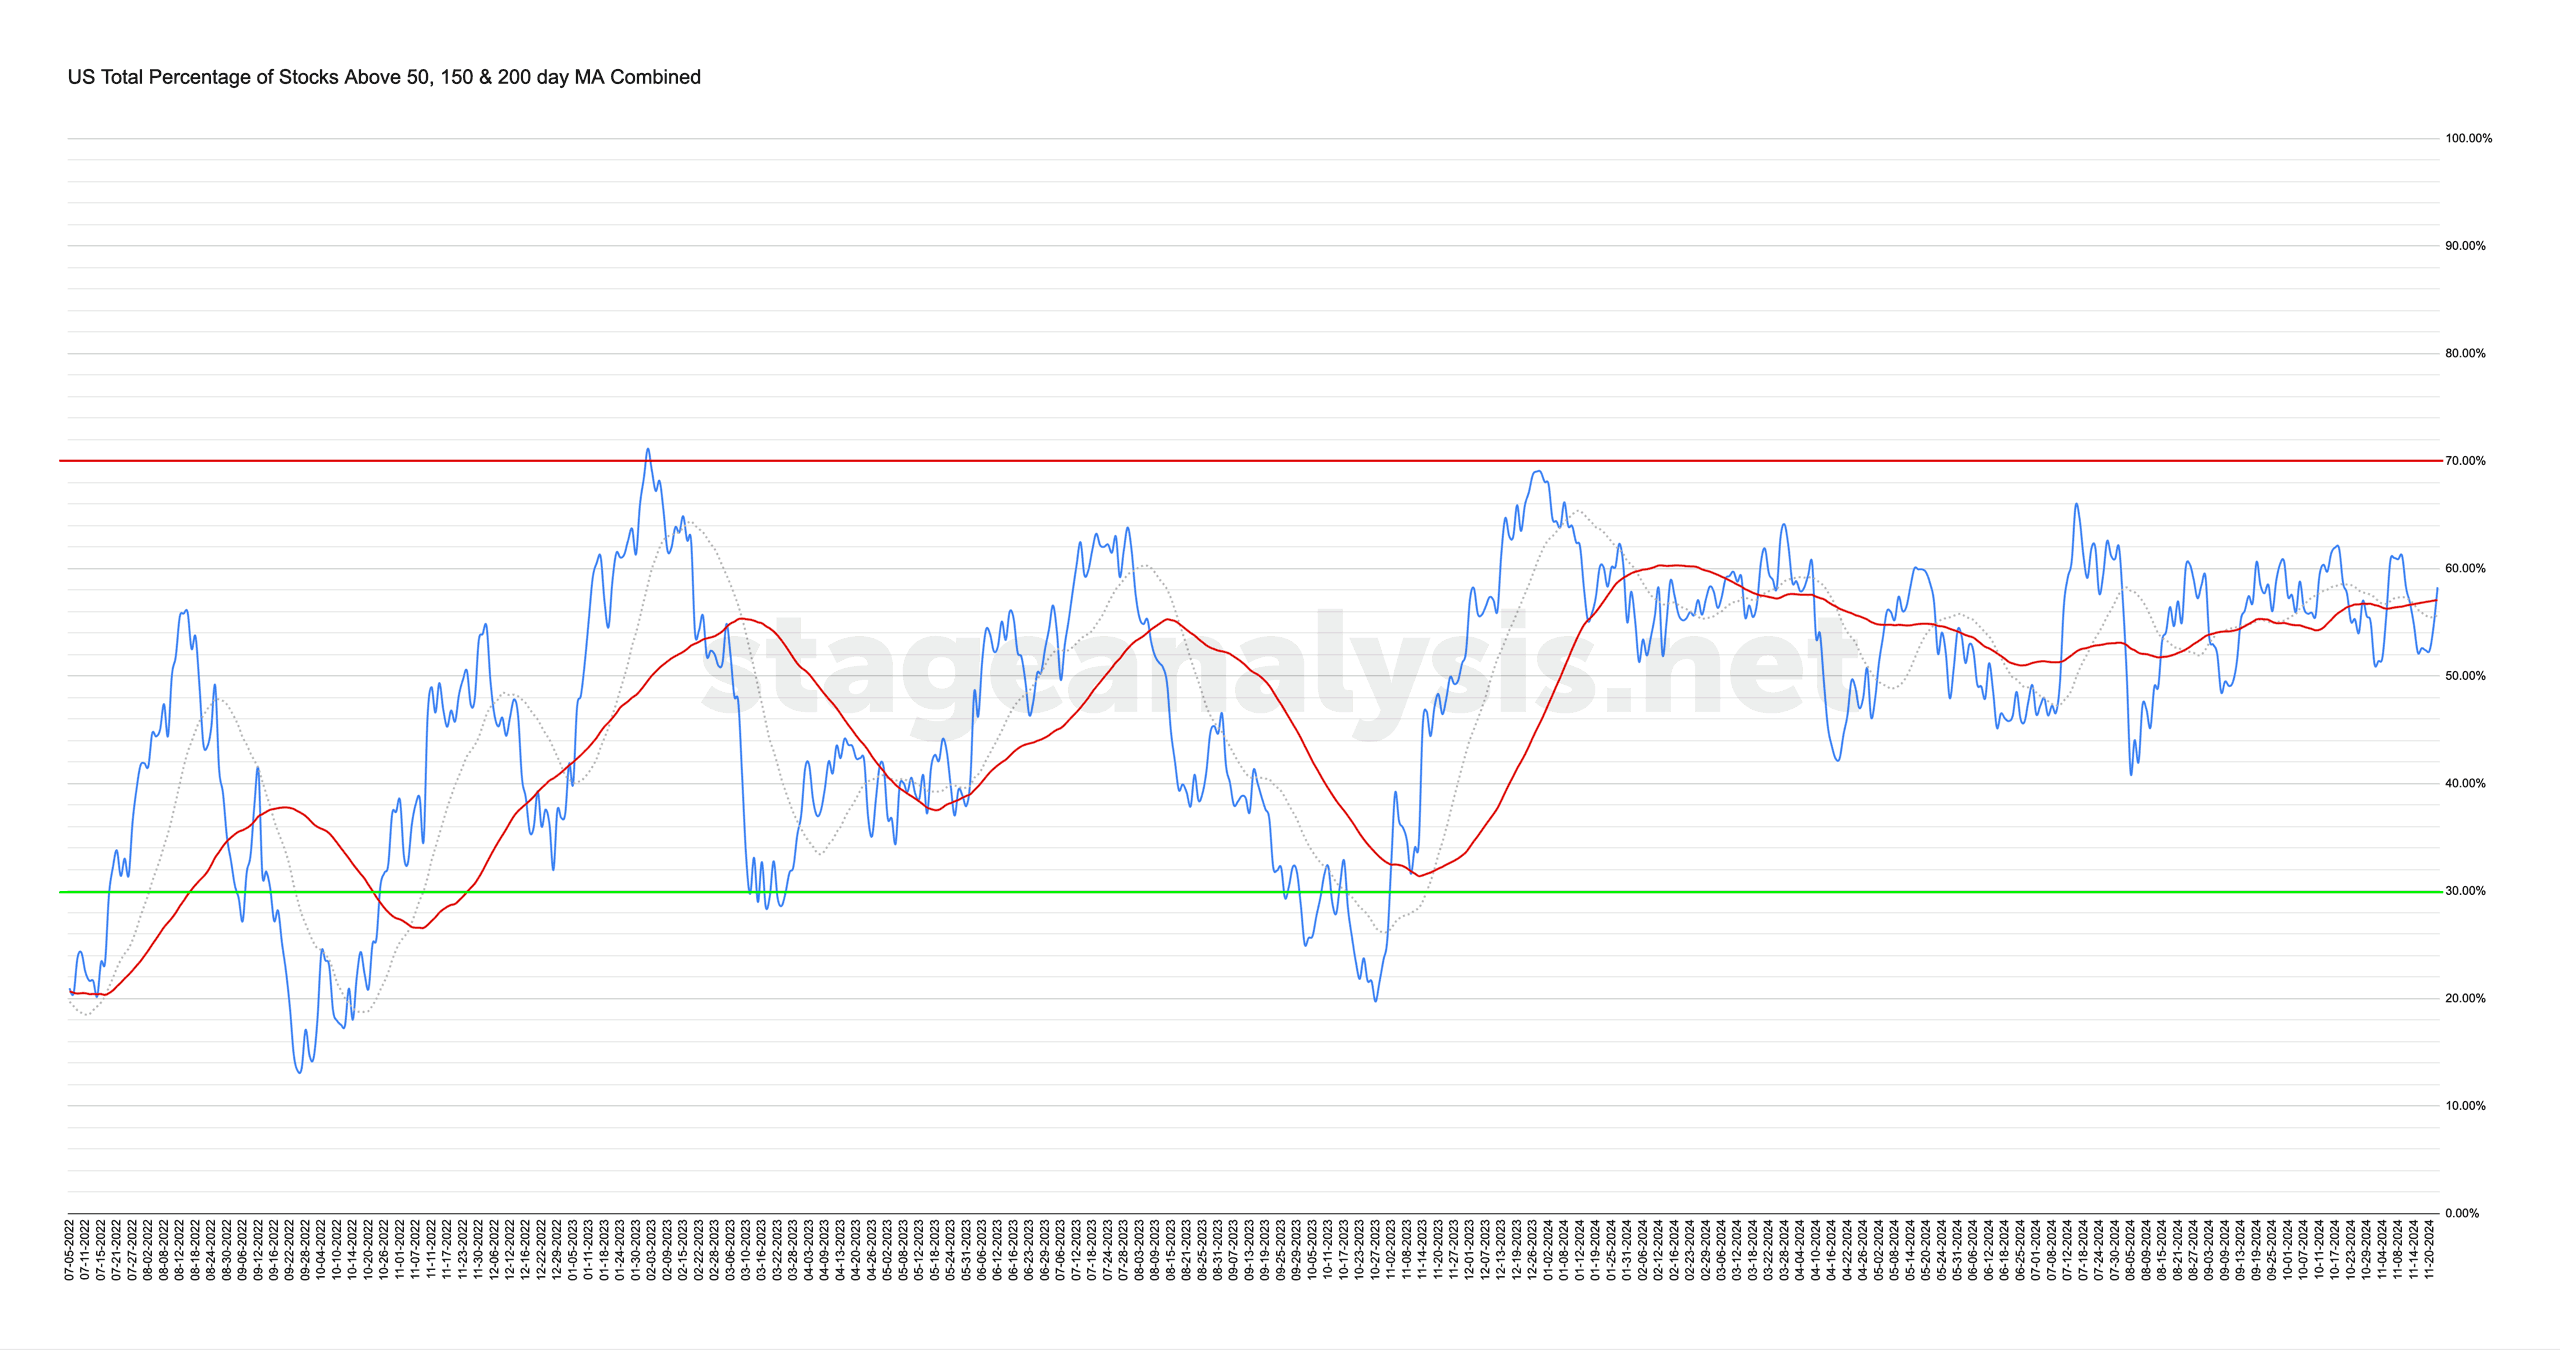
The US Total Percentage of Stocks above their 50 Day, 150 Day & 200 Day Moving Averages (shown above) increased by +6.00% this week. Therefore, the overall combined average is at 58.18% in the US market (NYSE and Nasdaq markets combined) above their short, medium and long term moving averages.
Read More
21 November, 2024
US Stocks Watchlist – 21 November 2024
There were 18 stocks highlighted from the US stocks watchlist scans today...
Read More
17 November, 2024
Stage Analysis Members Video – 17 November 2024 (1hr 1min)
Stage Analysis members video discussing the weeks Significant Bars, the US Watchlist Stocks in detail on multiple timeframes, the Sector breadth and Sub-industries Bell Curves, the key Market Breadth Charts to determine the Weight of Evidence, and the Major US Stock Market Indexes Update.
Read More
16 November, 2024
Market Breadth: Percentage of Stocks Above their 50 Day, 150 Day & 200 Day Moving Averages Combined
The US Total Percentage of Stocks above their 50 Day, 150 Day & 200 Day Moving Averages (shown above) decreased by -8.69% this week. Therefore, the overall combined average is at 52.18% in the US market (NYSE and Nasdaq markets combined) above their short, medium and long term moving averages.
Read More
14 November, 2024
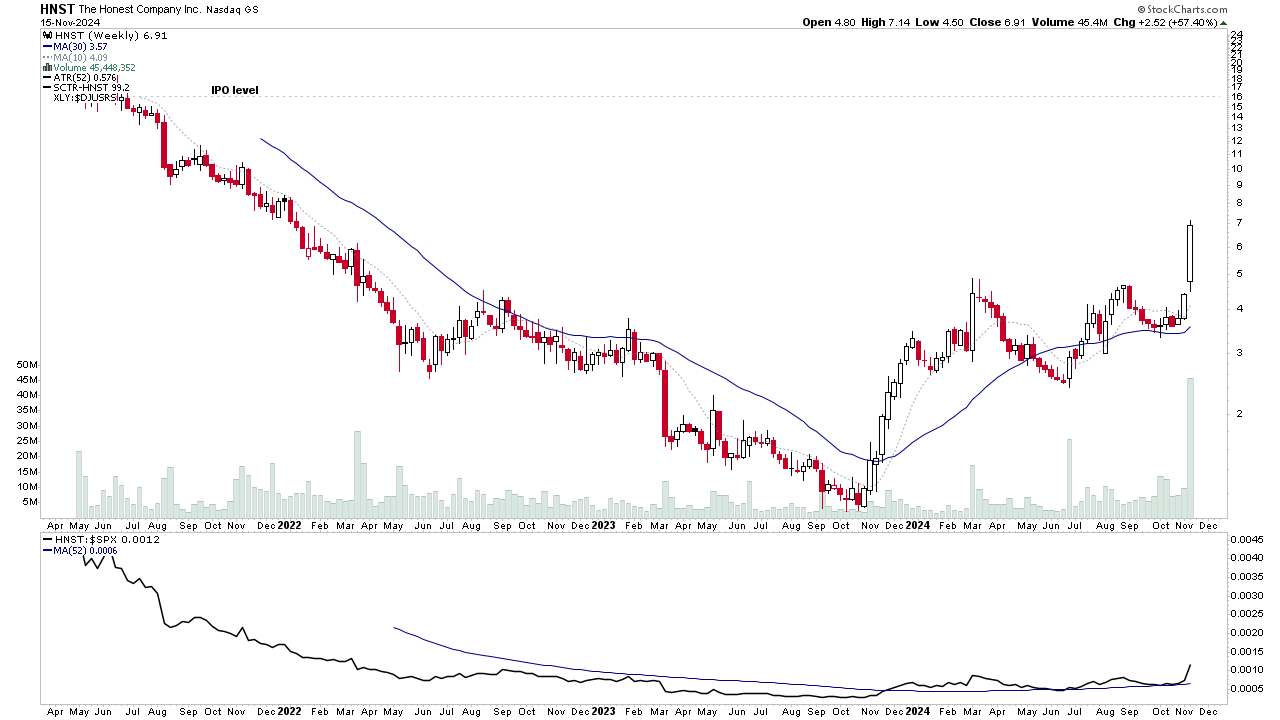
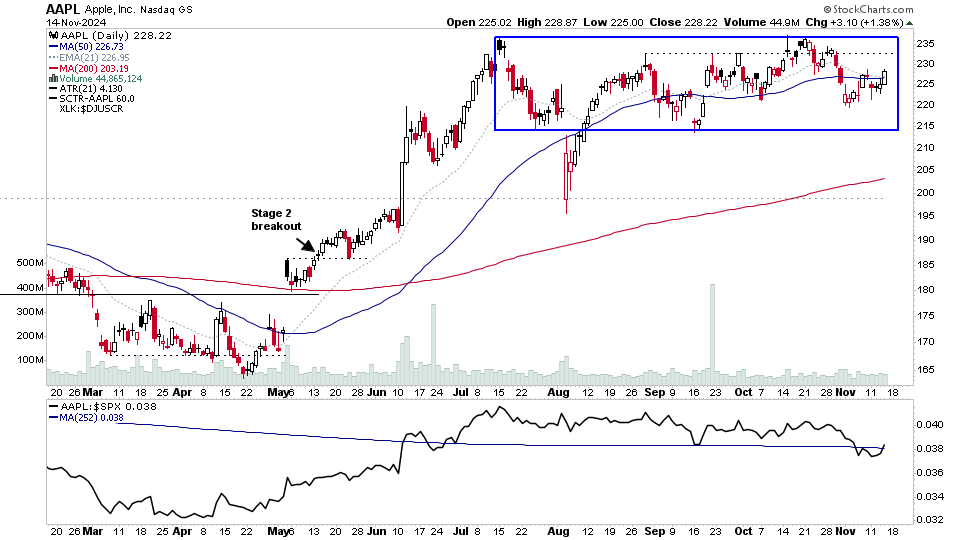
US Stocks Watchlist – 14 November 2024
There were 12 stocks highlighted from the US stocks watchlist scans today...
Read More
10 November, 2024
Stage Analysis Members Video – 10 November 2024 (1hr 12mins)
Stage Analysis members video discussing the large amount of Significant Bars this week, plus the US Watchlist Stocks in detail on multiple timeframes, the Sector breadth and Sub-industries Bell Curves, the key Market Breadth Charts to determine the Weight of Evidence, Bitcoin and Ethereum both Stage 2 again, and the Major US Stock Market Indexes Update.
Read More
09 November, 2024
Market Breadth: Percentage of Stocks Above their 50 Day, 150 Day & 200 Day Moving Averages Combined
The US Total Percentage of Stocks above their 50 Day, 150 Day & 200 Day Moving Averages (shown above) increased by +9.48%% this week. Therefore, the overall combined average is at 60.86% in the US market (NYSE and Nasdaq markets combined) above their short, medium and long term moving averages.
Read More
08 November, 2024
US Stocks Watchlist – 7 November 2024
There were 10 stocks highlighted from the US stocks watchlist scans today...
Read More