This week saw a huge shakeout in the leadership stocks with numerous tech and healthcare stocks dropping up to -20% in a just a few days from their highs. However, there is a chance that it was just a shakeout by the markets in order to let the larger players load up on the stronger stocks at a lower price. But this opinion now needs confirmation, as although some traders jumped back in immediately on the assumption of a shakeout. The price action of many stocks that got hit failed to recover with much strength, and still closed the week significantly lower than the previous week, even though they recovered half or more of the drop.
Read More

Blog
24 May, 2020
US Major Indexes and Market Breadth Update - 24th May 2020
Stock Indexes continued higher for another week, with small caps showing the most strength, as a number of the previous leaders struggled. But some laggards got a boost, so are we seeing some rotation into the weaker areas of the market.
Read More
17 May, 2020
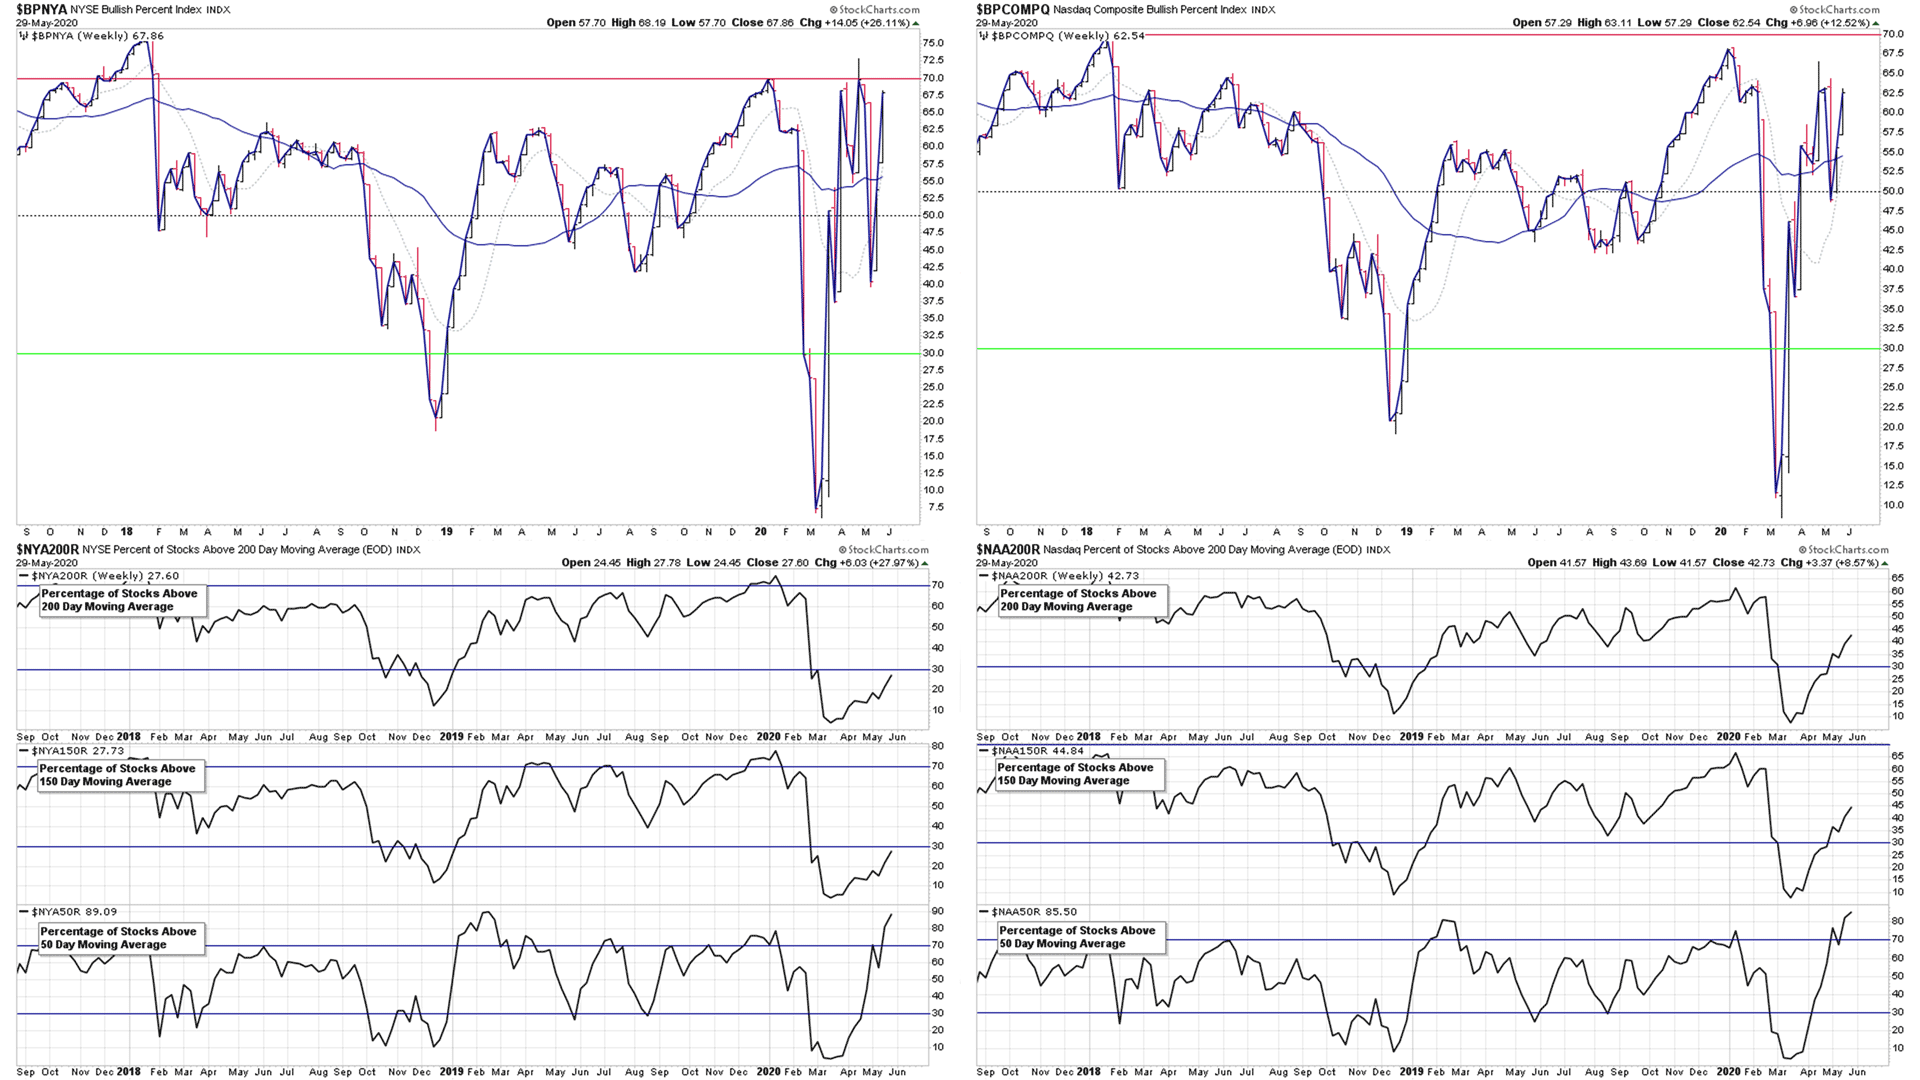
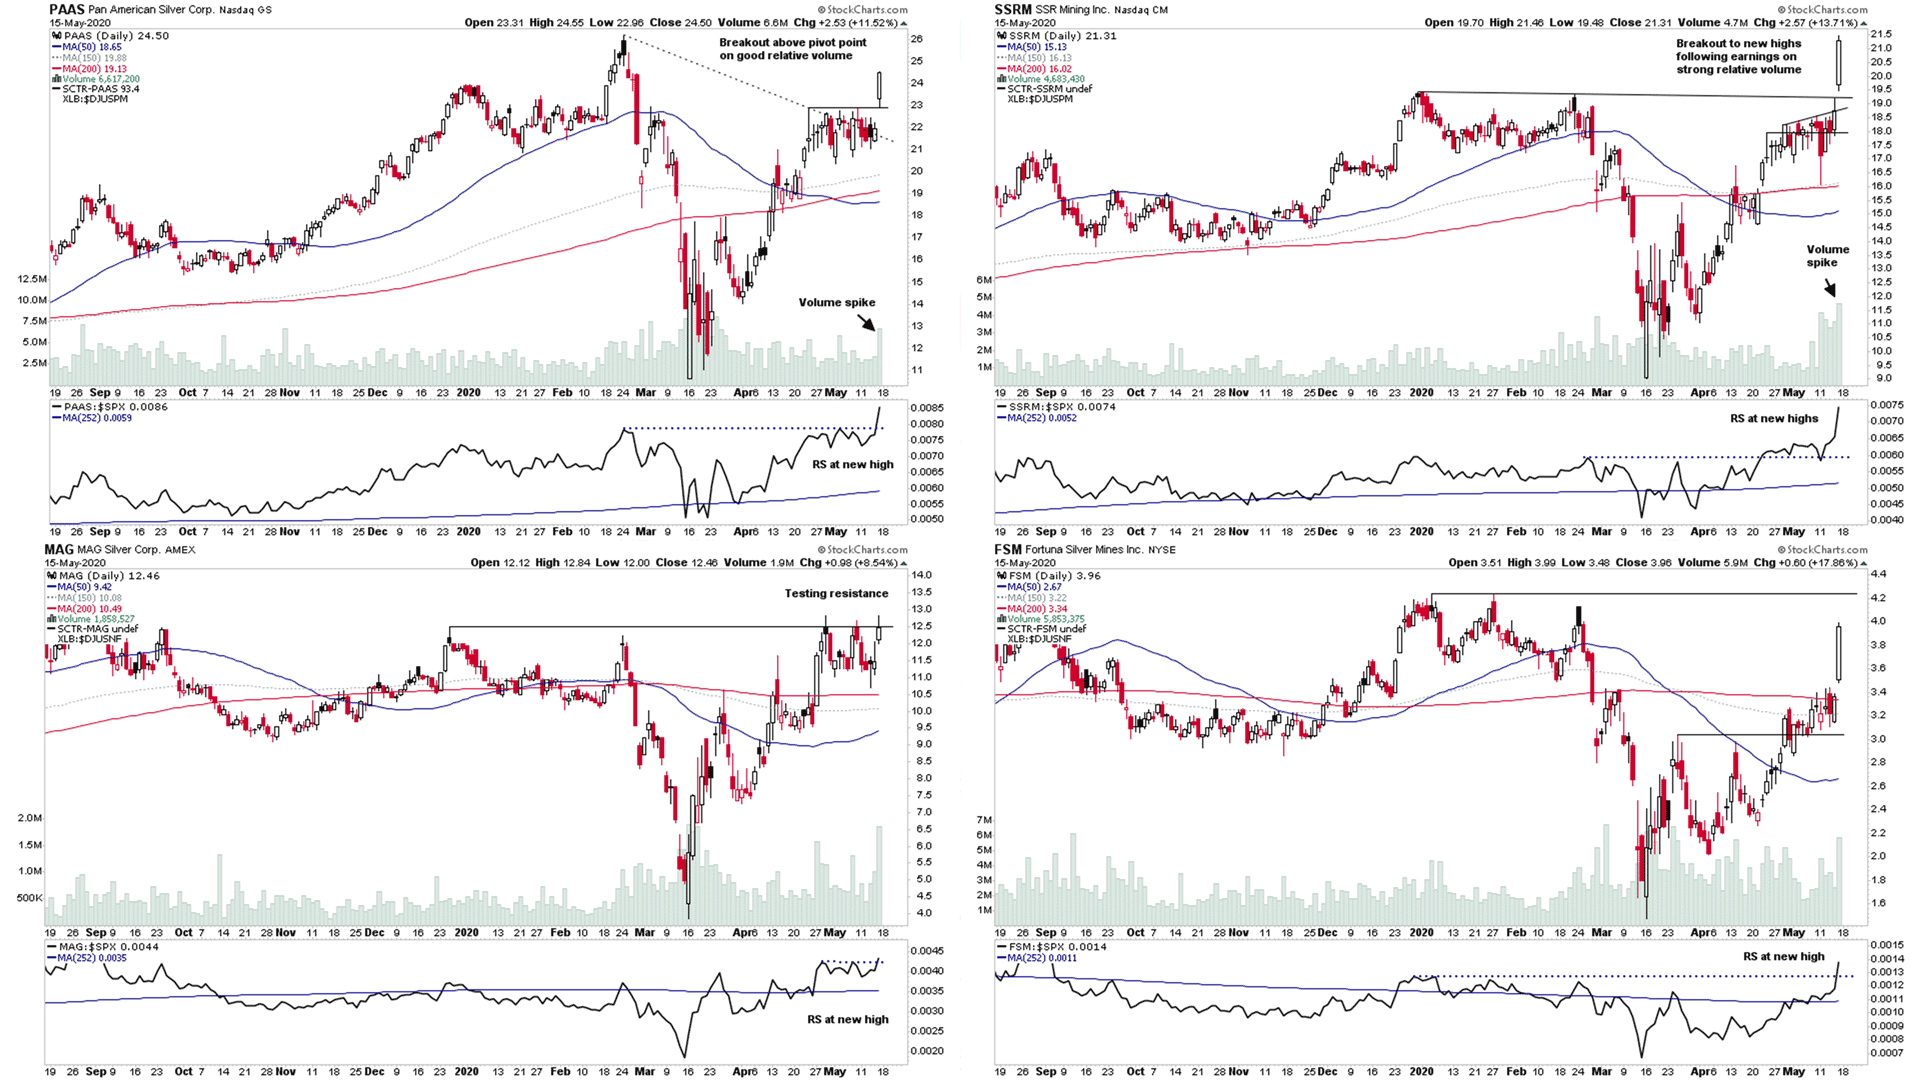
Market Breadth Indicators Signal Weakness and Multiple Breakouts in the Gold & Silver Mining Sector
A number of the key market breadth indicators weakened this week, with moves back to bearish signals in multiple indicators that had been positive for the last month or so, like the NYSE Bullish Percent Index which moved back to Bear Confirmed status on the 13th...
Read More
10 May, 2020
US Major Indexes and Market Breadth Update - 10th May 2020
The indexes had a strong week, after a few weeks of indecision, with the Nasdaq indexes making new weekly highs, but the majority of other indexes didn't manage to clear the previous weeks highs although they did close strongly on Friday.
Read More
02 May, 2020
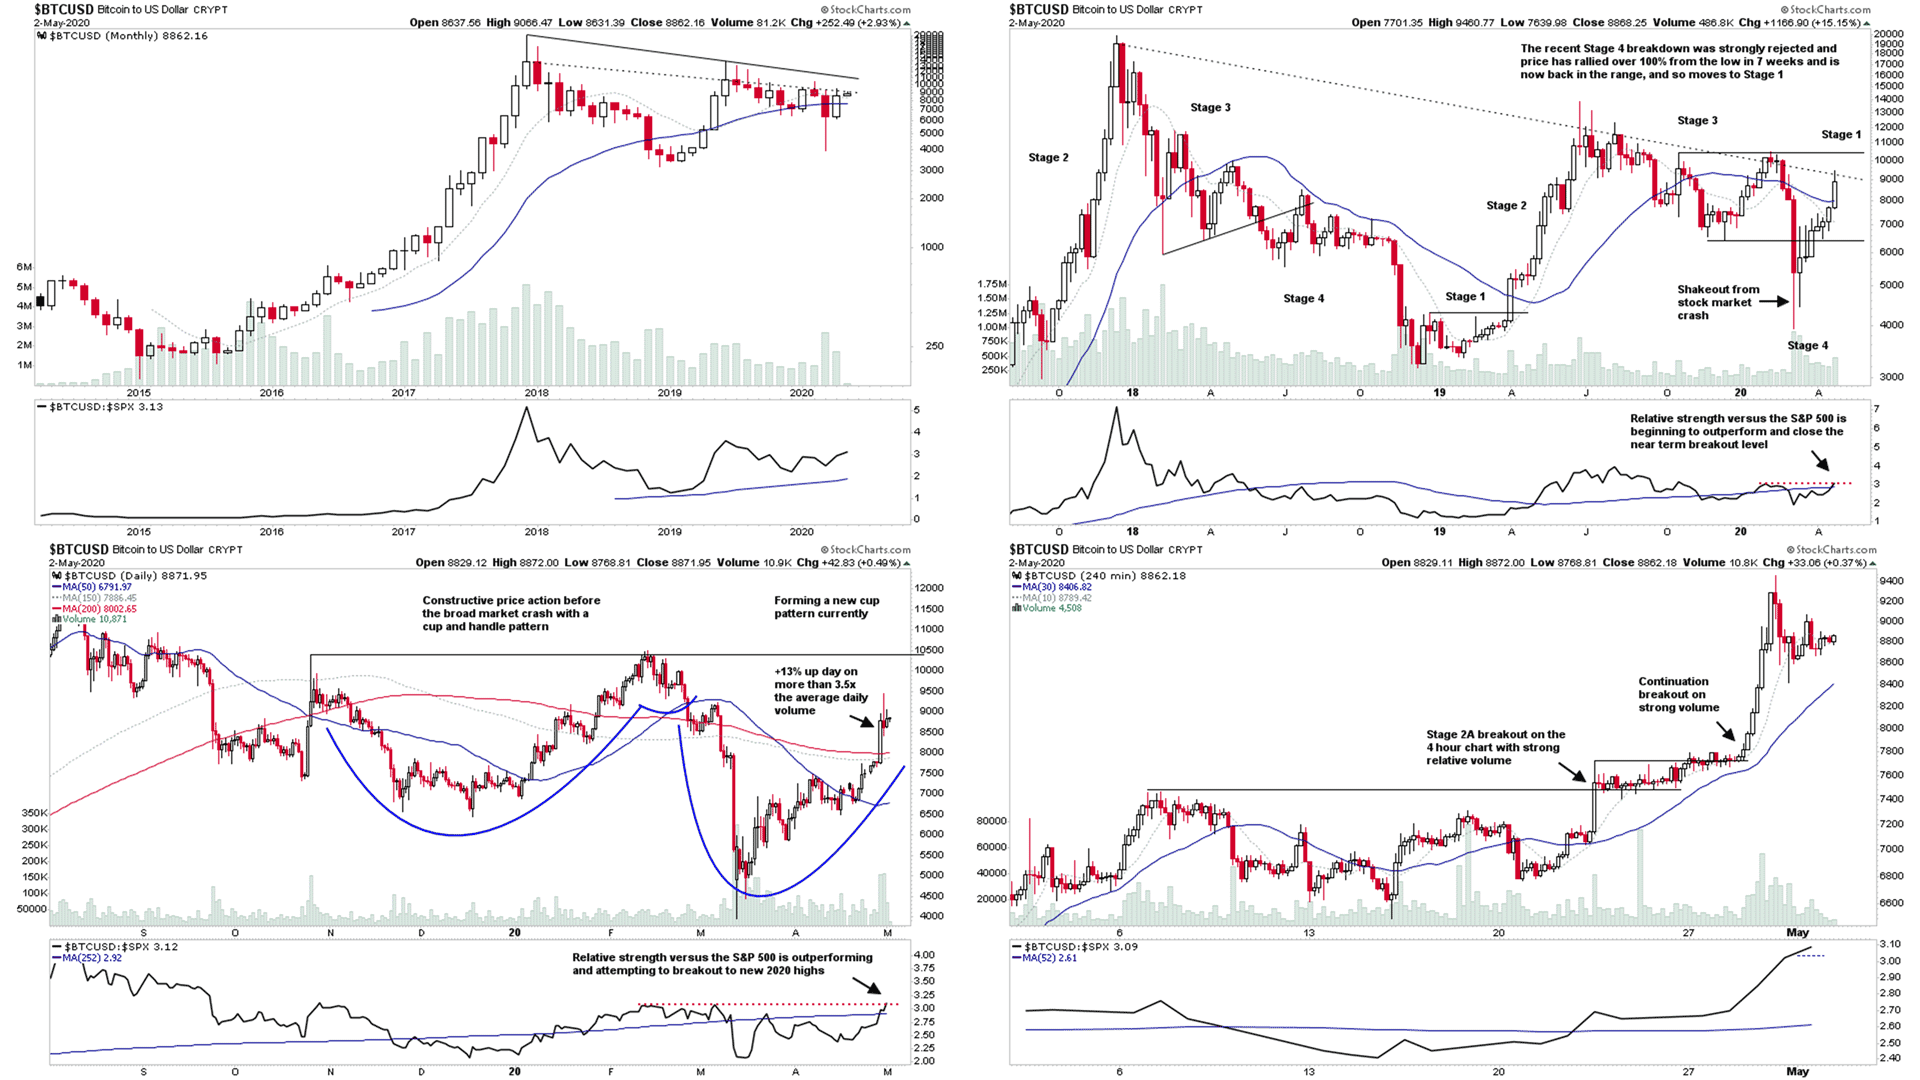
Has the Bear Market Bounce Run Out of Momentum? Market Roundup Plus Focus on Gold Miners and Bitcoin
The major US stock market indexes are once again at a potential turning point, with multiple failed breakout attempts over the last week in individual stocks and the market indexes themselves, which caused them to close slightly down on the week. But with a large wick on the upper part of the candle which is often bearish. But needs confirmation still.
Read More
19 April, 2020
US Major Indexes and Market Breadth Update
Another positive week in the market. But mostly for Technology, Health Care and Consumer Staples stocks, as the disparity between the sectors continues to grow
Read More
12 April, 2020
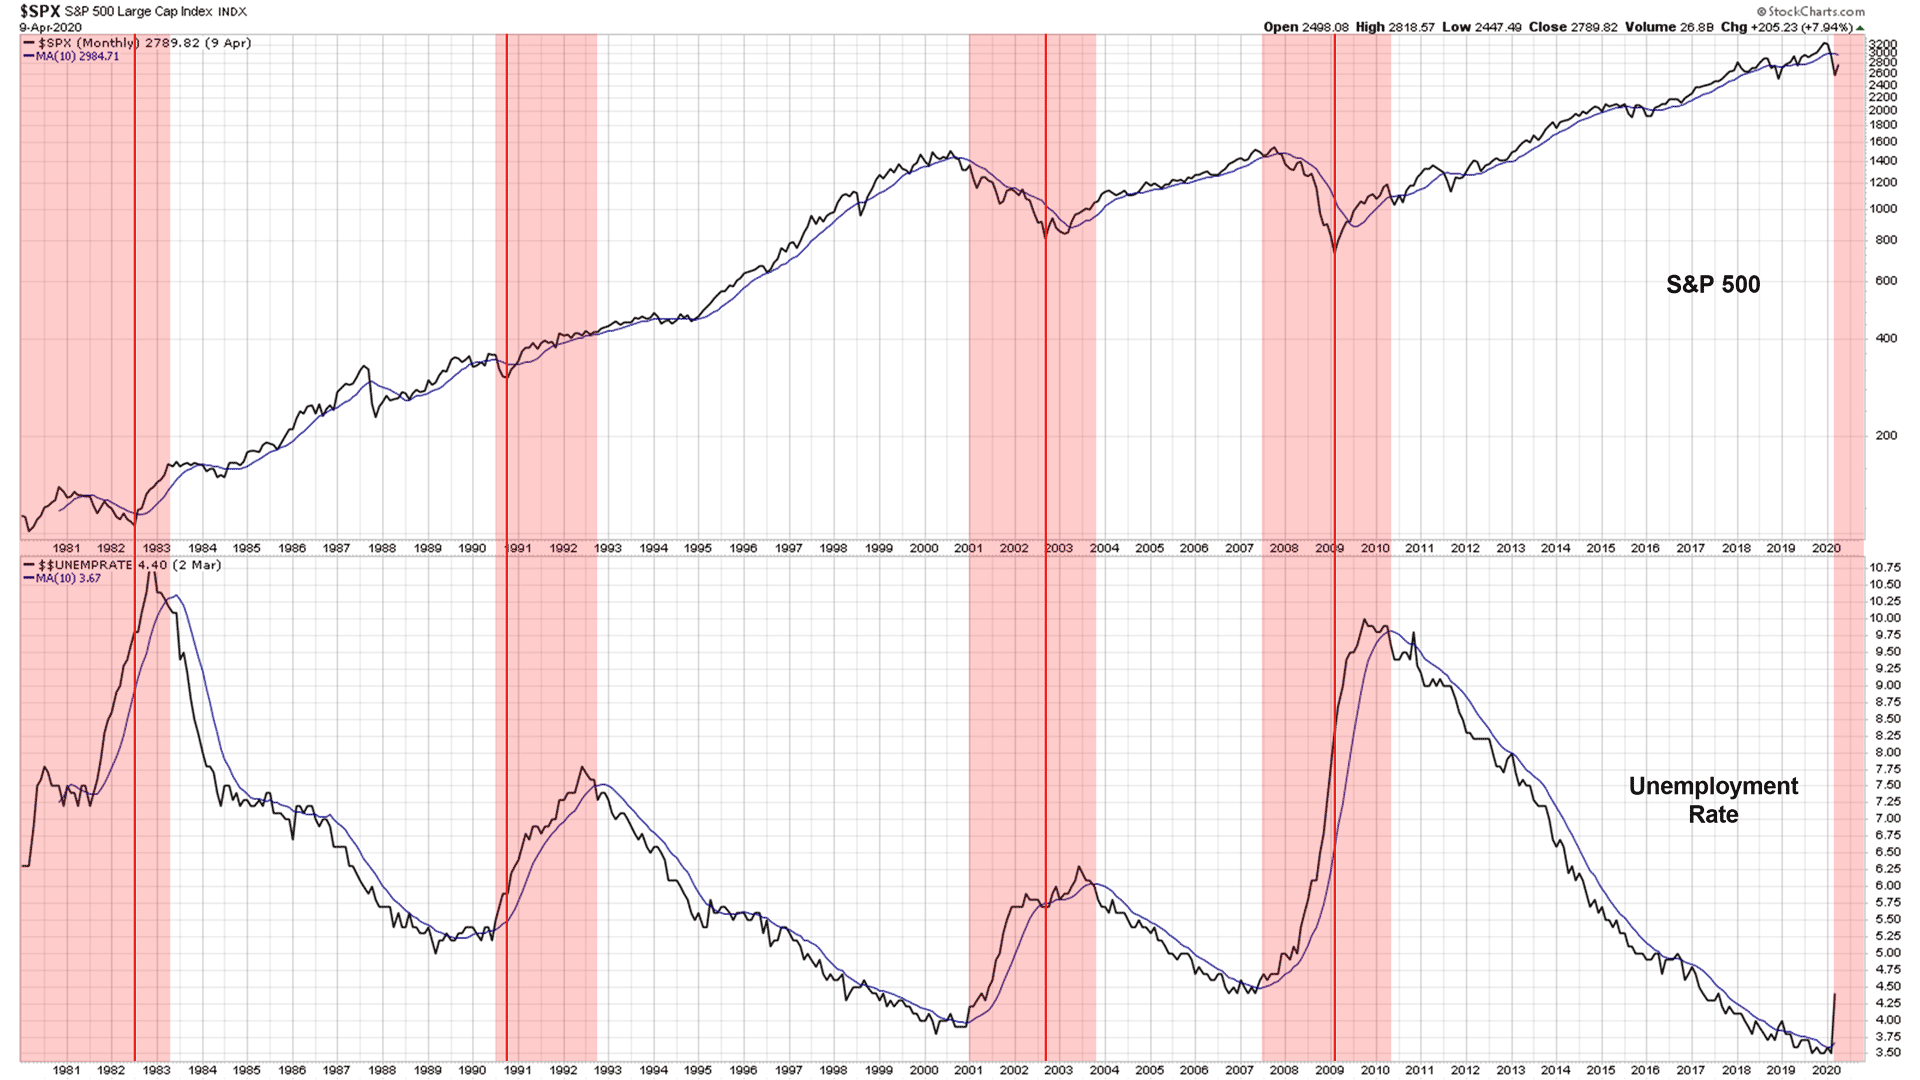
Does a New Uptrend in the Unemployment Rate Mean That a Bear Market Is Just Getting Started?
Many of the short term market breadth indicators continued to gain strength and multiple are now on bullish signals. However, the medium and longer term signals mostly remain on bearish signals, with some struggling to make much headway from their extreme low levels such as the NYSE percentage of stocks above their 150 day moving averages and the cumulative new highs new lows for example.
Read More
05 April, 2020
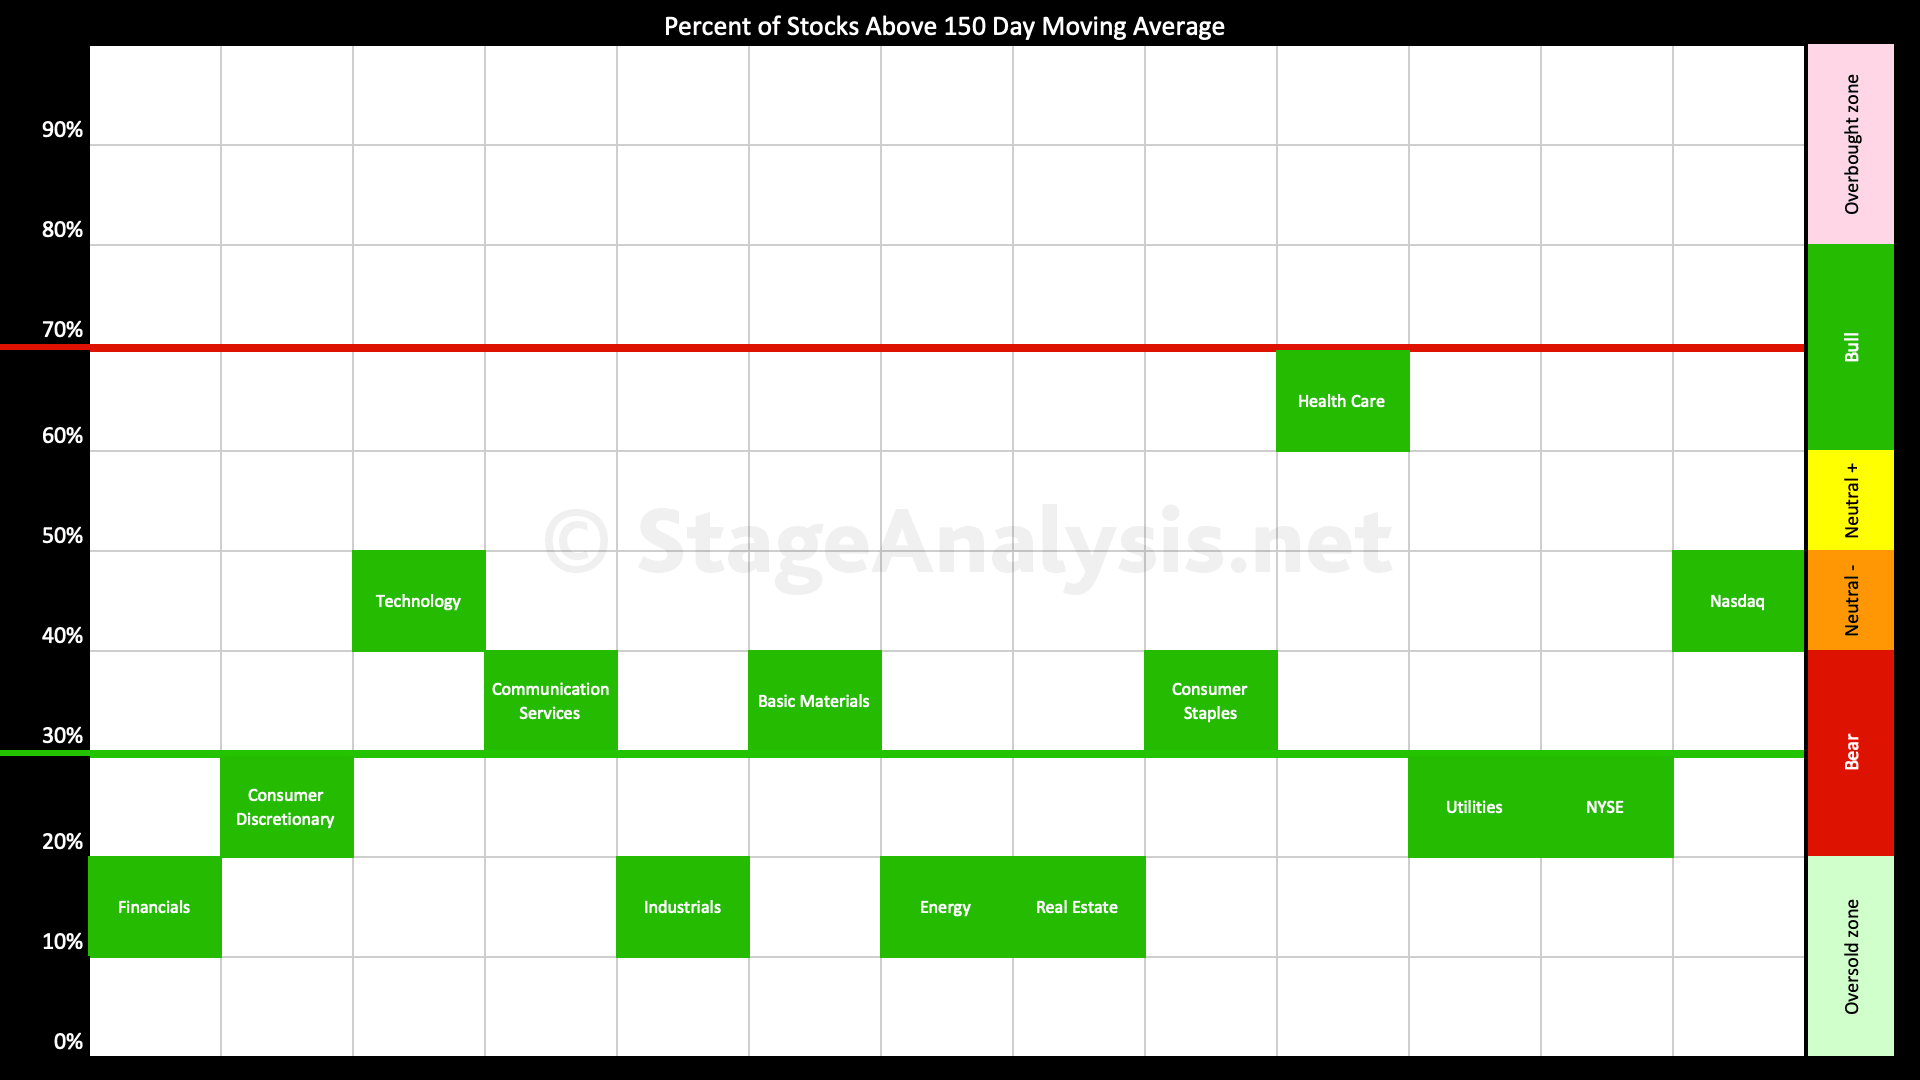
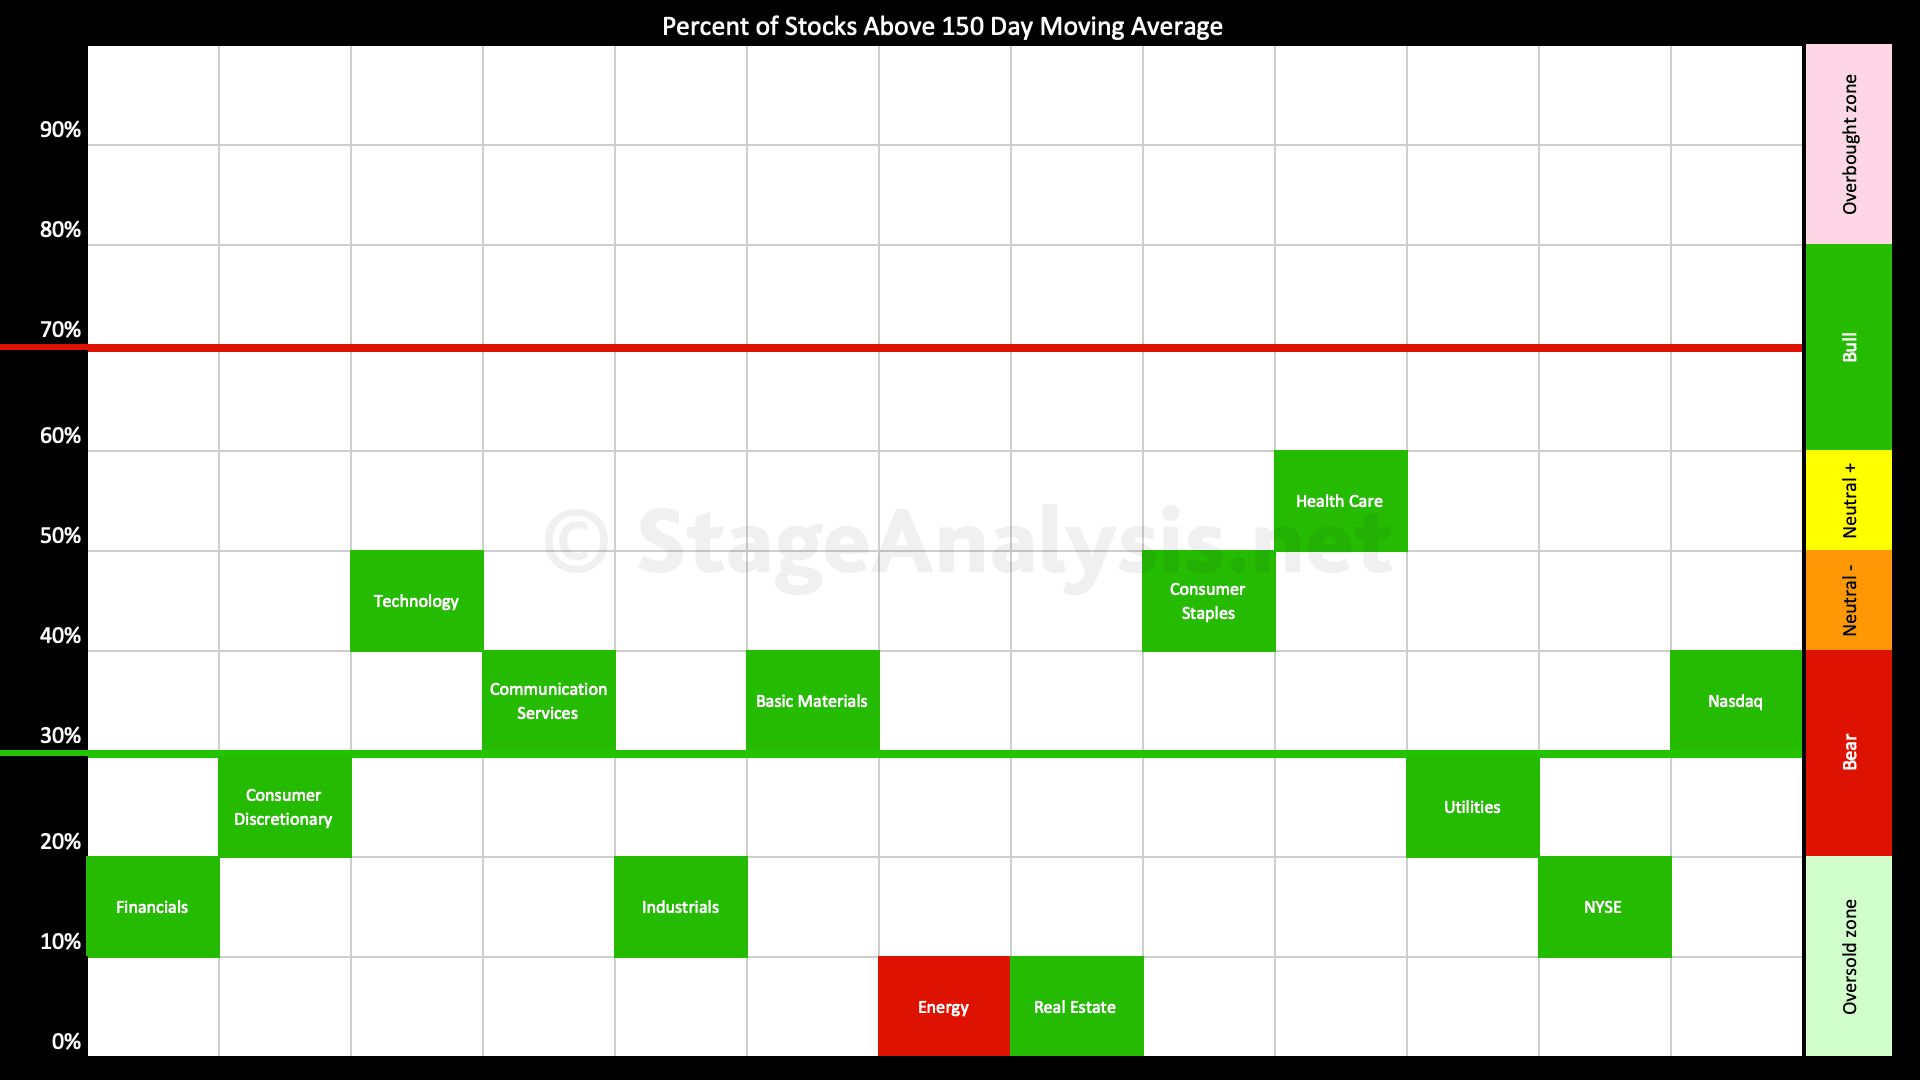
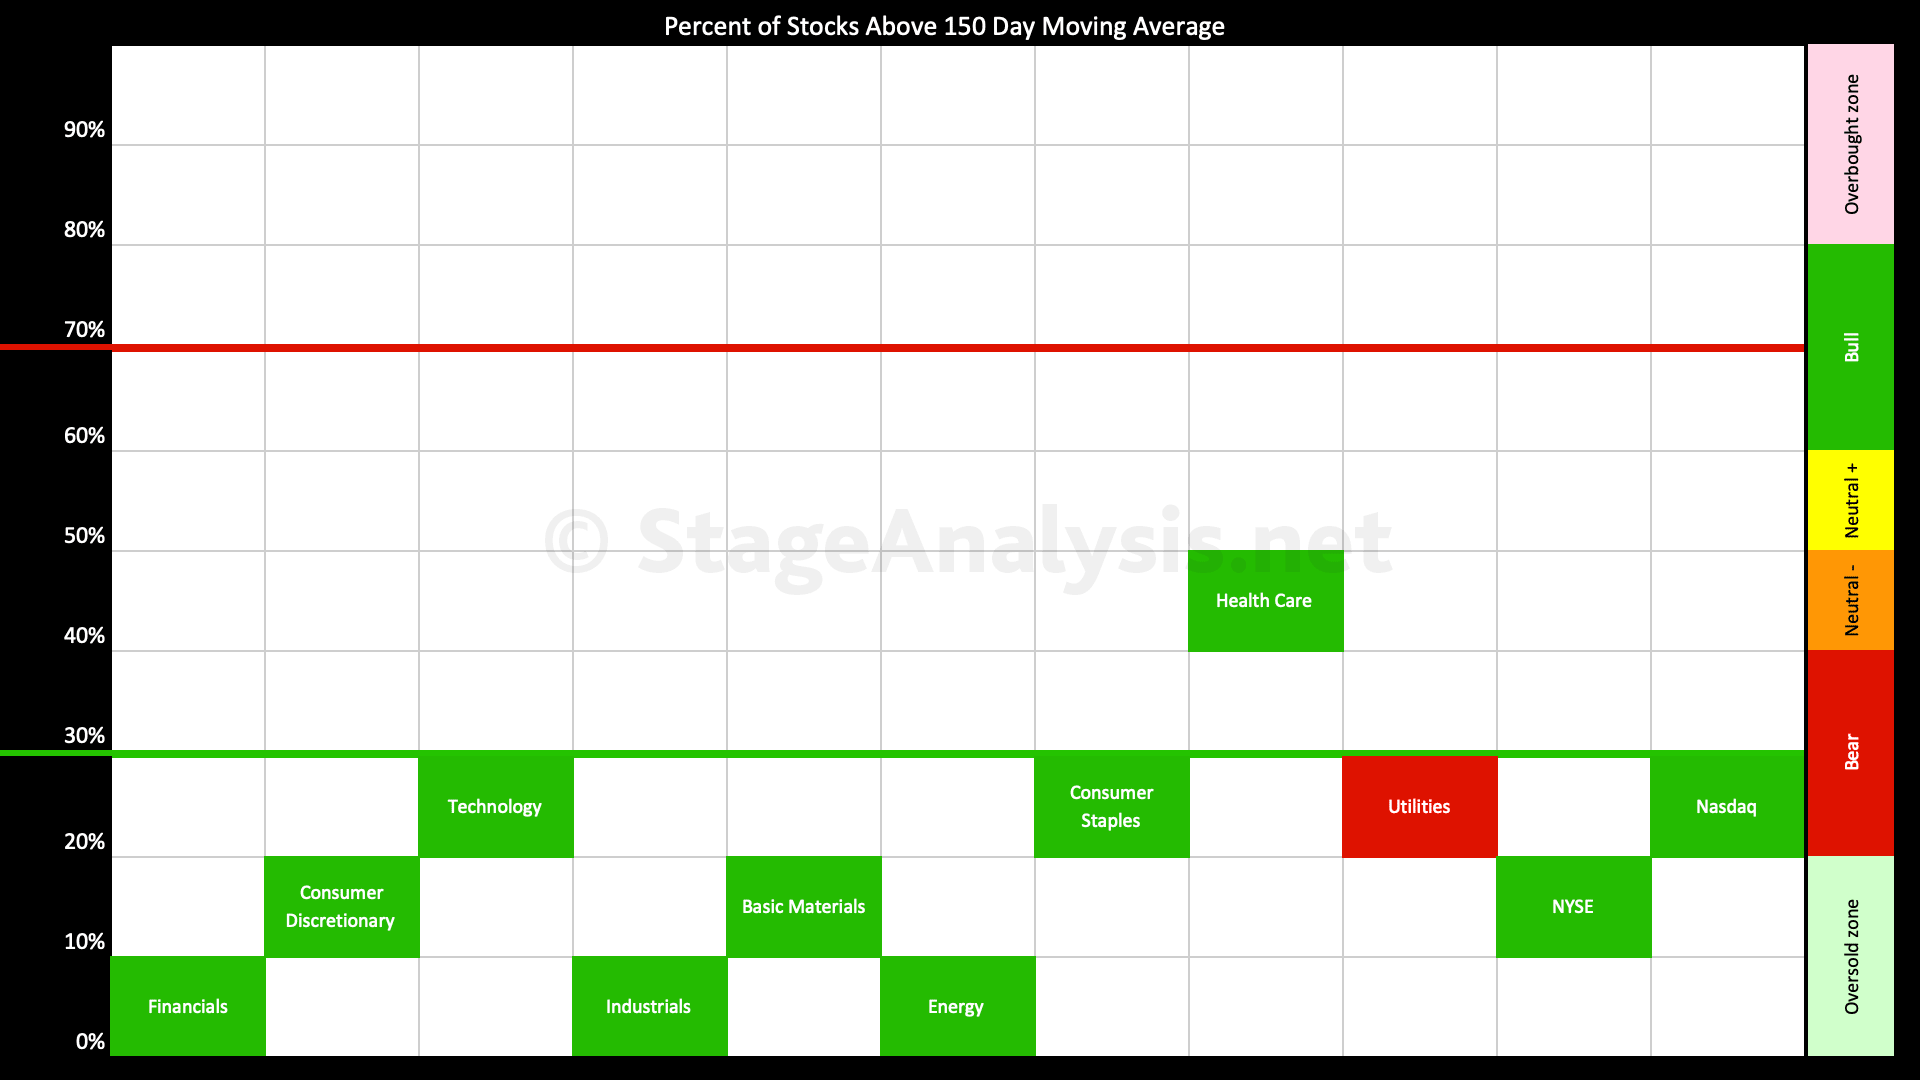
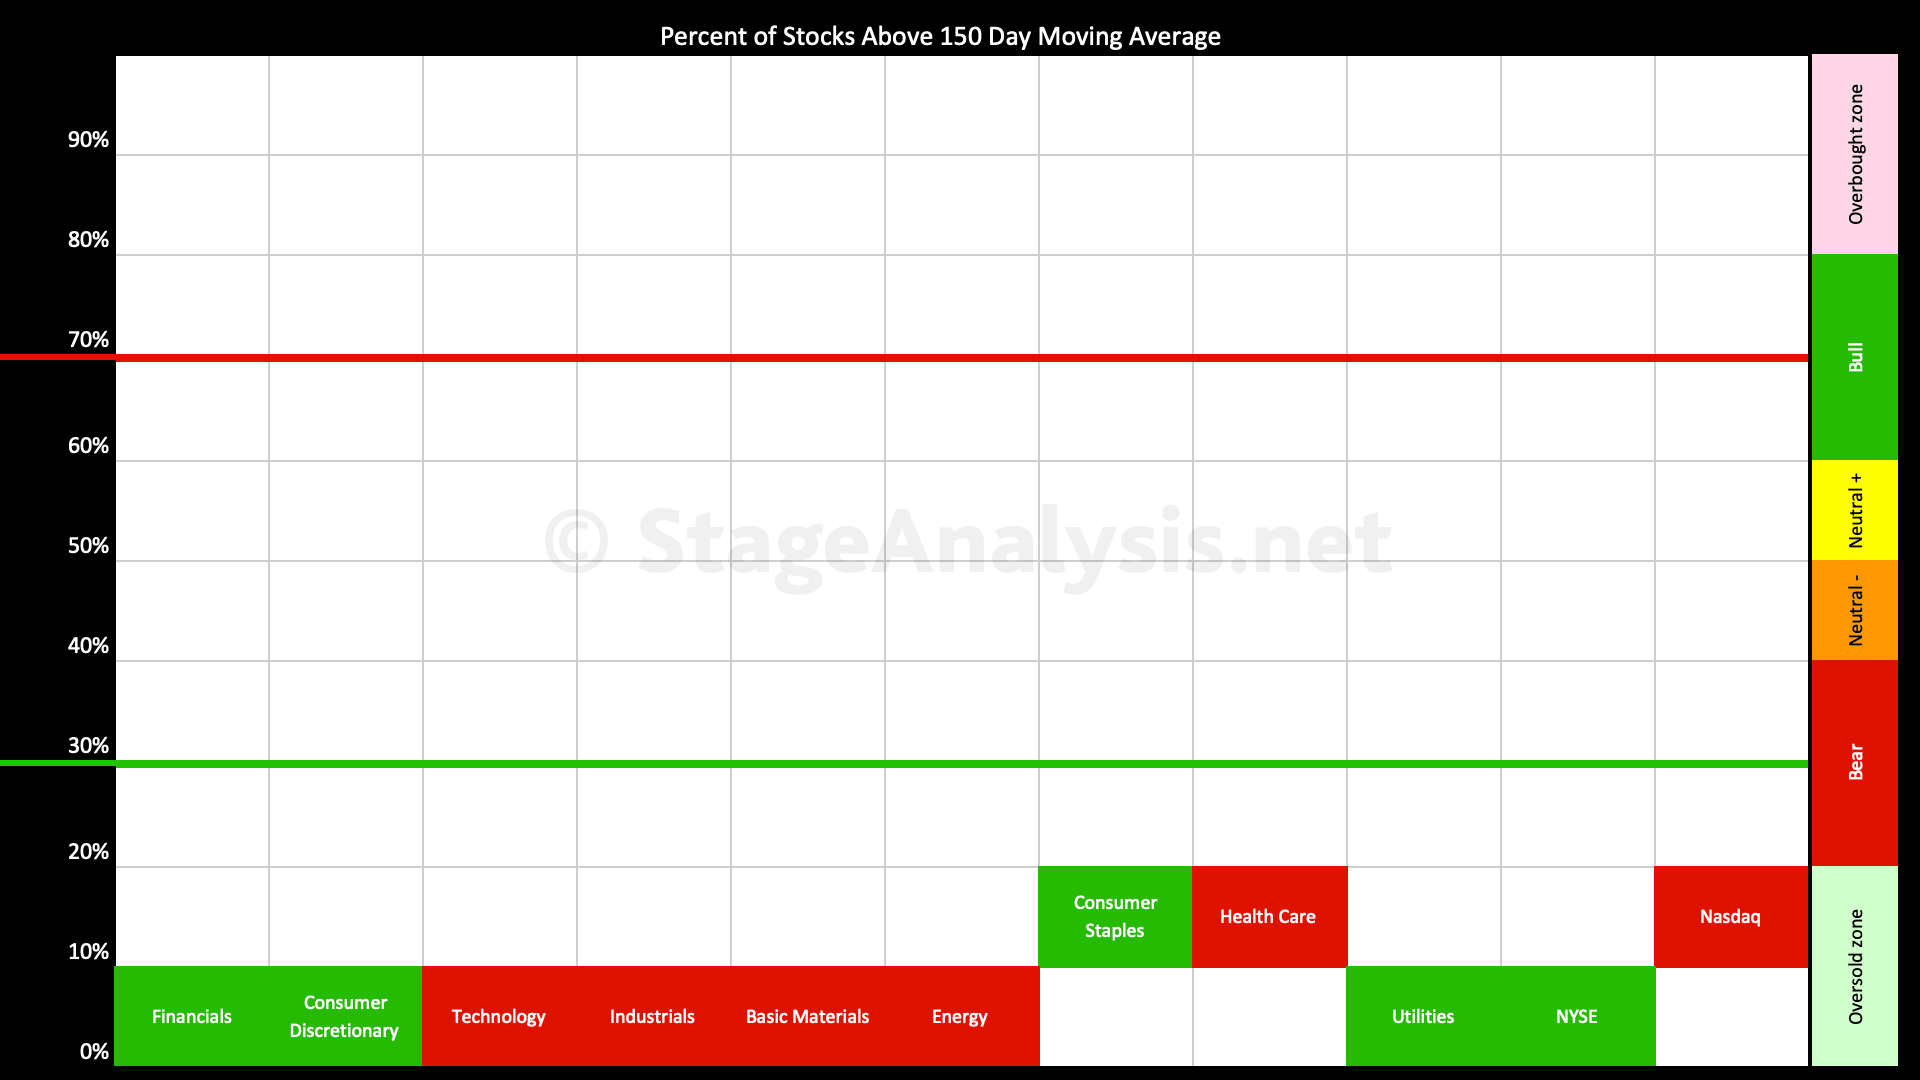
US Sectors - Percent of Stocks Above their 150 Day Moving Average
Percent of Stocks Above their 150 Day Moving Average table in each sector, which is ordered by overall health.
Read More
29 March, 2020
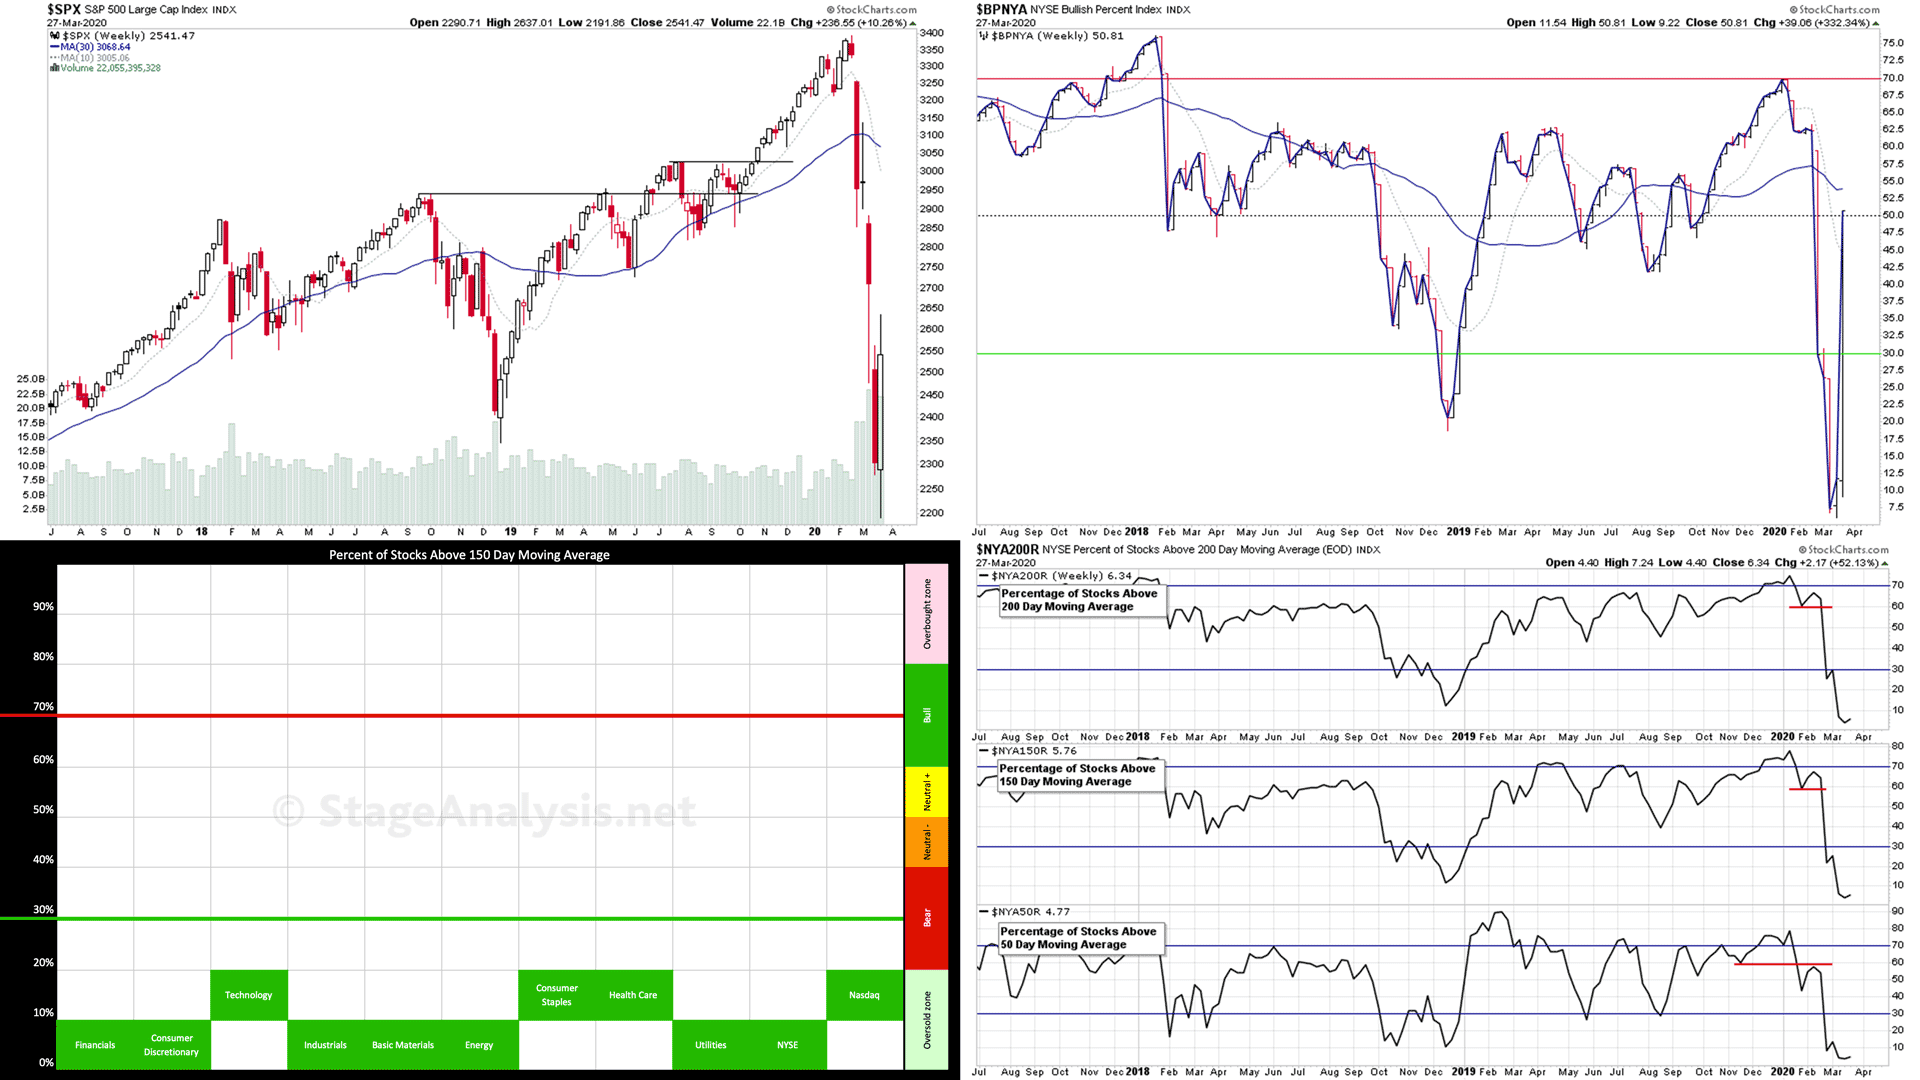
The Stock Market Has Put in a Bottom. What Do the Market Breadth Charts Suggest Next for Stocks?
It was a strong week for the major stock market indexes with multiple stock index charts closing the week with a bullish engulfing candle pattern.
Read More
22 March, 2020
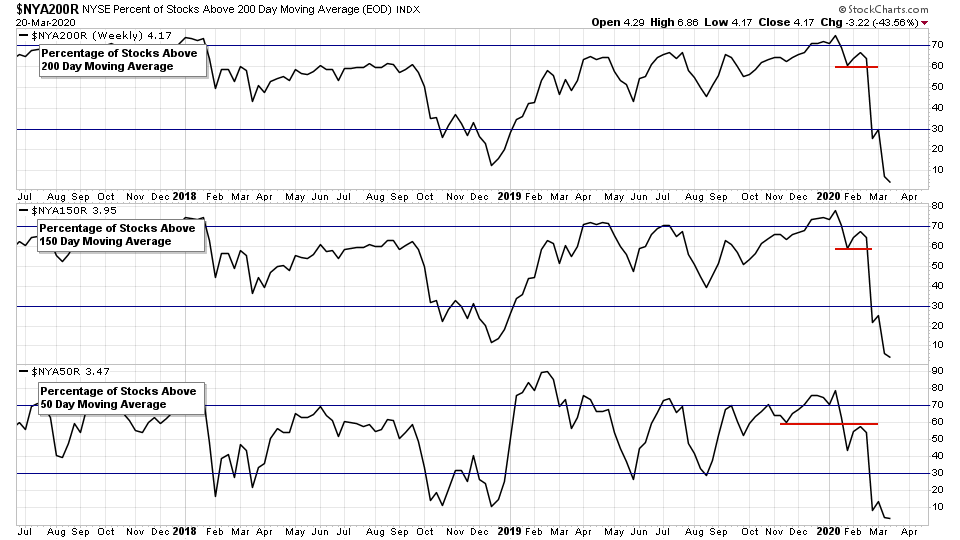
Stock Market Indexes Update & Market Breadth Charts. Nearing Capitulation?
The stocks markets indexes and individual stock charts continued on tear lower this week, in deep Stage 4 territory for most. The bounce at the end of last week suckered in more people, only for the markets to rip lower again this week. Closing this time near the lows of the week.
Read More