Members midweek video covering the market and watchlist stocks...
Read More

Blog
09 March, 2022
Stage Analysis Members Midweek Video - 9 March 2022
06 March, 2022
Stage Analysis Members Weekend Video - Part 1 - 6 March 2022
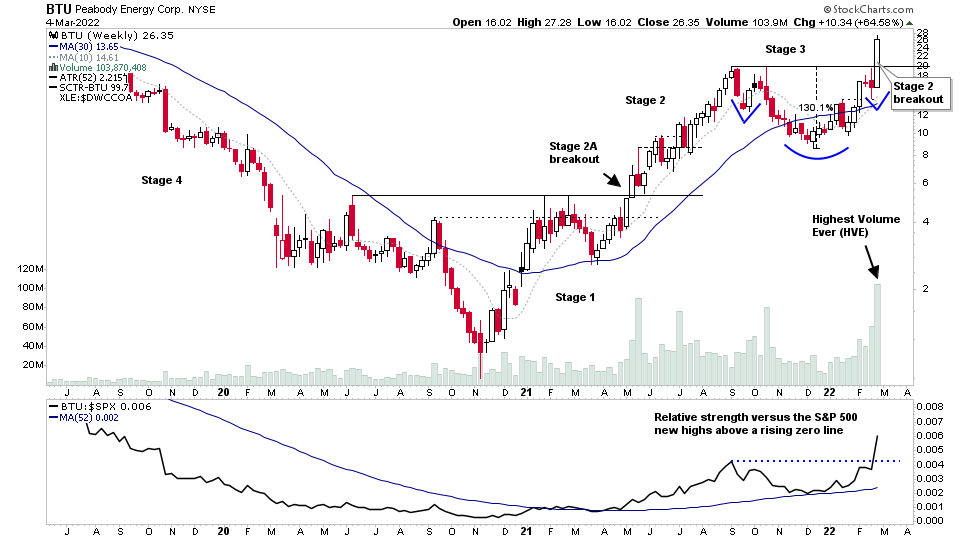
Stage Analysis Members Video covering - BTU Stage 2 Breakout Analysis and Targets. Group Focus on Coal, Defense, Cybersecurity. Major Indexes review: i.e. S&P 500, Nasdaq, Russell 2000 and more Market Breadth Update to Determine the Current Weight of Evidence
Read More
03 March, 2022
Stage Analysis Members Midweek Video - 2 March 2022 and US Stocks Watchlist - 2 March 2022
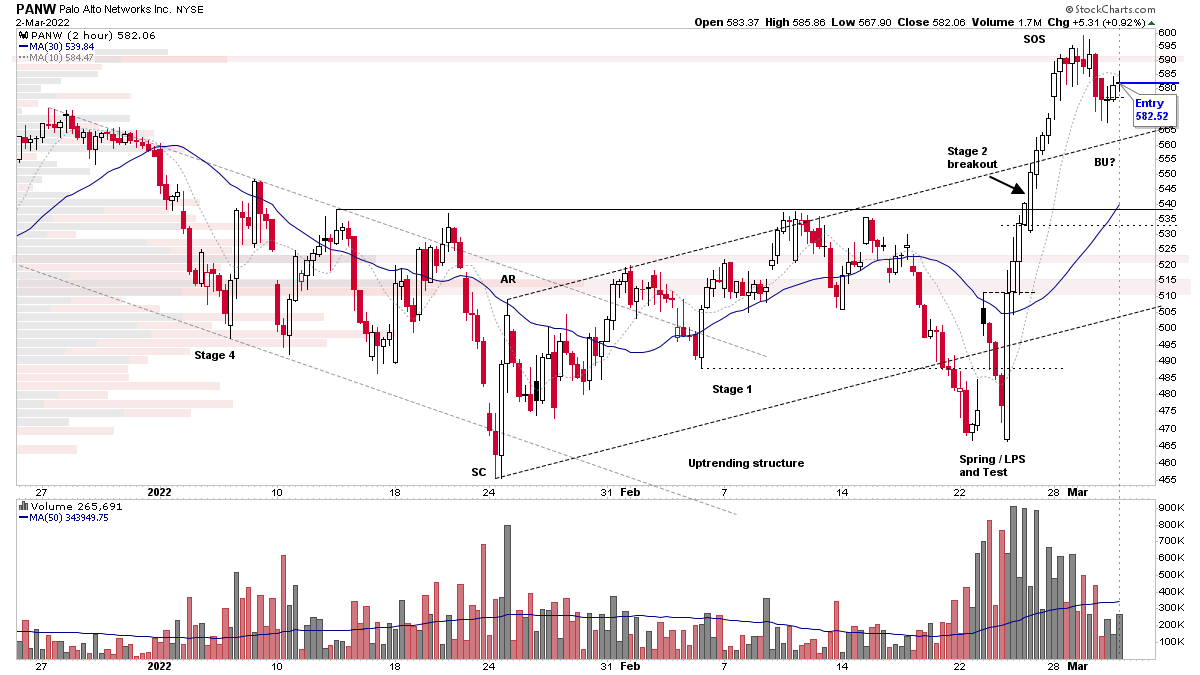
Members video with explanation of PANW trade entry, Cyber Security Group Stocks in Focus, Major Indexes Review & VIX, Short Term Market Breadth, Physical Silver and the Silver Miners, Uranium Group Stocks
Read More
01 March, 2022
Silver approaching the Stage 2 breakout level and US Stocks Watchlist - 1 March 2022
There were 20 stocks for the US stocks watchlist today. Here's a small sample from the list: AAPL, PANW, TSLA, WPM + 16 more...
Read More
27 February, 2022
Stage Analysis Members Weekend Video - 27 February 2022 (1hr 16mins)
Weekend update covering the major indexes, market breadth, industry group relative strength tables and the weekend US stocks watchlist...
Read More
27 February, 2022
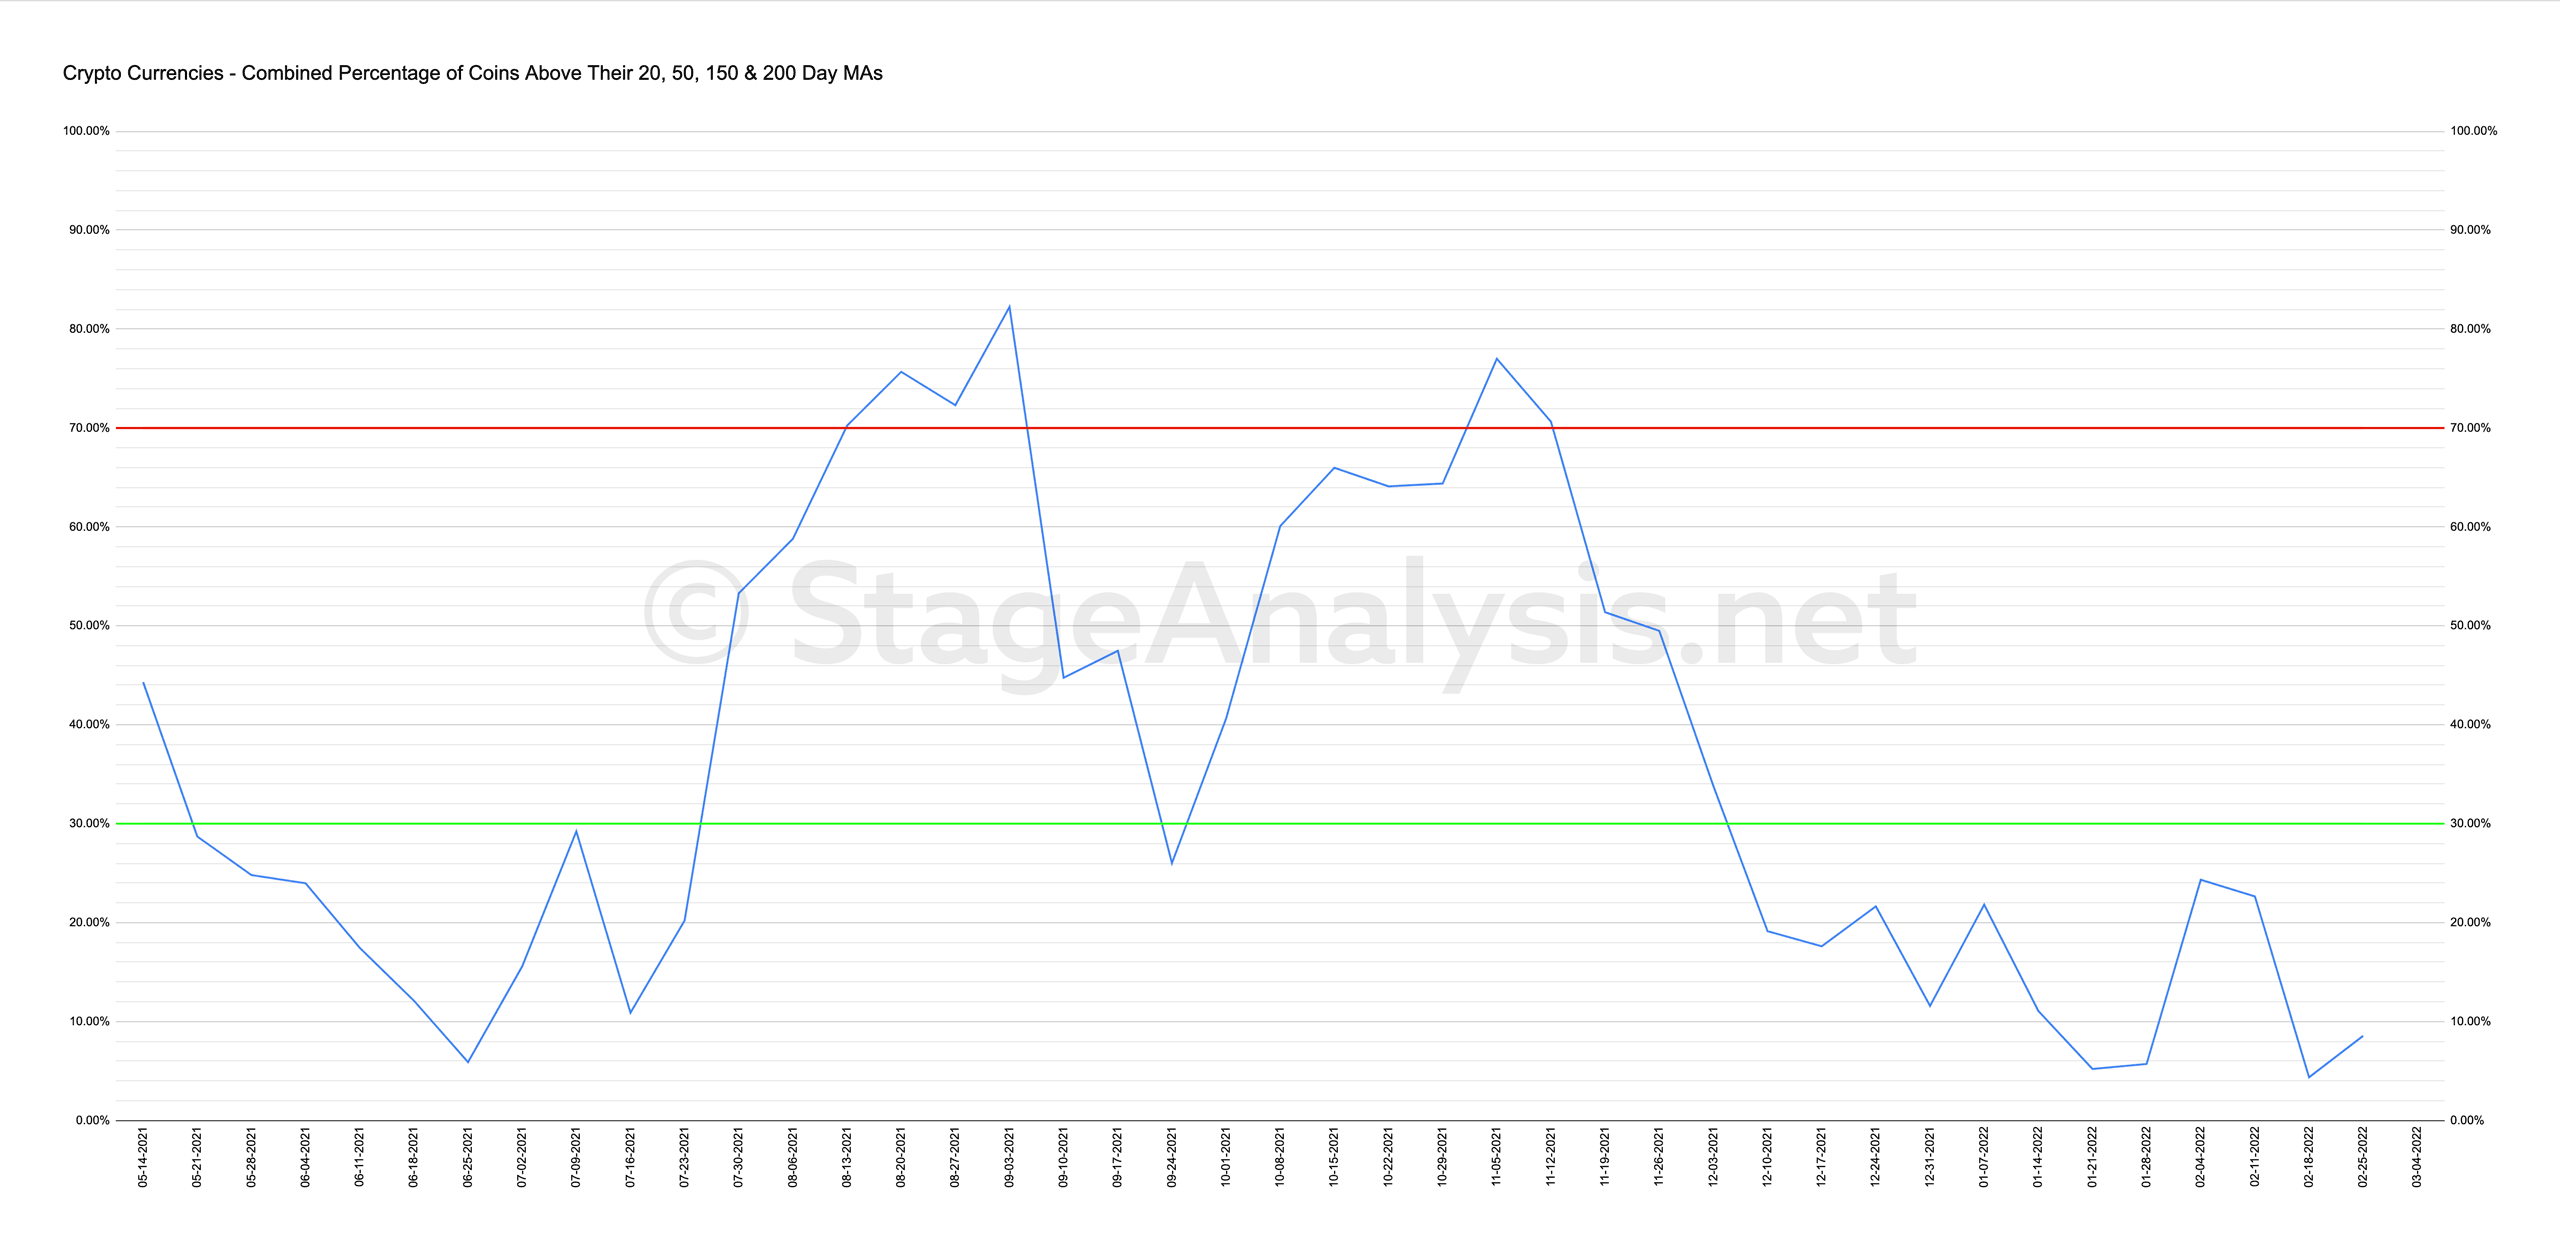
Percentage of Crypto Currencies above their Moving Averages breadth charts
The overall average remains at extremely low levels, closing the week at 8.56%. In order to move to crypto breadth buy signal, the overall average needs to move out of the lower zone and close above the key 30% level.
Read More
27 February, 2022
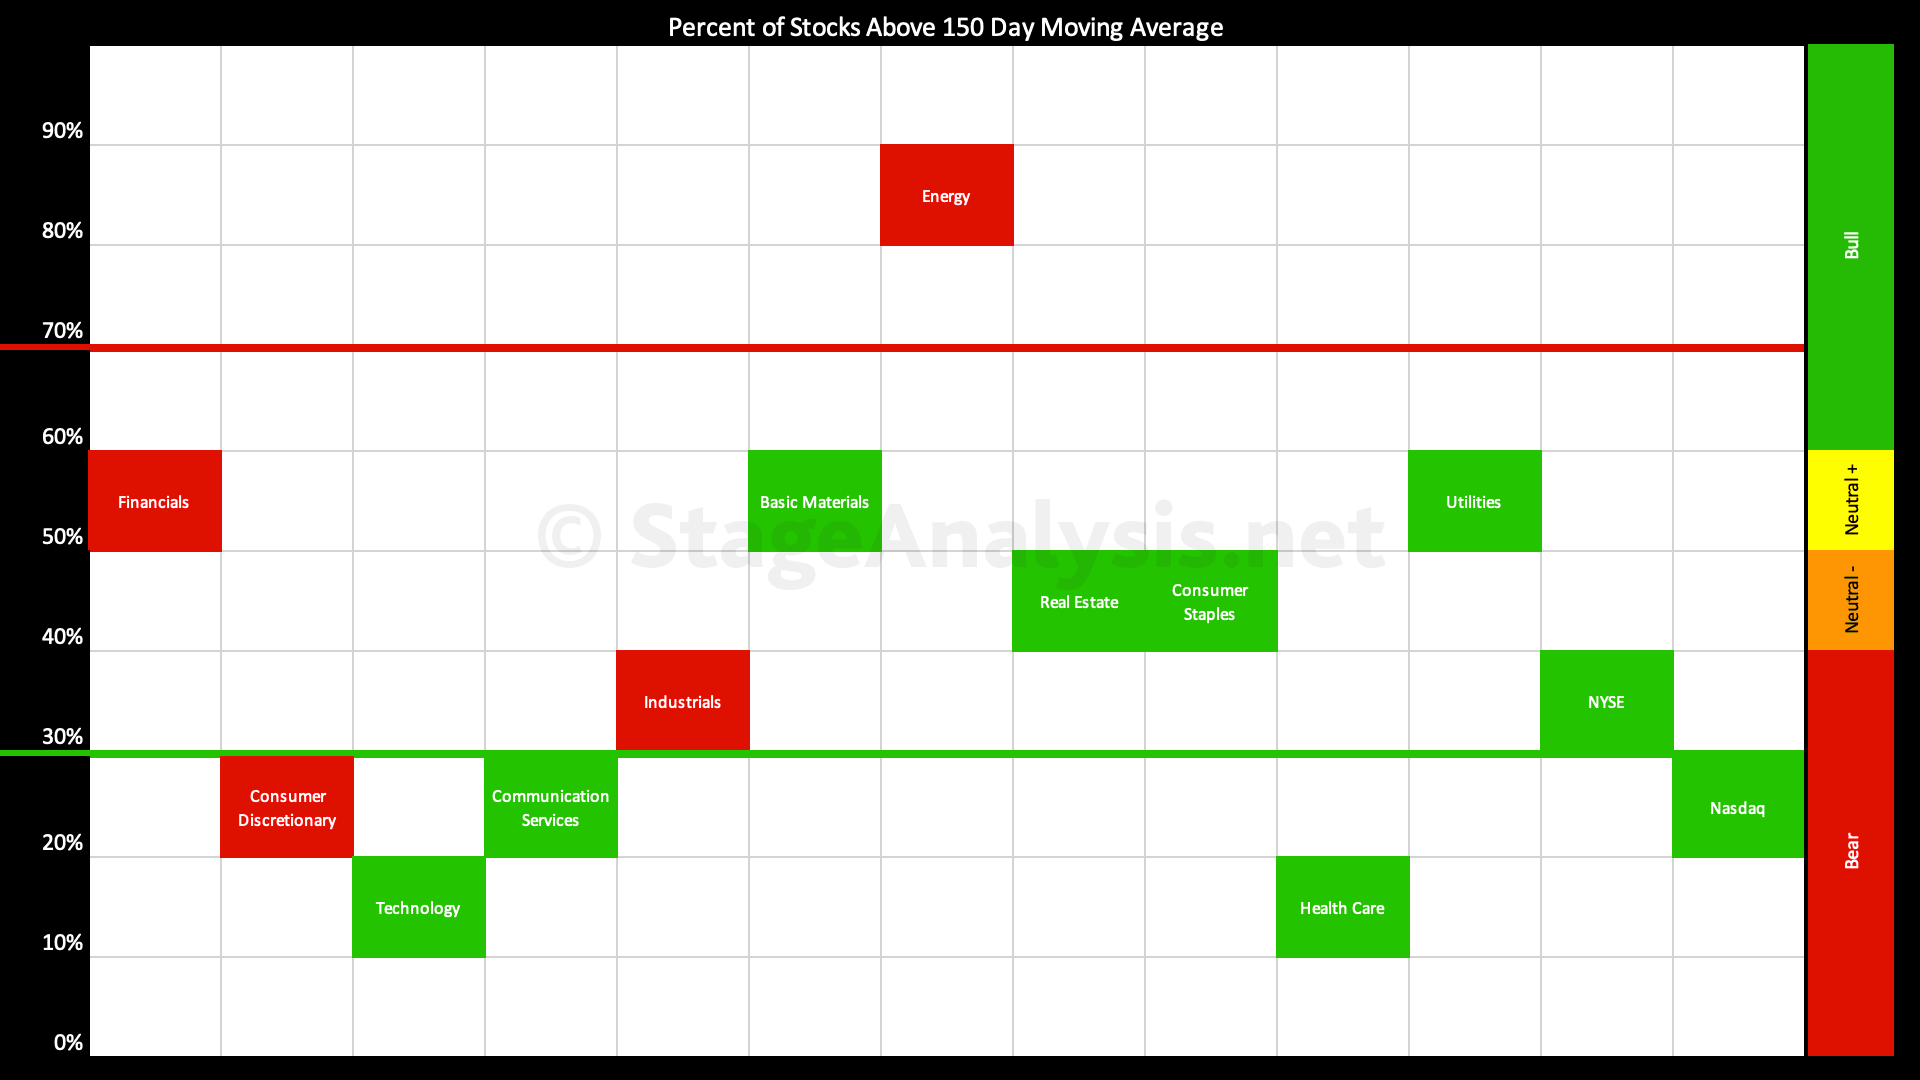
Market Breadth Update - 27 February 2022
Overview the key market breadth charts that we follow in order to determine the Weight of Evidence, which guides our strategy and risk management.
Read More
26 February, 2022
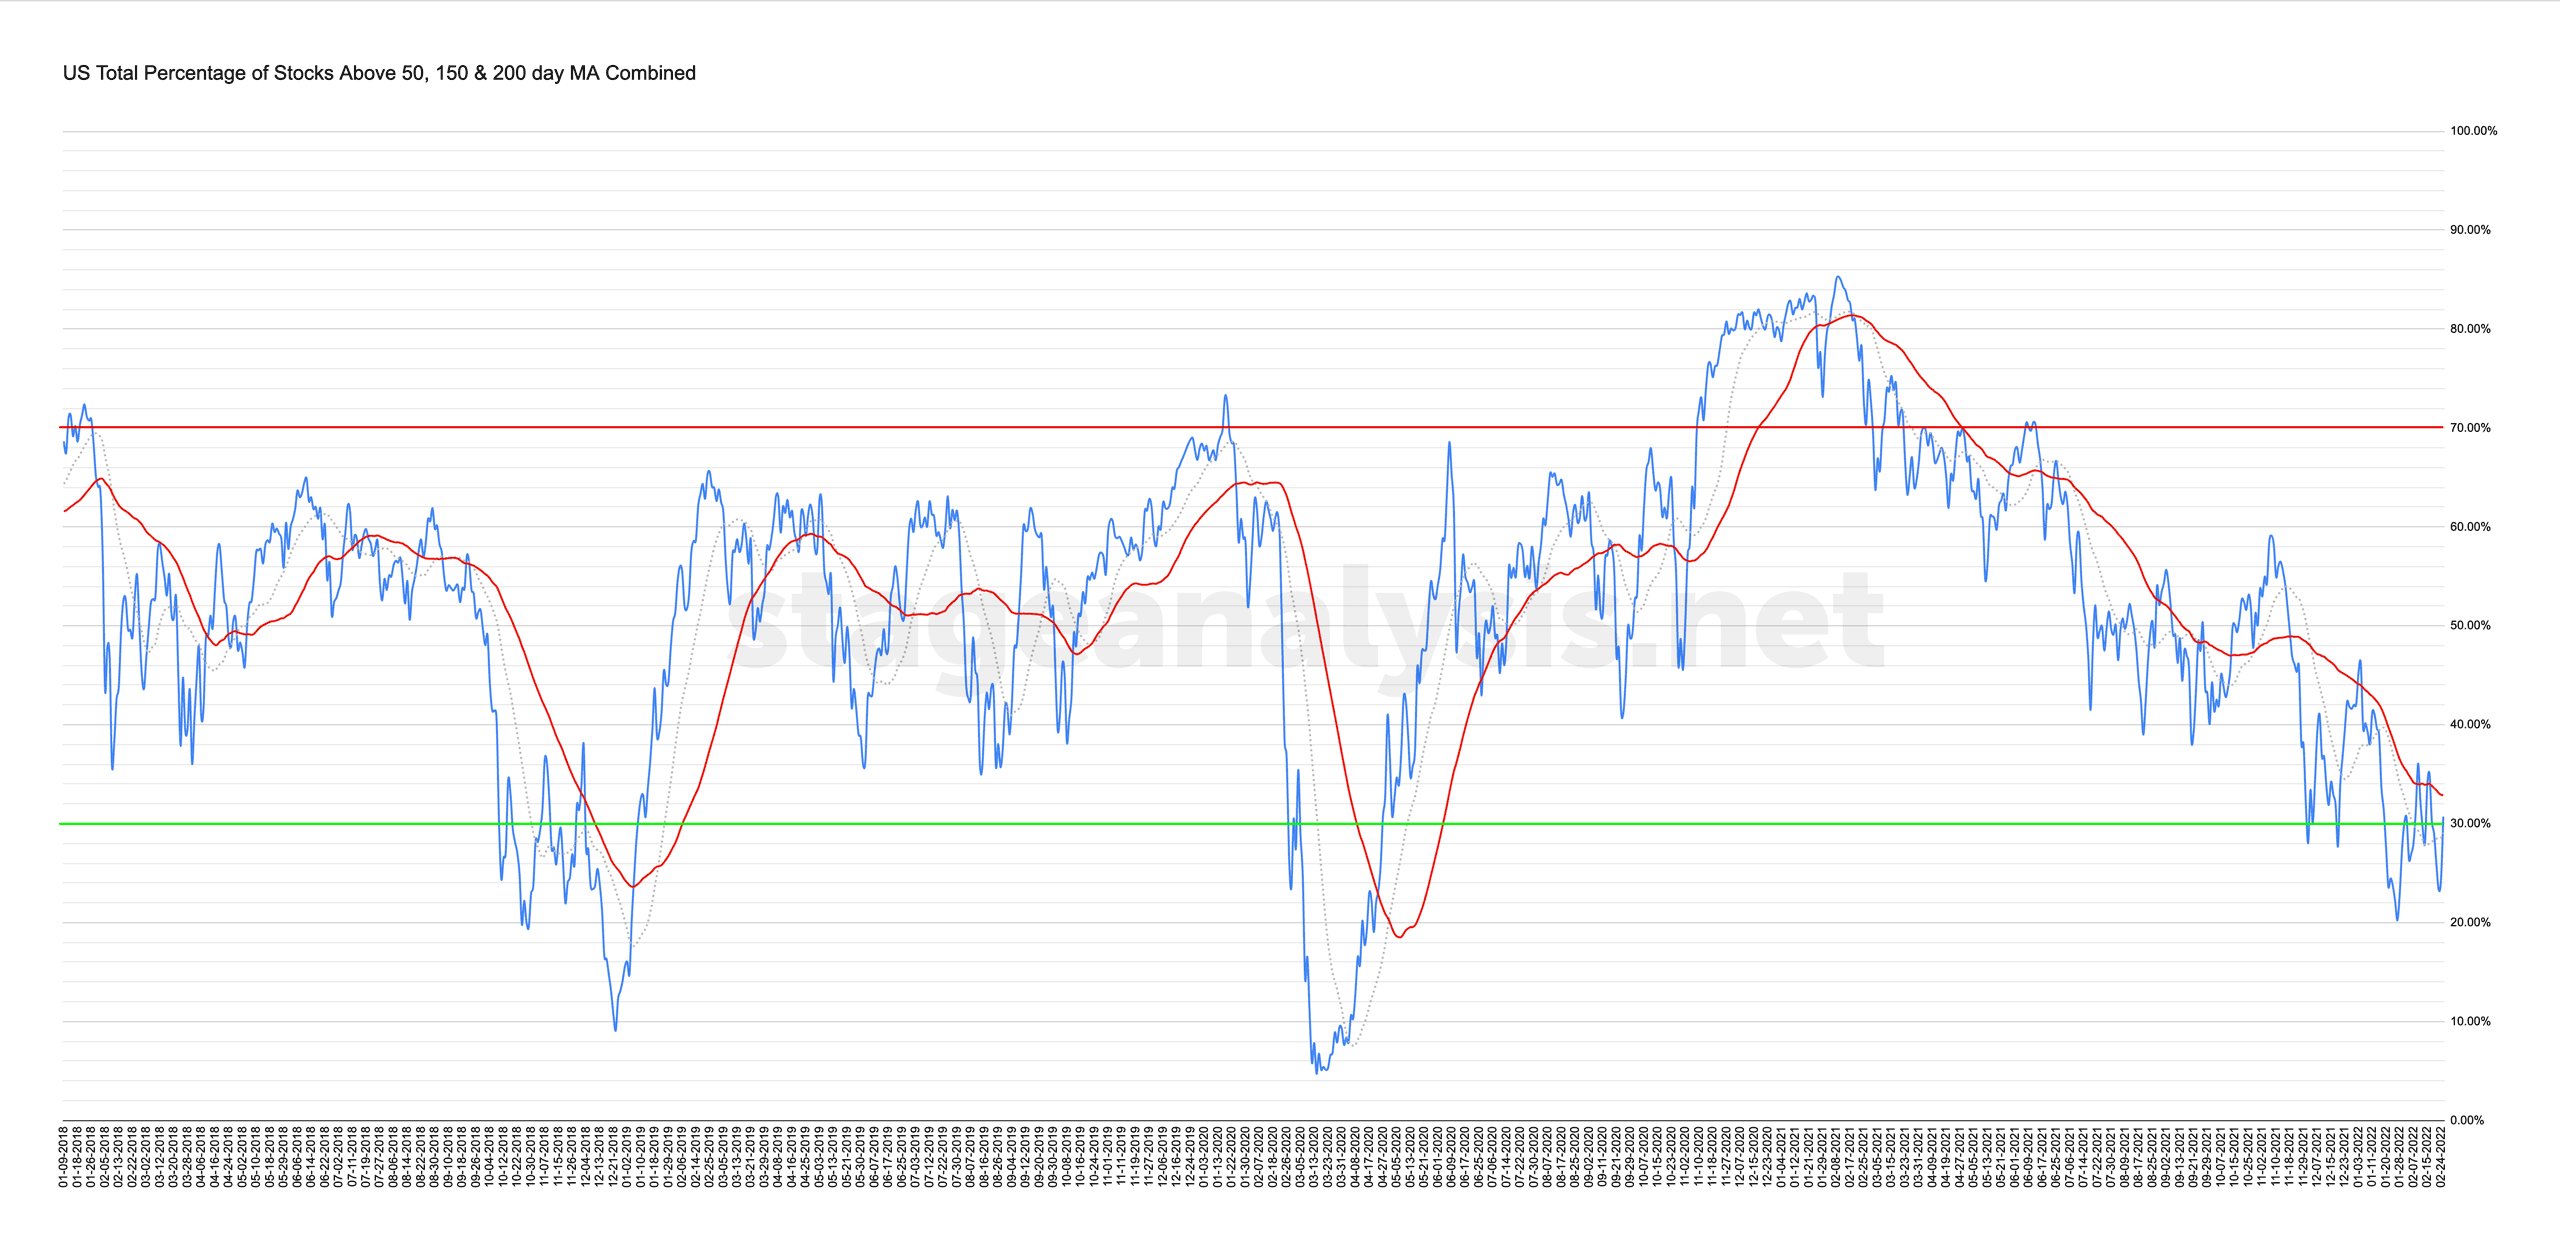
Percentage of Stocks Above their 50 Day, 150 Day & 200 Day Moving Averages Combined
Custom Percentage of Stocks Above Their 50 Day, 150 Day & 200 Day Moving Averages Combined Market Breadth Charts for the Overall US Market, NYSE and Nasdaq for Market Timing and Strategy.
Read More
24 February, 2022
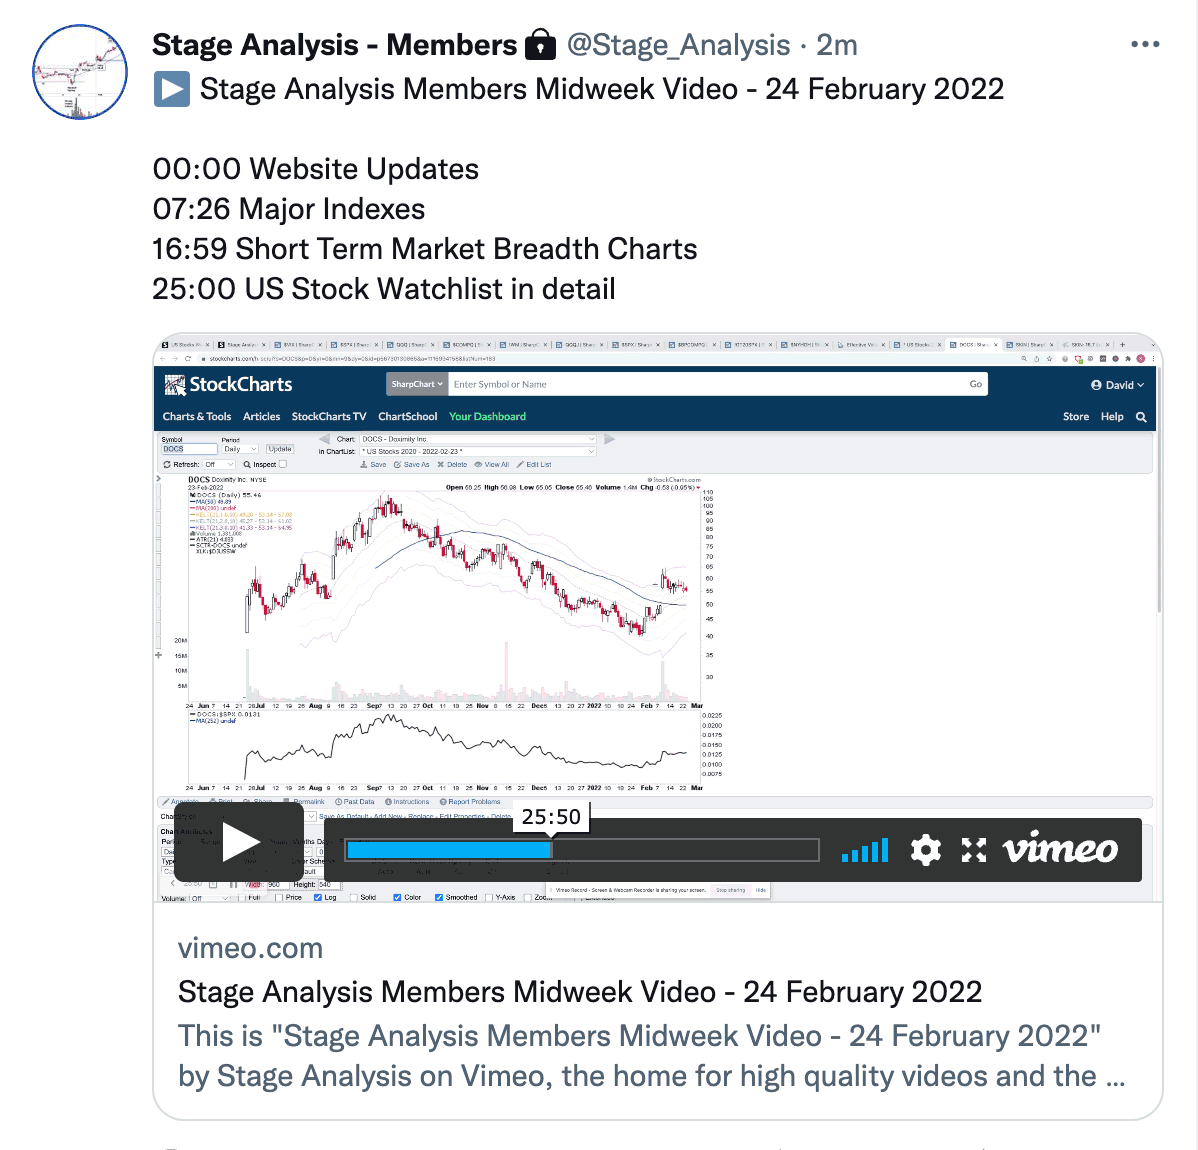
Stage Analysis Members Midweek Video - 24 February 2022 (59 mins)
Stage Analysis Members Midweek Video of the Major Indexes, Short Term Market Breadth Charts and a detailed look at the US Stock Watchlist from today.
Read More
22 February, 2022
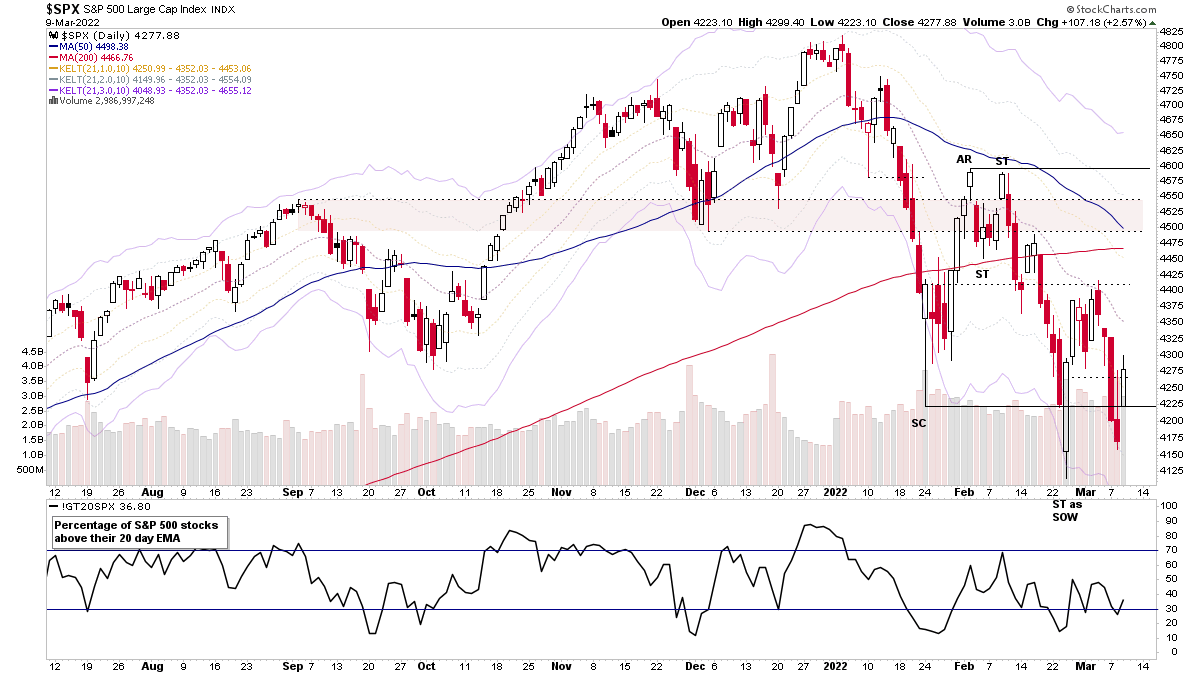
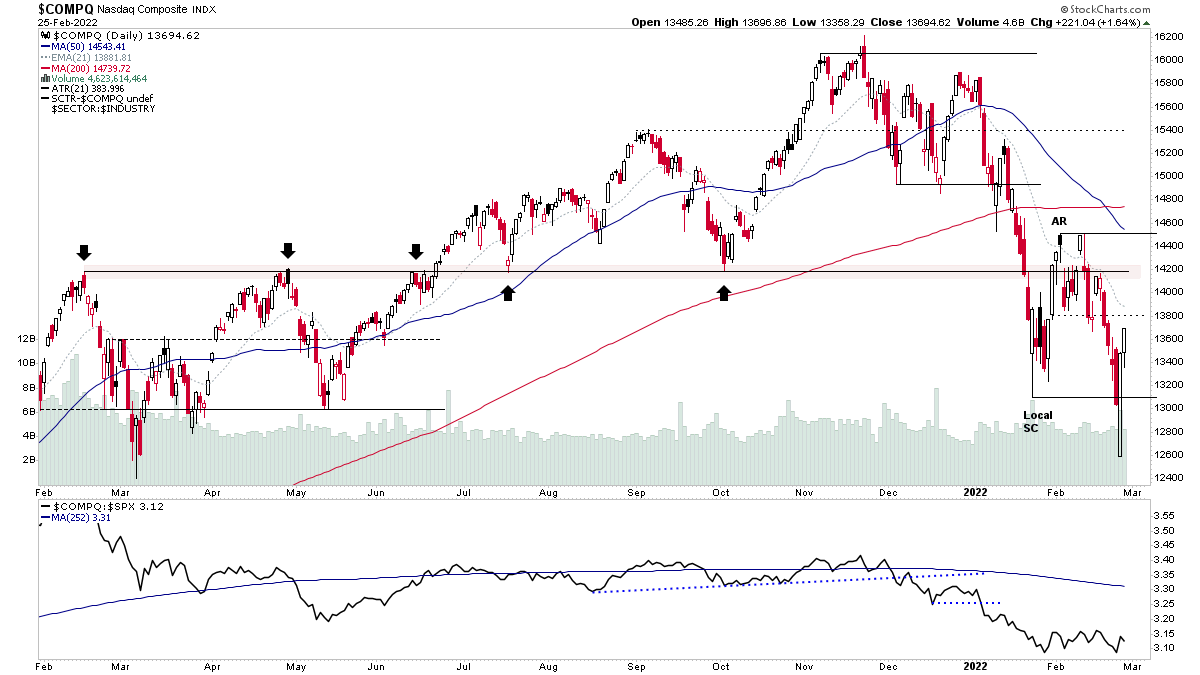
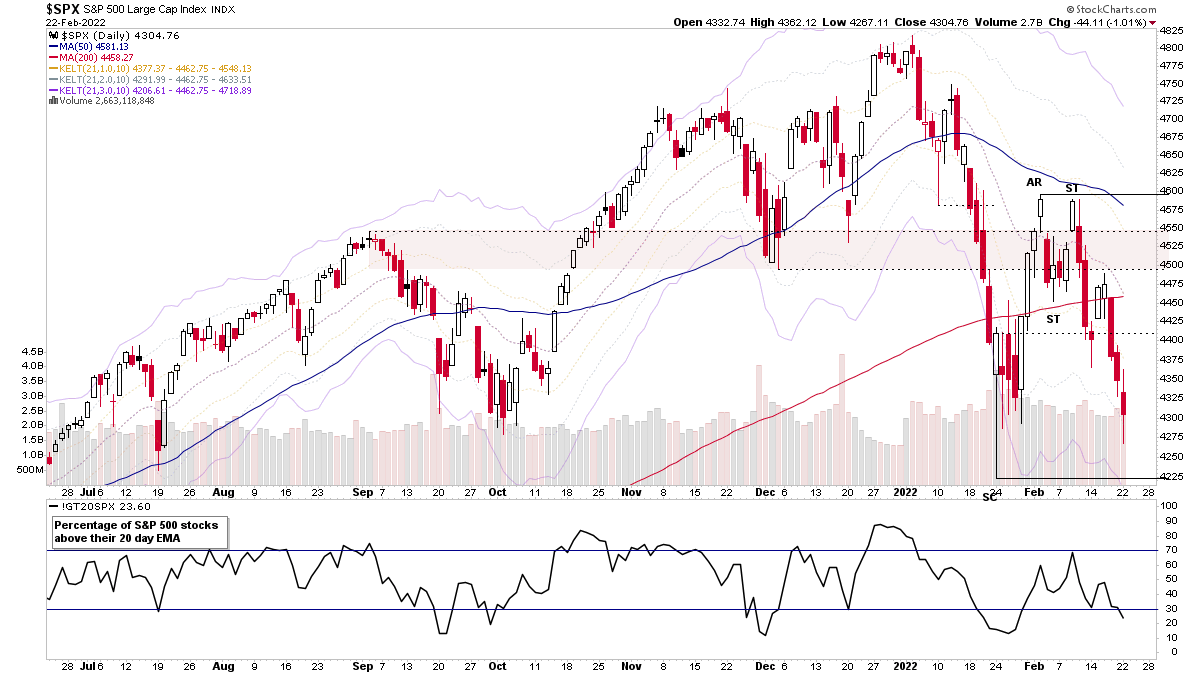
US Stocks Watchlist - 22 February 2022
The S&P 500 and Nasdaq 100 both pushed down towards their recent lows that were put in on the 24th January on the local Selling Climax (SC) and are currently making a potential Secondary Test (ST) of that low. So how well defended it is will give further clues to the market condition. i.e. do they form a higher low and push back higher in their Stage 3 ranges, or do they undercut and rebound, but form a Sign of Weakness (SOW), or breakdown completely and move into a major Stage 4 decline.
Read More