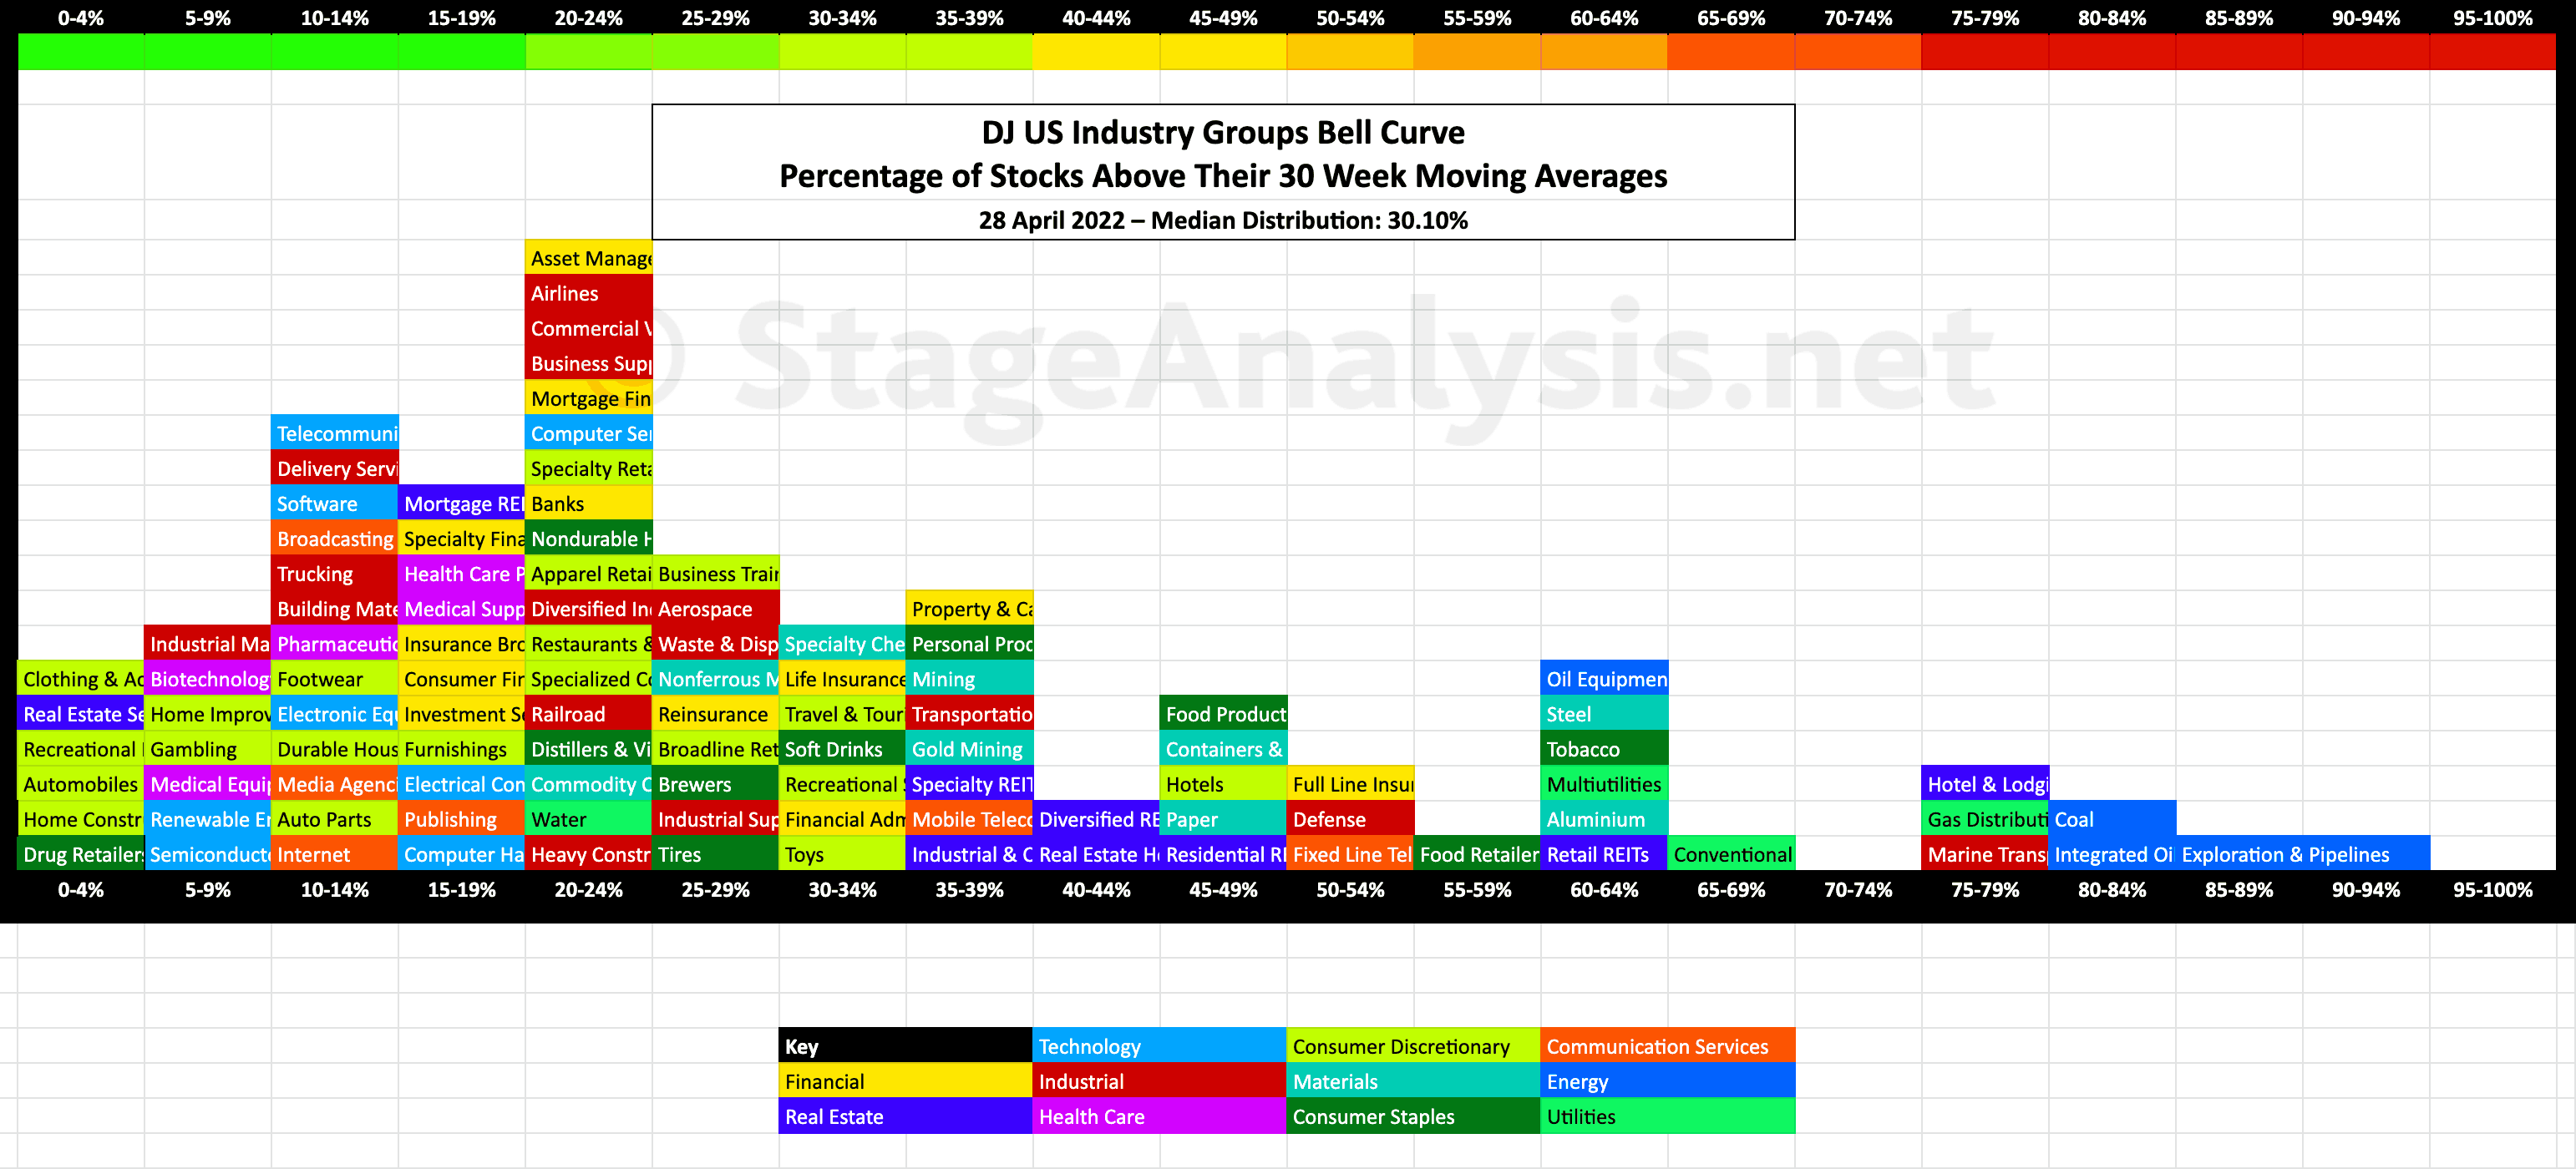
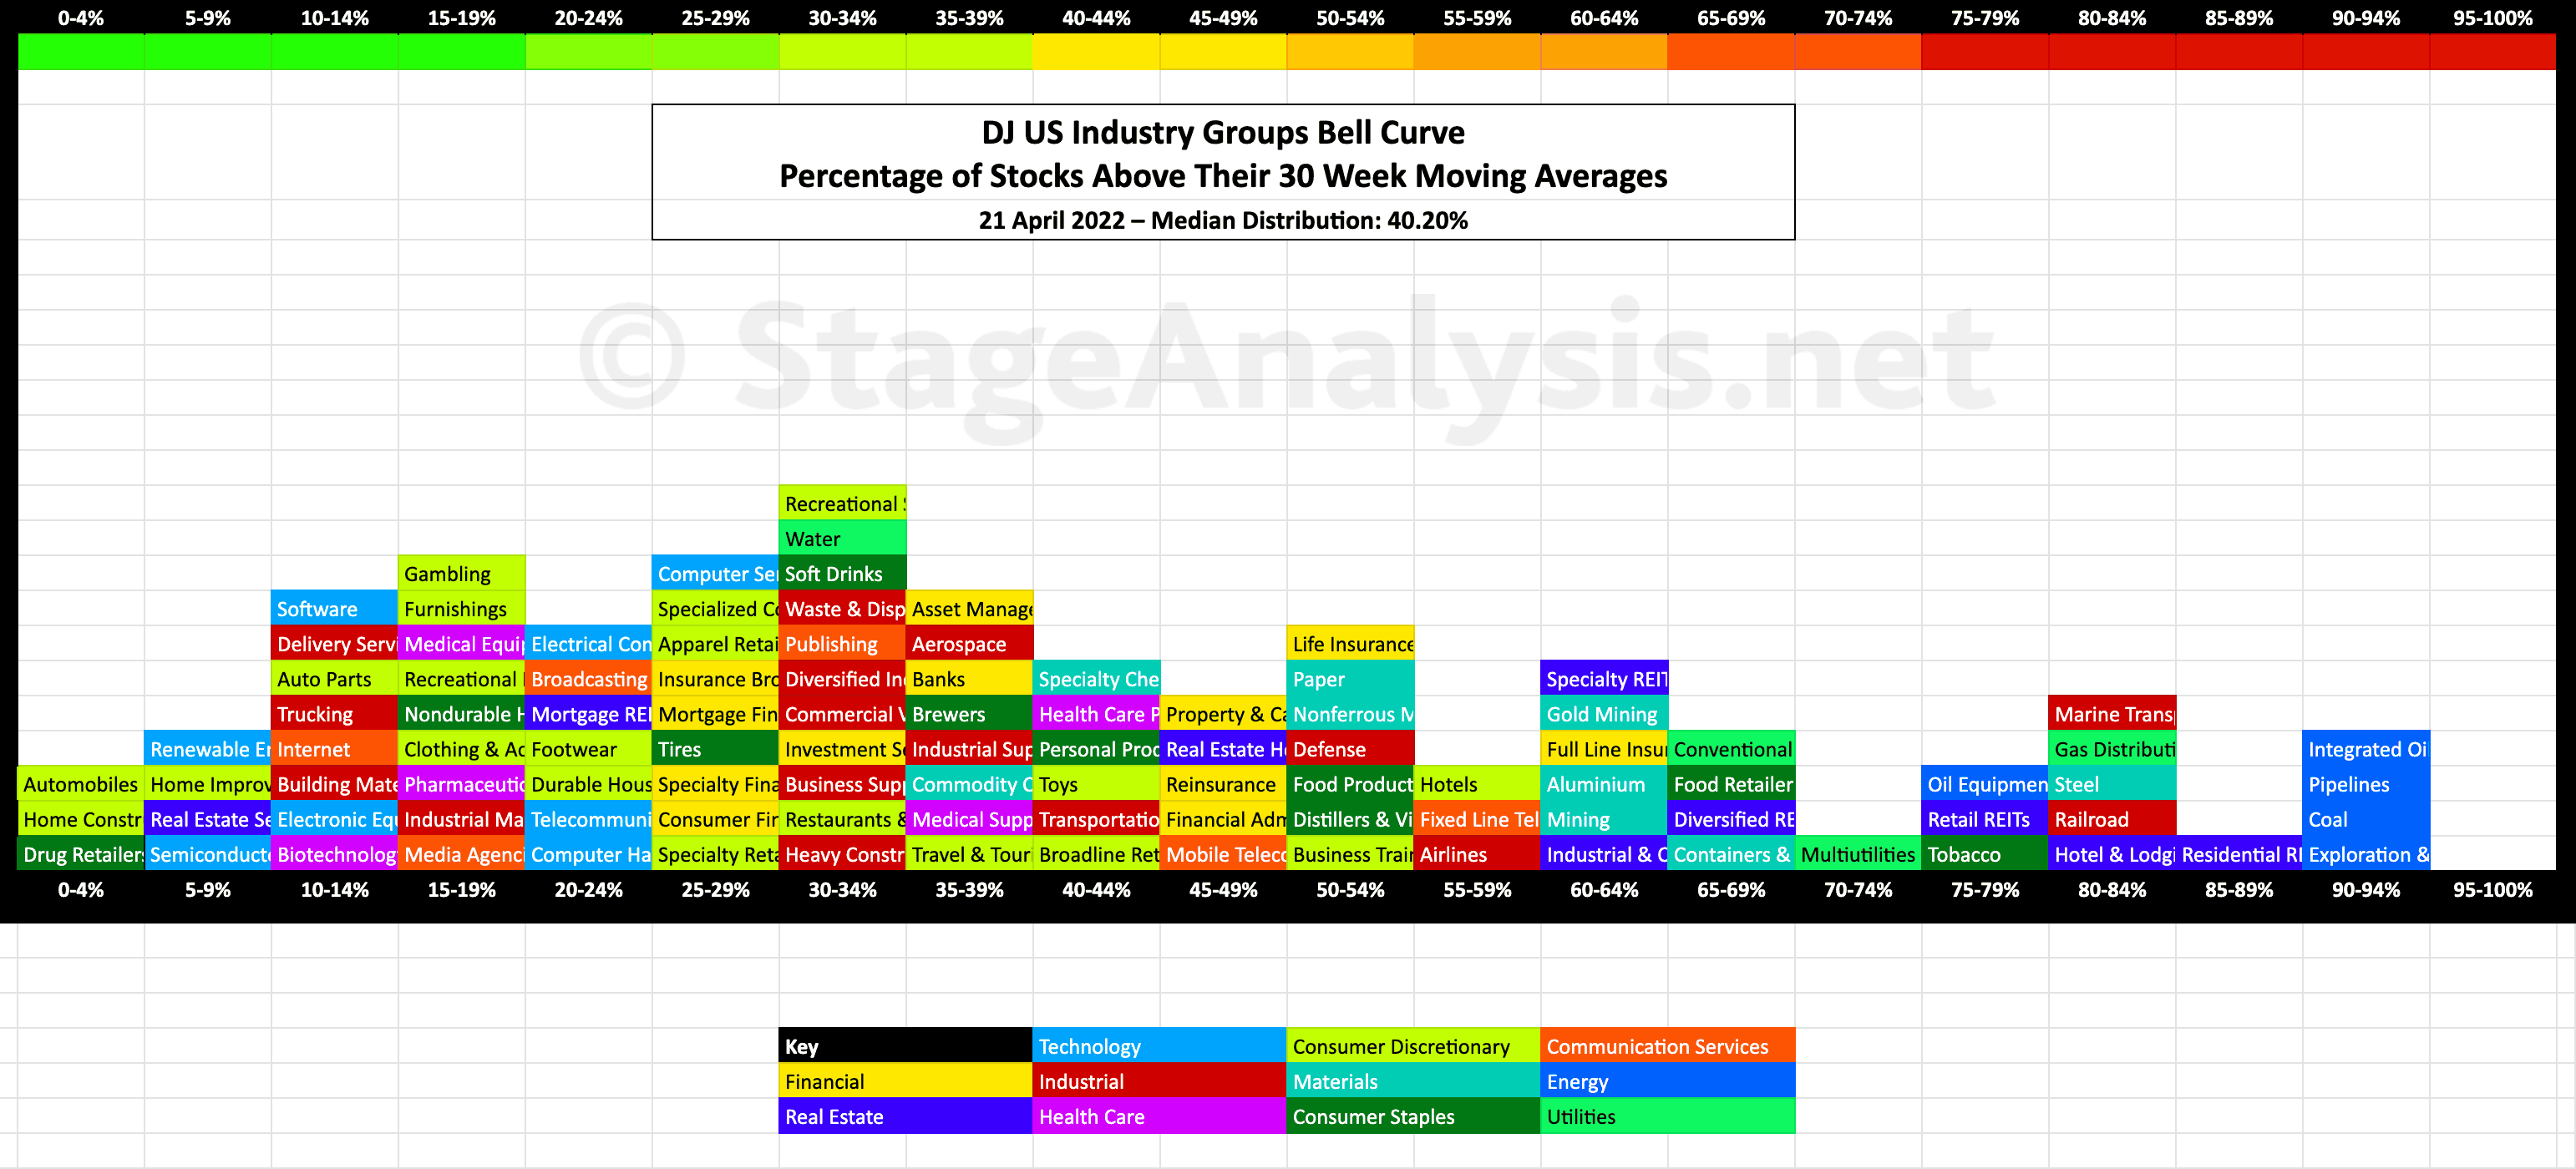
Exclusive graphic of the 104 Dow Jones Industry Groups showing the Percentage of Stocks Above 30 week MA in each group visualised as a Bell Curve chart – inspired by the Sector Bell Curve work by Tom Dorsey in his Point & Figure book....
Read More
Blog
28 April, 2022
US Industry Groups Bell Curve – Exclusive to Stage Analysis
27 April, 2022
Stage Analysis Members Midweek Video – 27 April 2022 (1hr 2mins)
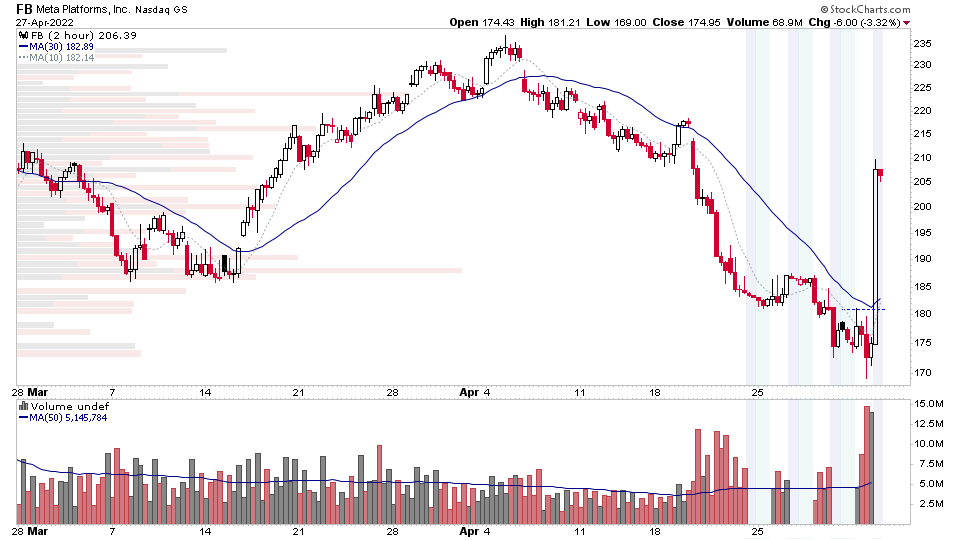
Stage Analysis Members Midweek Video with a FREE preview reviewing the charts of the mega caps earnings reactions and the upcoming earnings in the next few days. Followed by the members only content talking first about the Q2 Weak Spot in the Four Year Presidential Election Cycle, and Major Indexes, short term Market Breadth charts. Plus a look at the Wyckoff Distribution Schematics with some potential examples from current charts showing weak structures and price and volume action. And to finish a few watchlist stocks.
Read More
26 April, 2022
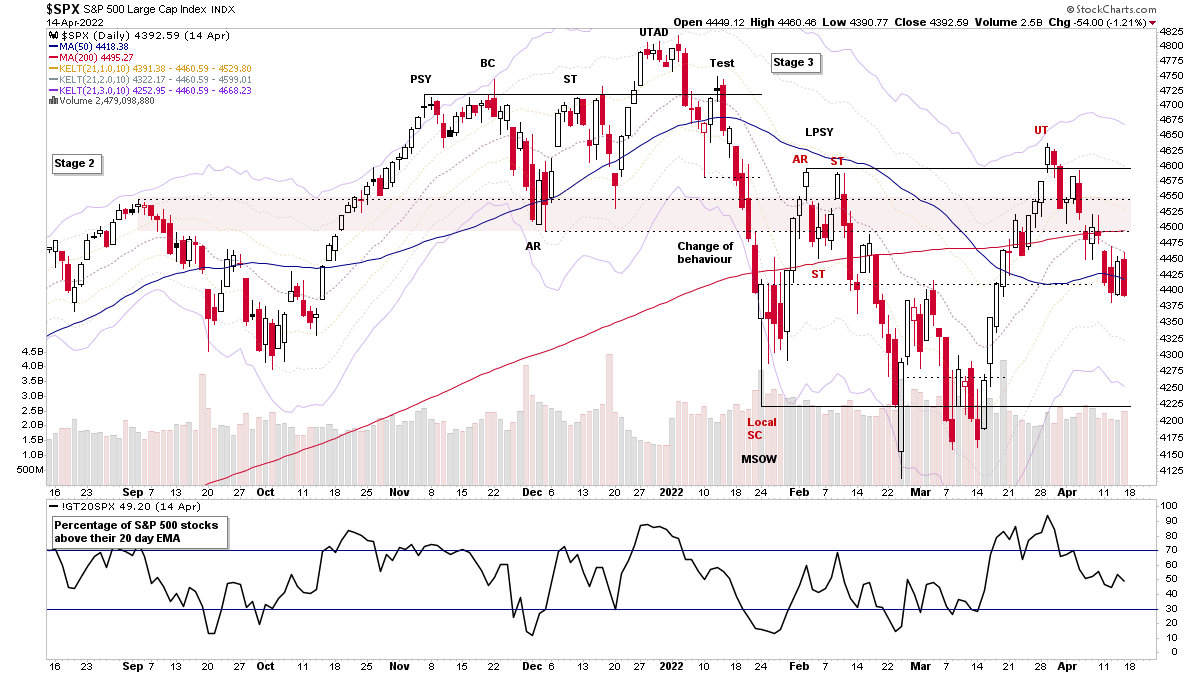
US Major Stock Market Indexes Reach Pivotal Points as Mega Cap Stocks Begin Reporting Earnings
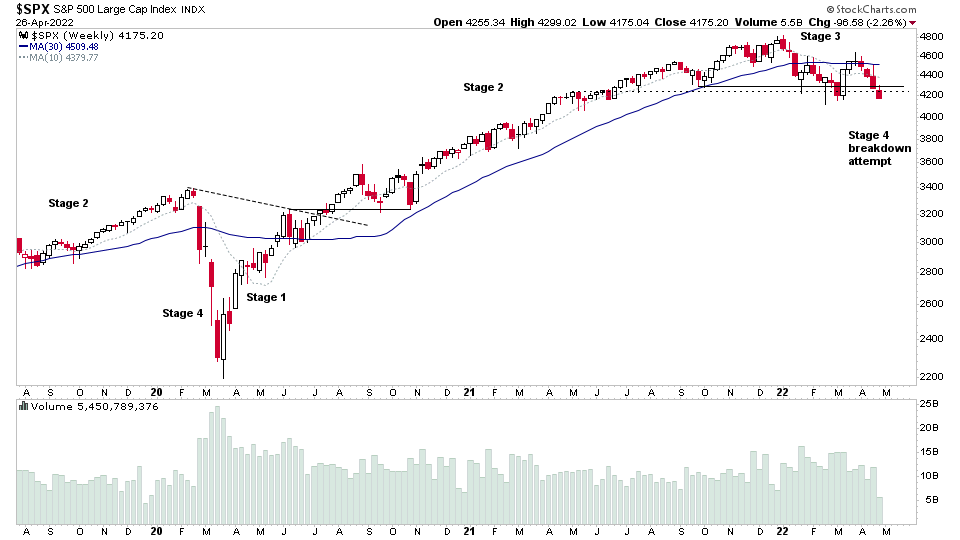
The major indexes – S&P 500, Nasdaq Composite, NYSE, Russell 2000 and the FAANG stocks index – are all at pivotal points, with weakest already in Stage 4 declines. But now the stronger areas of the S&P 500 and NYSE are also testing their own Stage 4 breakdown levels...
Read More
24 April, 2022
Stage Analysis Members Weekend Video - 24 April 2022 (1hr 30mins)
This weekends Stage Analysis Members Video features analysis of the Major US Stock Market Indexes – S&P 500, Nasdaq Composite, Russell 2000 and the individual US Market Sectors Stages. Plus the a detailed look at the US Industry Groups Relative Strength focusing on the Change of Behaviour in the strongest RS groups...
Read More
23 April, 2022
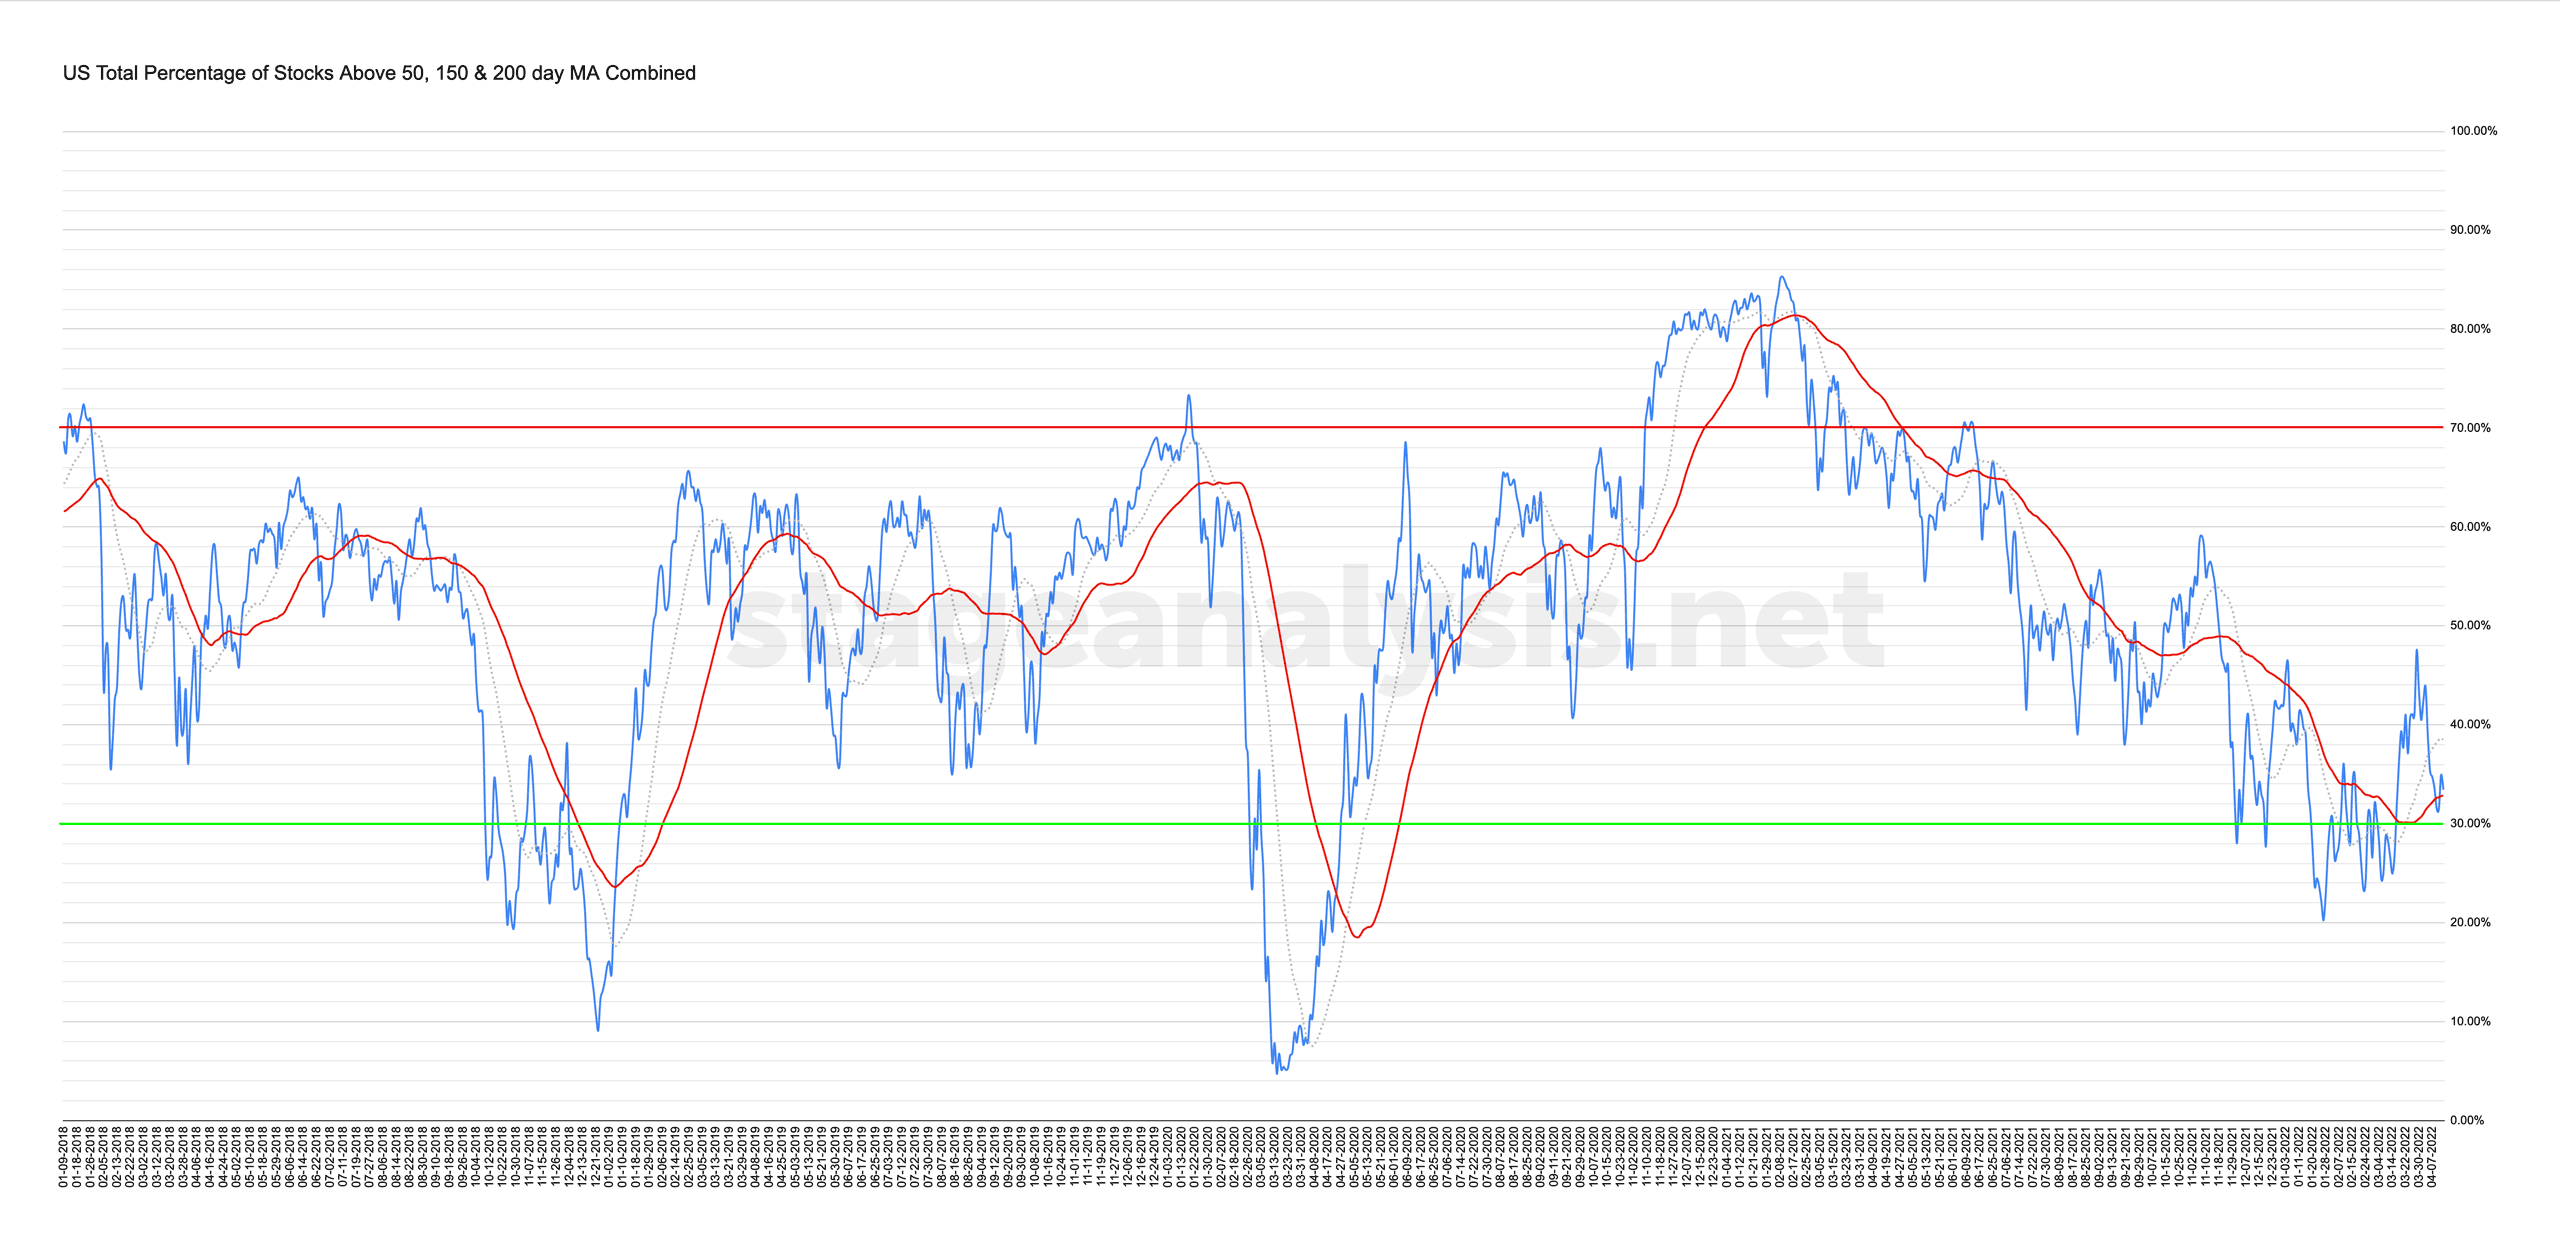
Market Breadth: Percentage of Stocks Above their 50 Day, 150 Day & 200 Day Moving Averages Combined
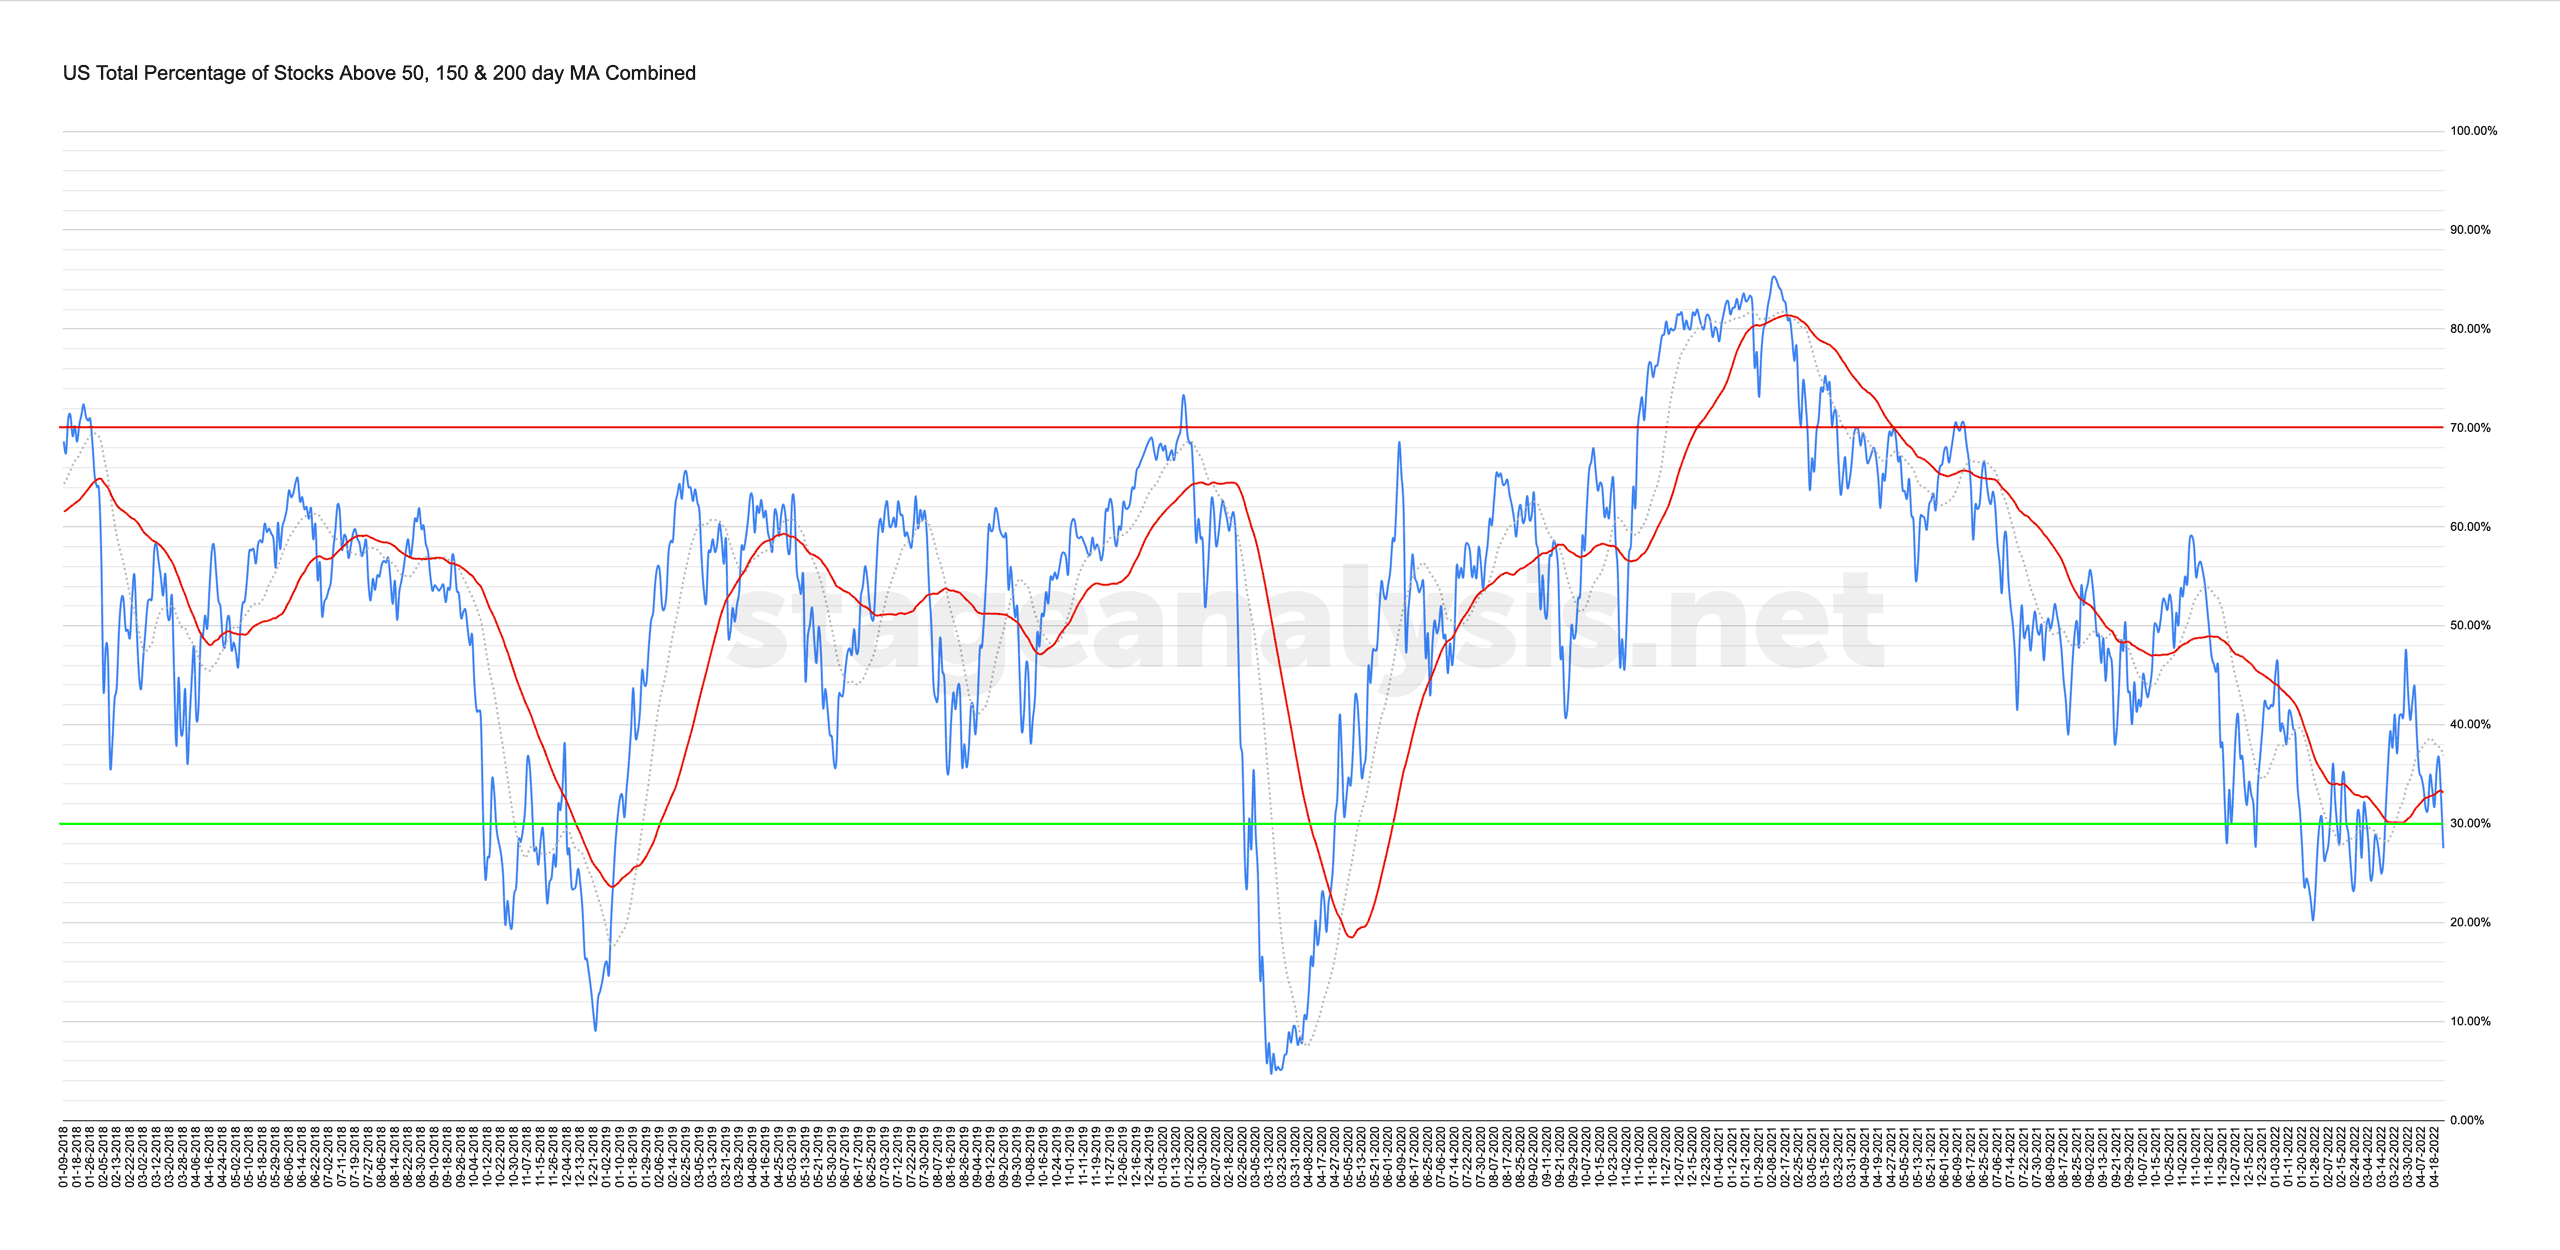
Custom Percentage of Stocks Above Their 50 Day, 150 Day & 200 Day Moving Averages Combined Market Breadth Charts for the Overall US Market, NYSE and Nasdaq for Market Timing and Strategy.
Read More
21 April, 2022
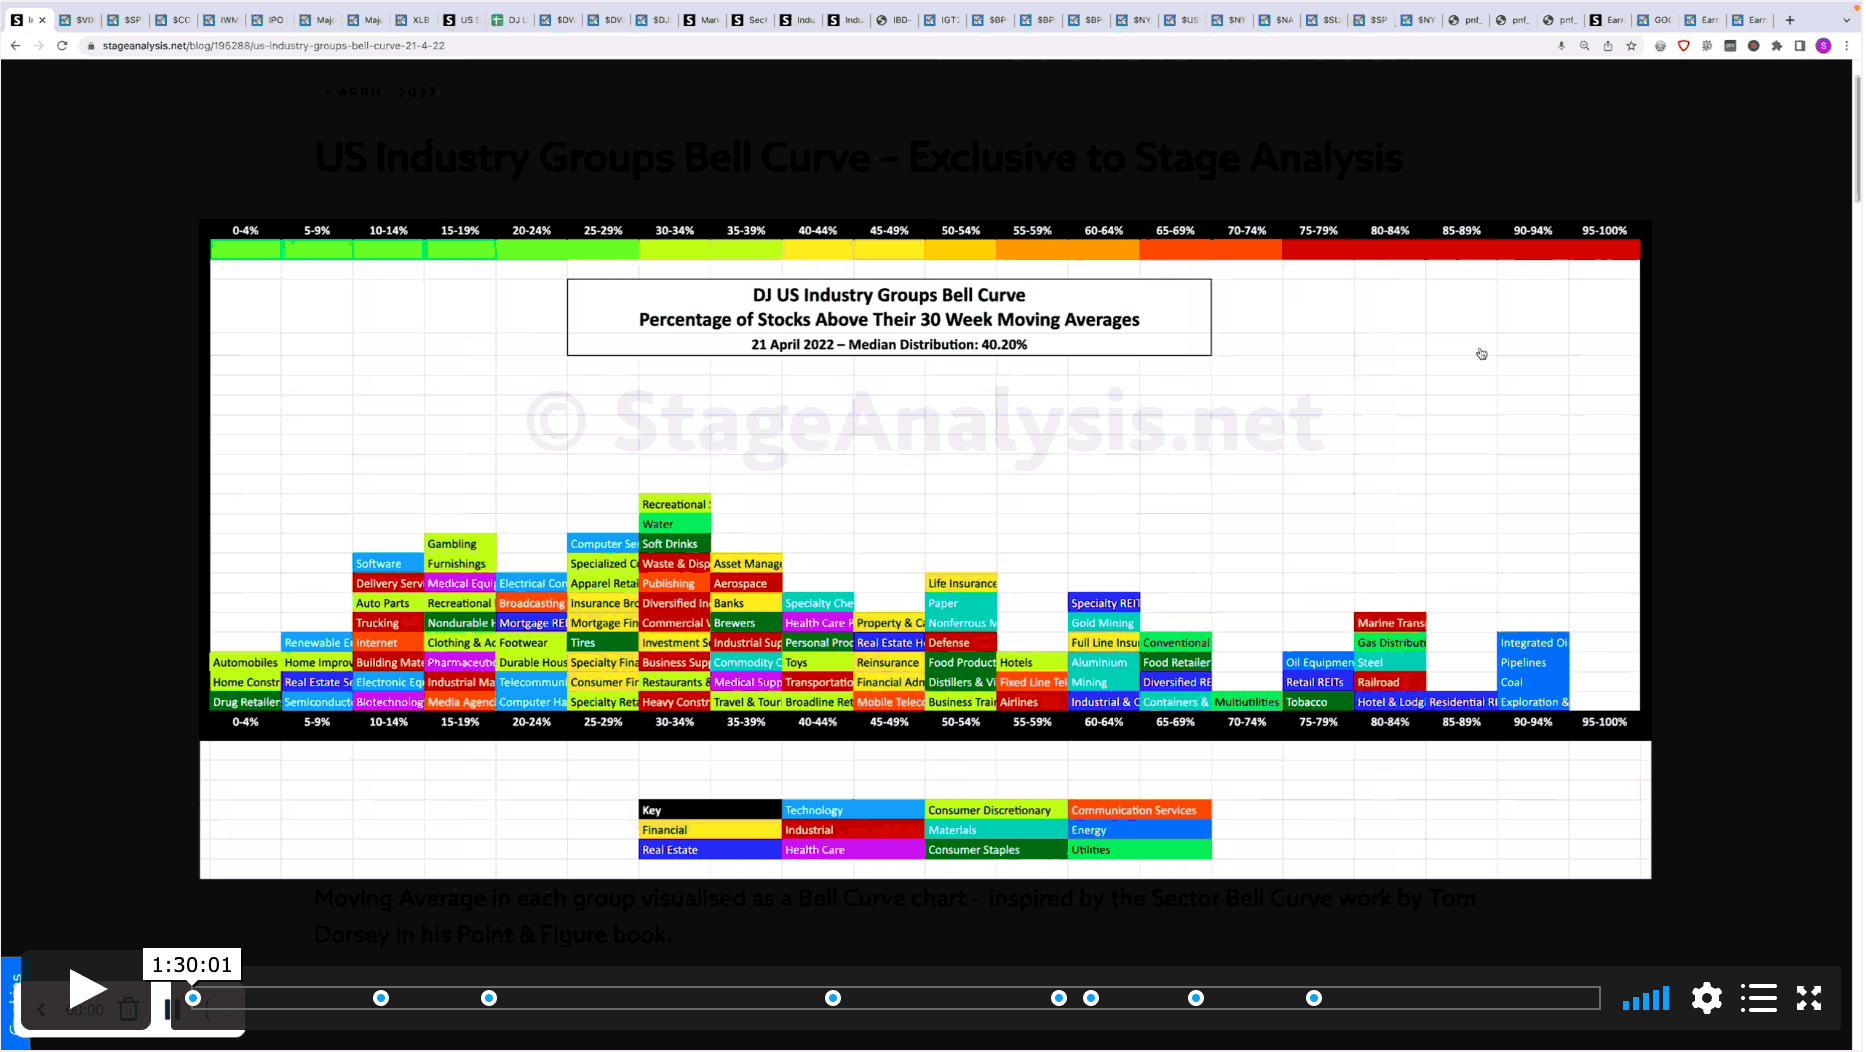
US Industry Groups Bell Curve – Exclusive to Stage Analysis
Exclusive graphic of the 104 Dow Jones Industry Groups showing the Percentage of Stocks Above 30 week MA in each group visualised as a Bell Curve chart – inspired by the Sector Bell Curve work by Tom Dorsey in his Point & Figure book....
Read More
21 April, 2022
Stage Analysis Members Midweek Video - 20 April 2022 (56 mins)
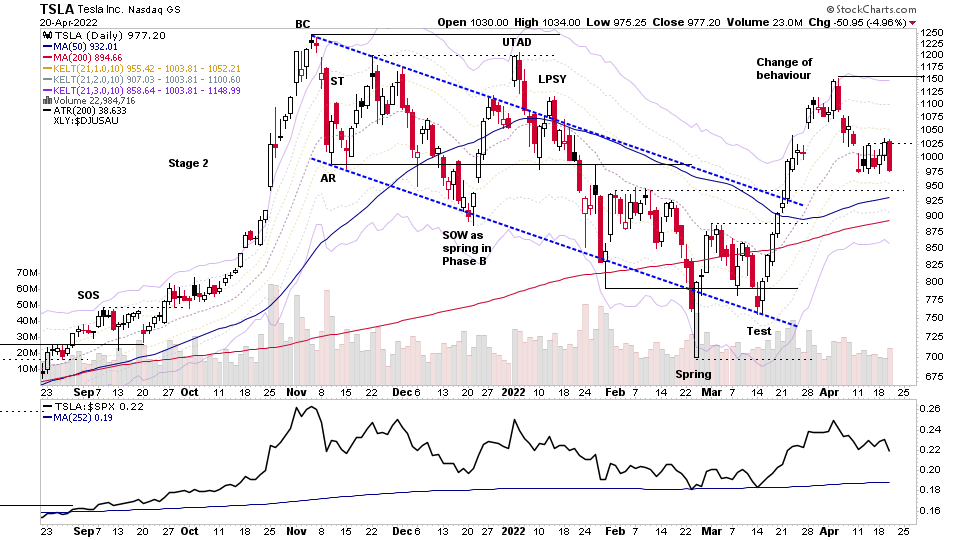
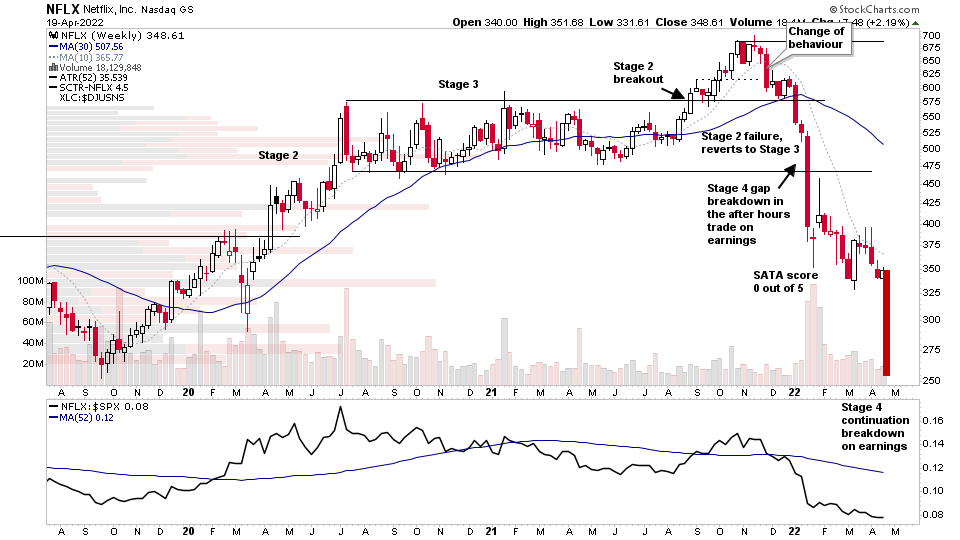
Stage Analysis Members Midweek Video with a FREE preview covering the Stage 4 continuation breakdown in NFLX Netflix, and then members only content going through the Major Indexes, Short Term Market Breadth Charts, todays after hours moves from earnings in TSLA and UAL. The Uranium group attempt to rebound and the US Stocks Watchlist and Group Themes in more detail.
Read More
19 April, 2022
Netflix Stage 4 Continuation Breakdown on Earnings and the US Stocks Watchlist – 19 April 2022
NFLX (Netflix) reacted poorly to it earnings again and made its second large gap down of the year so far. The first of which was on the announcement of the previous earnings. And so it made a Stage 4 continuation breakdown with a massive gap of over -25% in the after hours trade and has now retraced the entire previous Stage 2 advance...
Read More
17 April, 2022
Stage Analysis Members Weekend Video – 17 April 2022 (1hr 14mins)
This weekends Stage Analysis Members Video features analysis of the Major US Stock Market Indexes – S&P 500, Nasdaq Composite, Russell 2000 etc, plus a detailed run through of the key Market Breadth charts (with exclusive charts only on Stage Analysis) in order to determine the Weight of Evidence...
Read More
15 April, 2022
Market Breadth: Percentage of Stocks Above their 50 Day, 150 Day & 200 Day Moving Averages Combined
Custom Percentage of Stocks Above Their 50 Day, 150 Day & 200 Day Moving Averages Combined Market Breadth Charts for the Overall US Market, NYSE and Nasdaq for Market Timing and Strategy.
Read More

