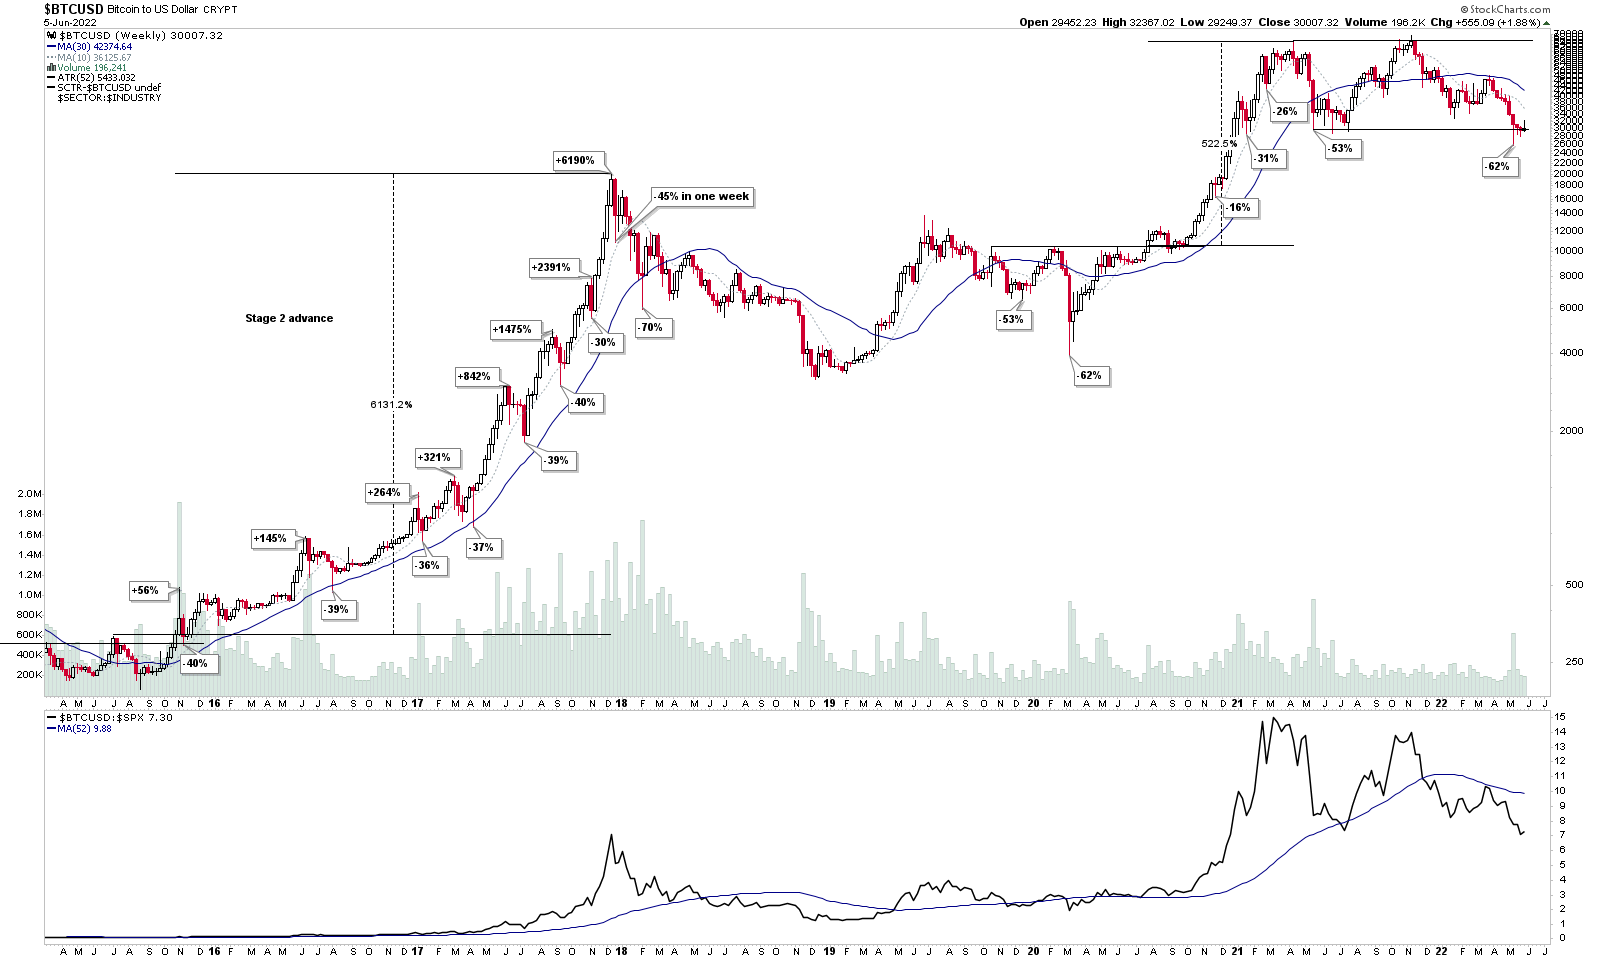
This weekends Stage Analysis Members Video features Stage Analysis of the major crypto coins – Bitcoin and Ethereum on multiple timeframes. And then in the members only portion of the video the usual Forest to the Trees approach...
Read More

Blog
04 June, 2022
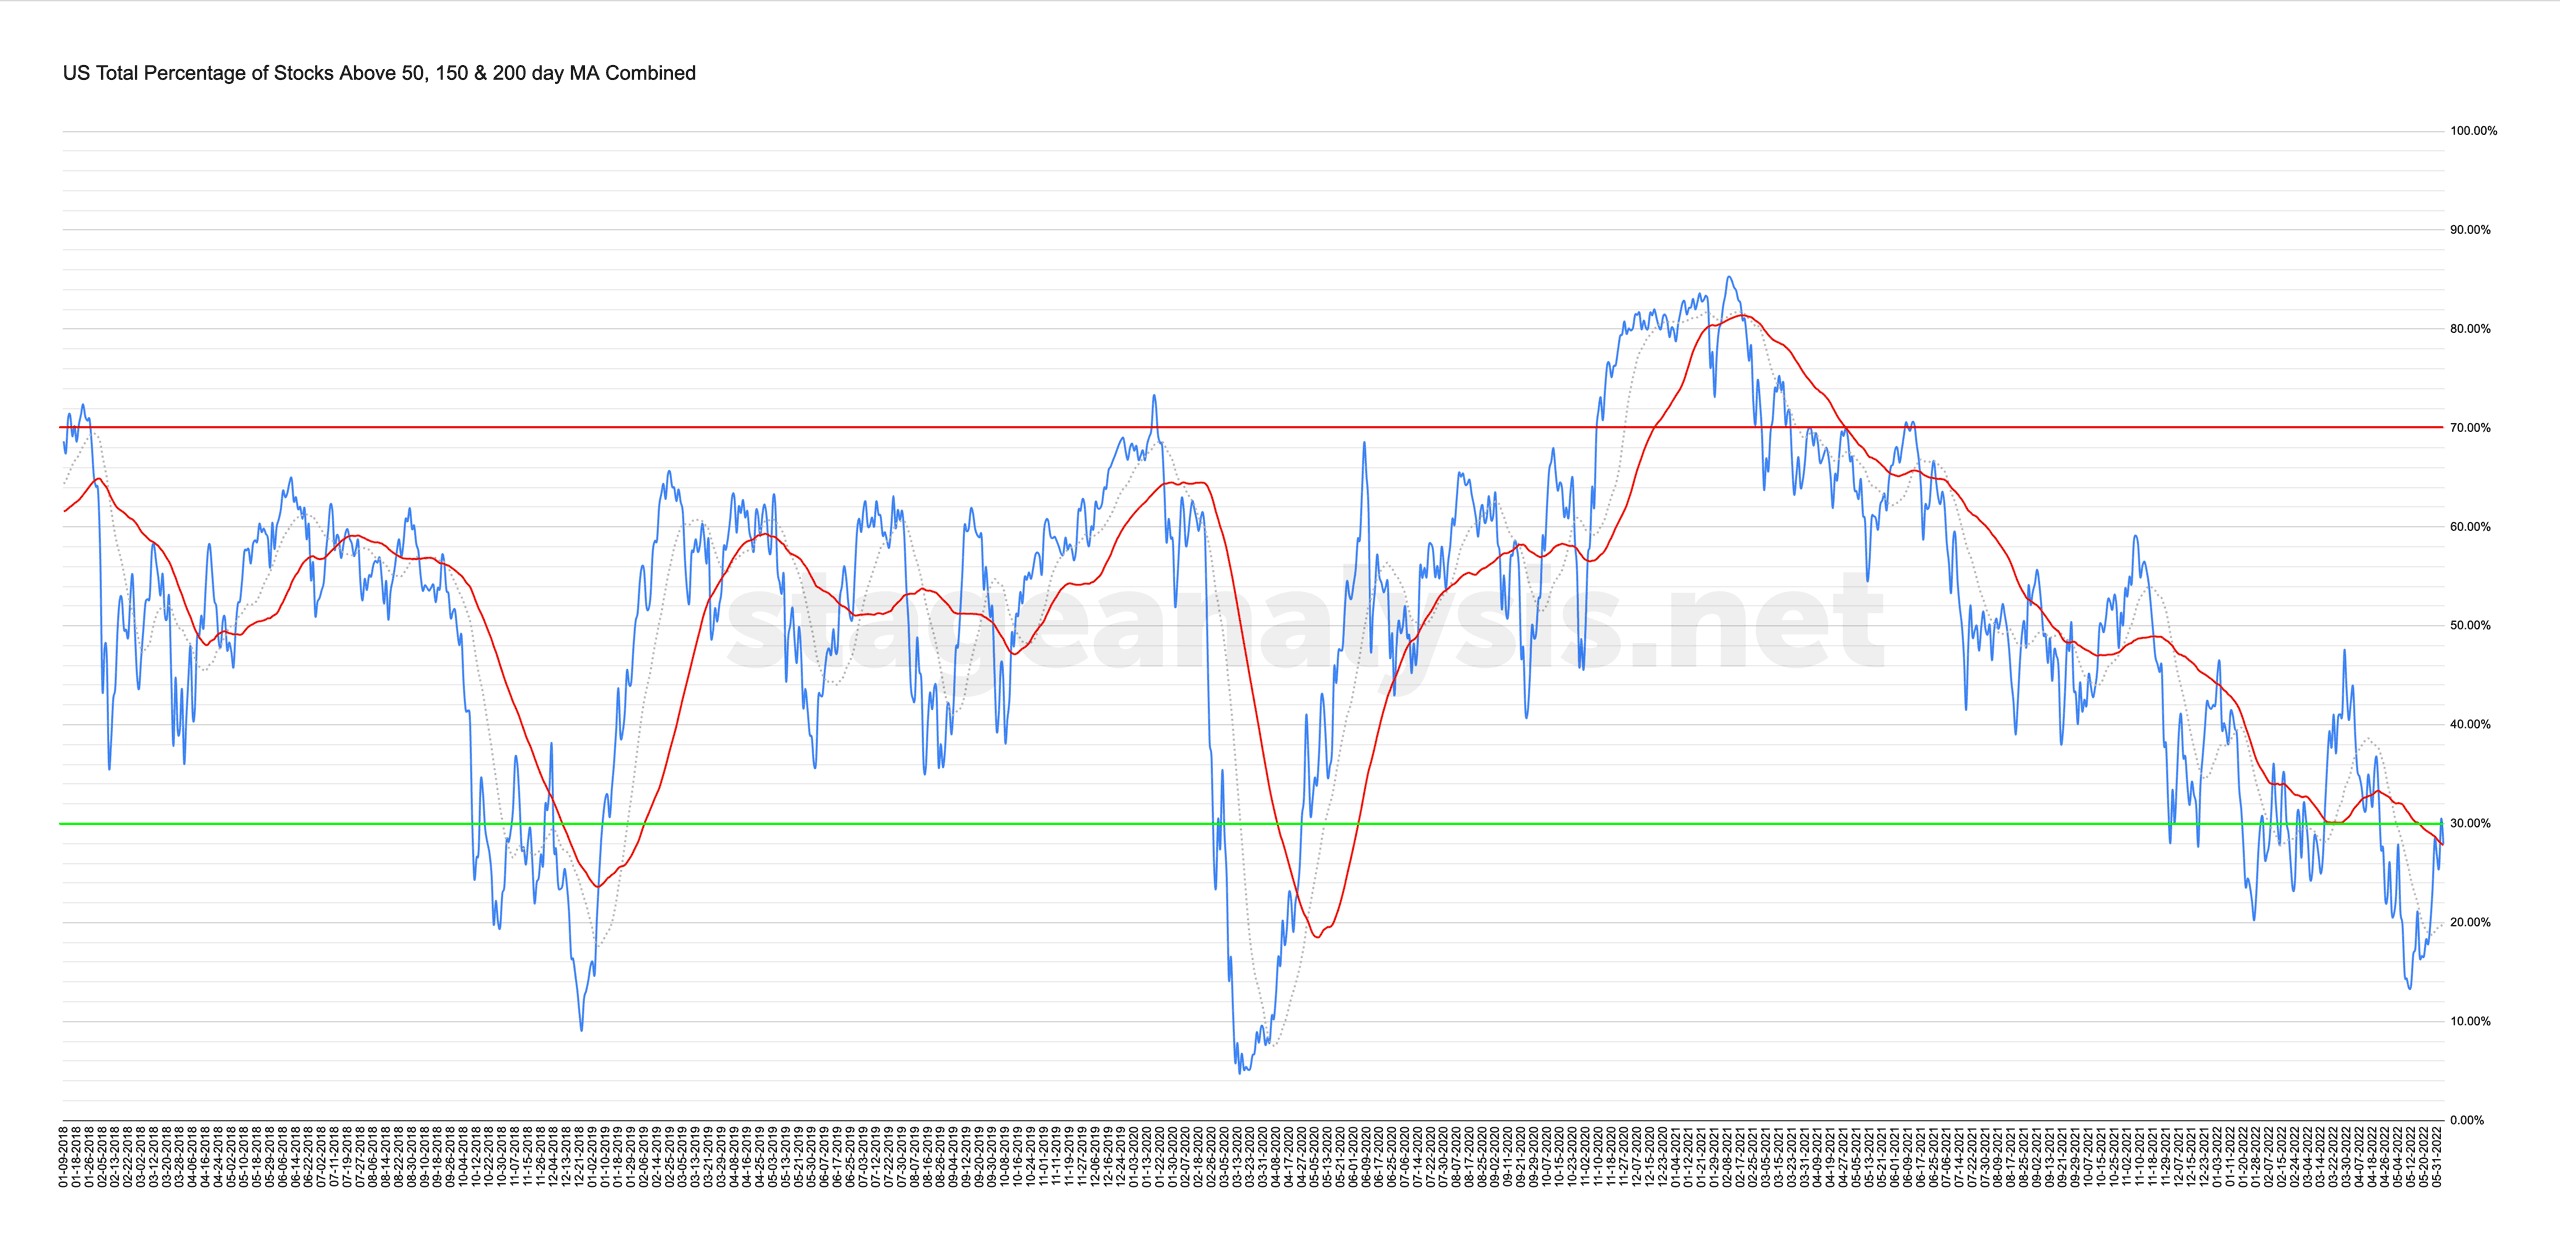
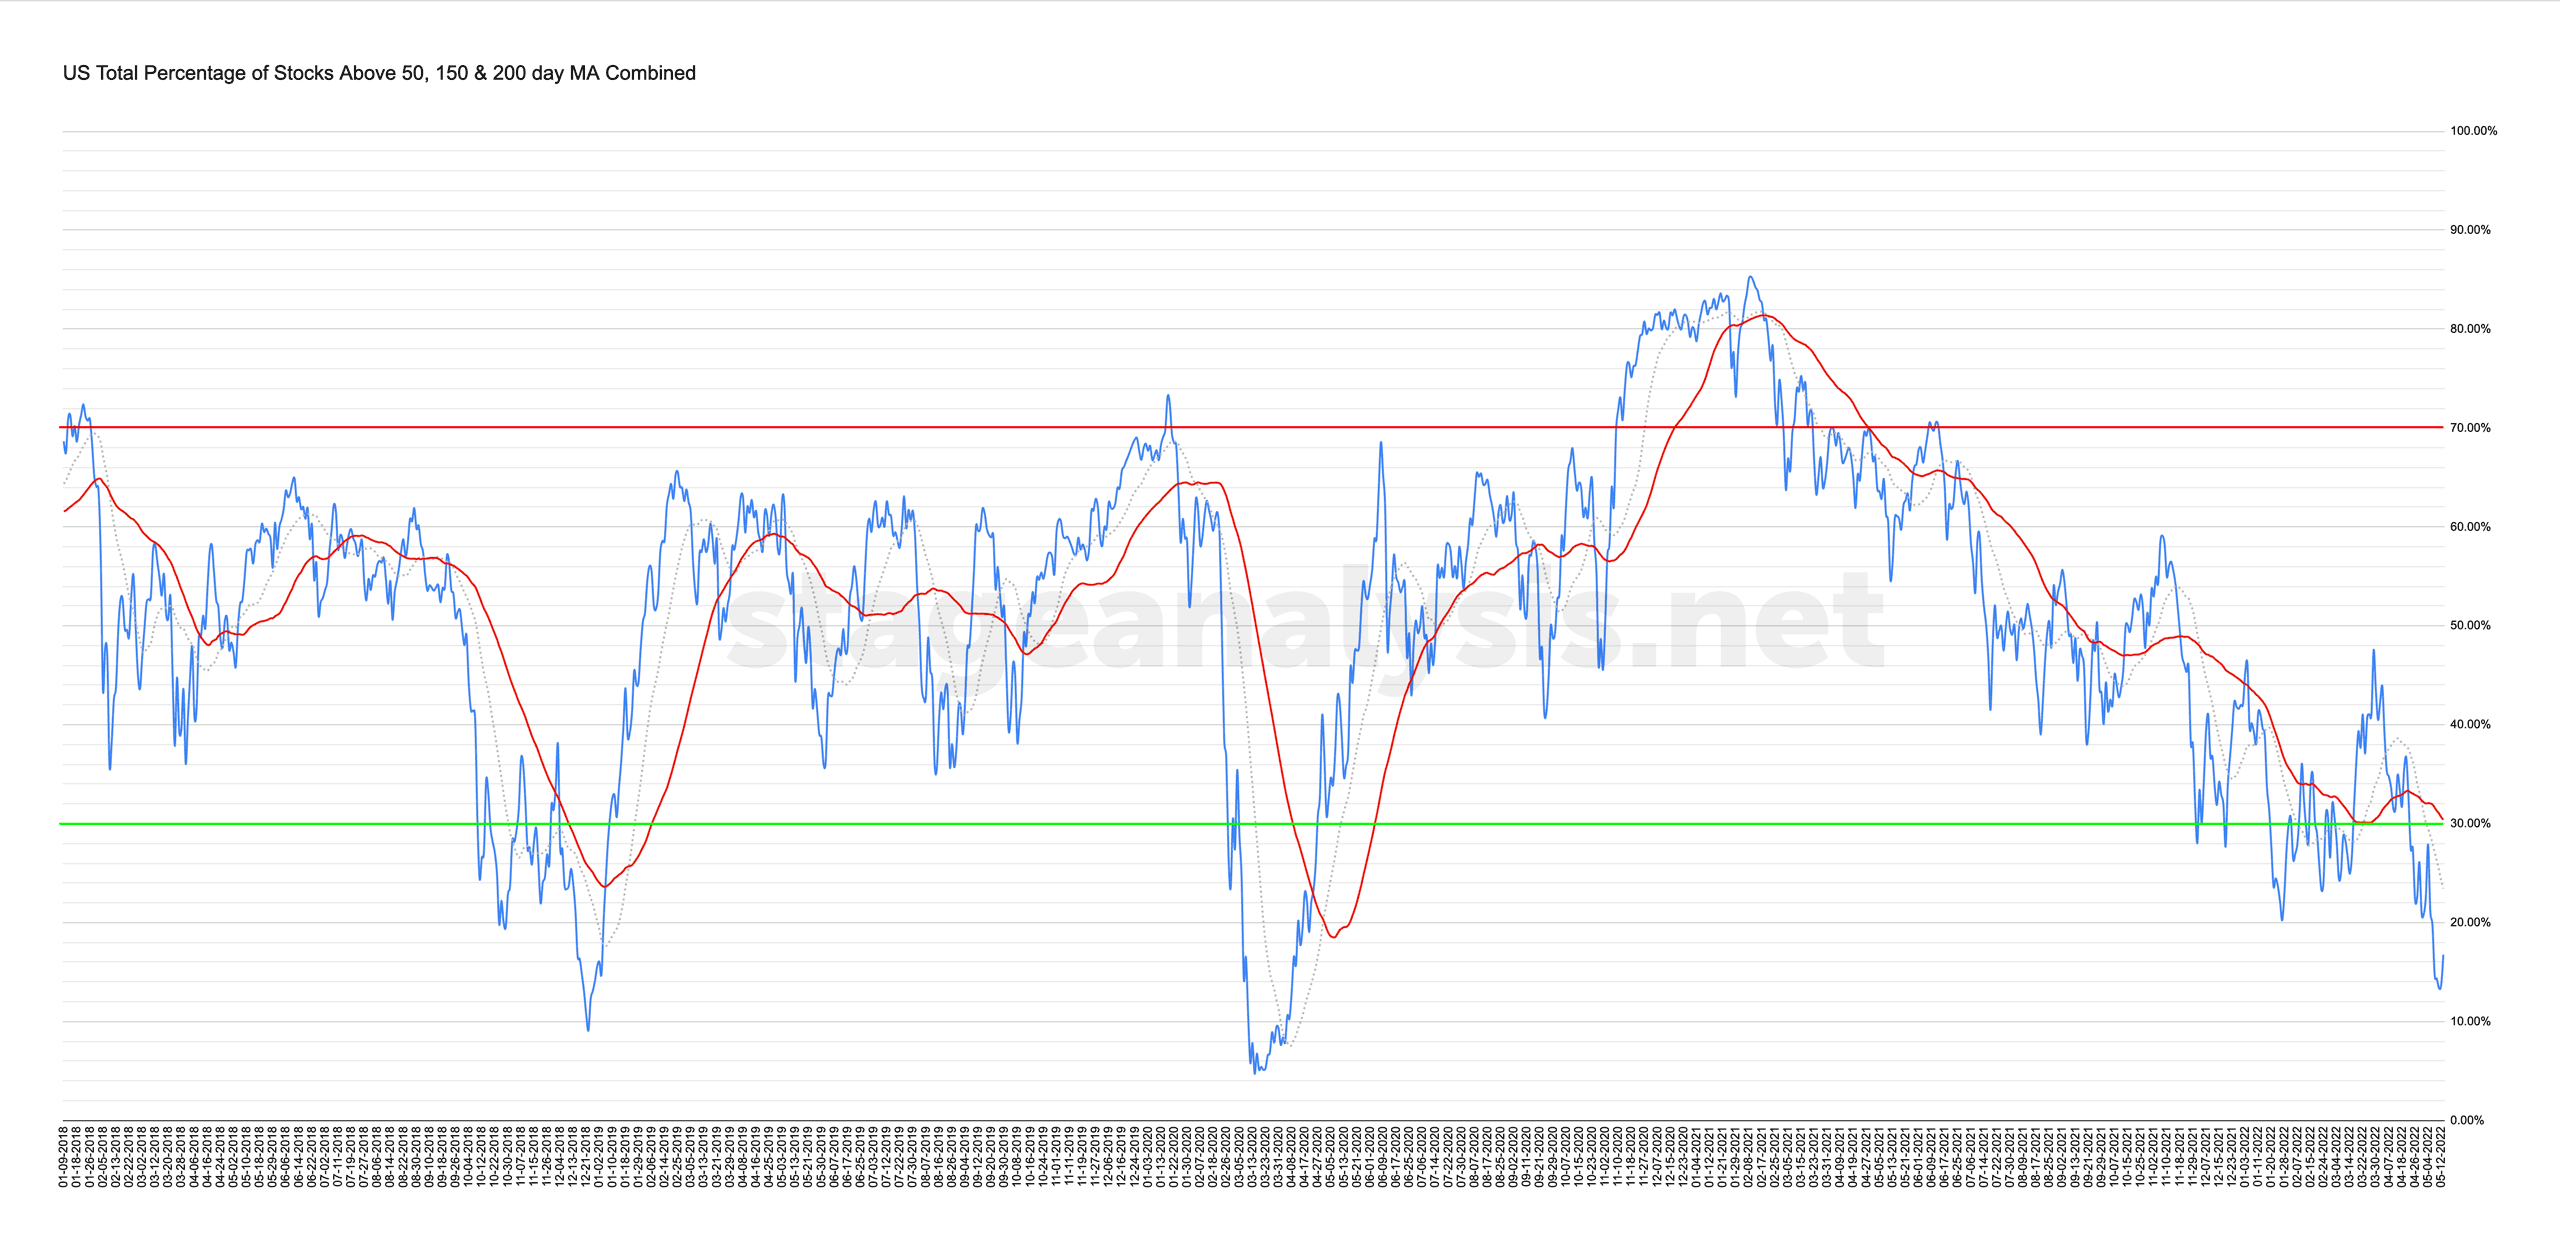
Market Breadth: Percentage of Stocks Above their 50 Day, 150 Day & 200 Day Moving Averages Combined
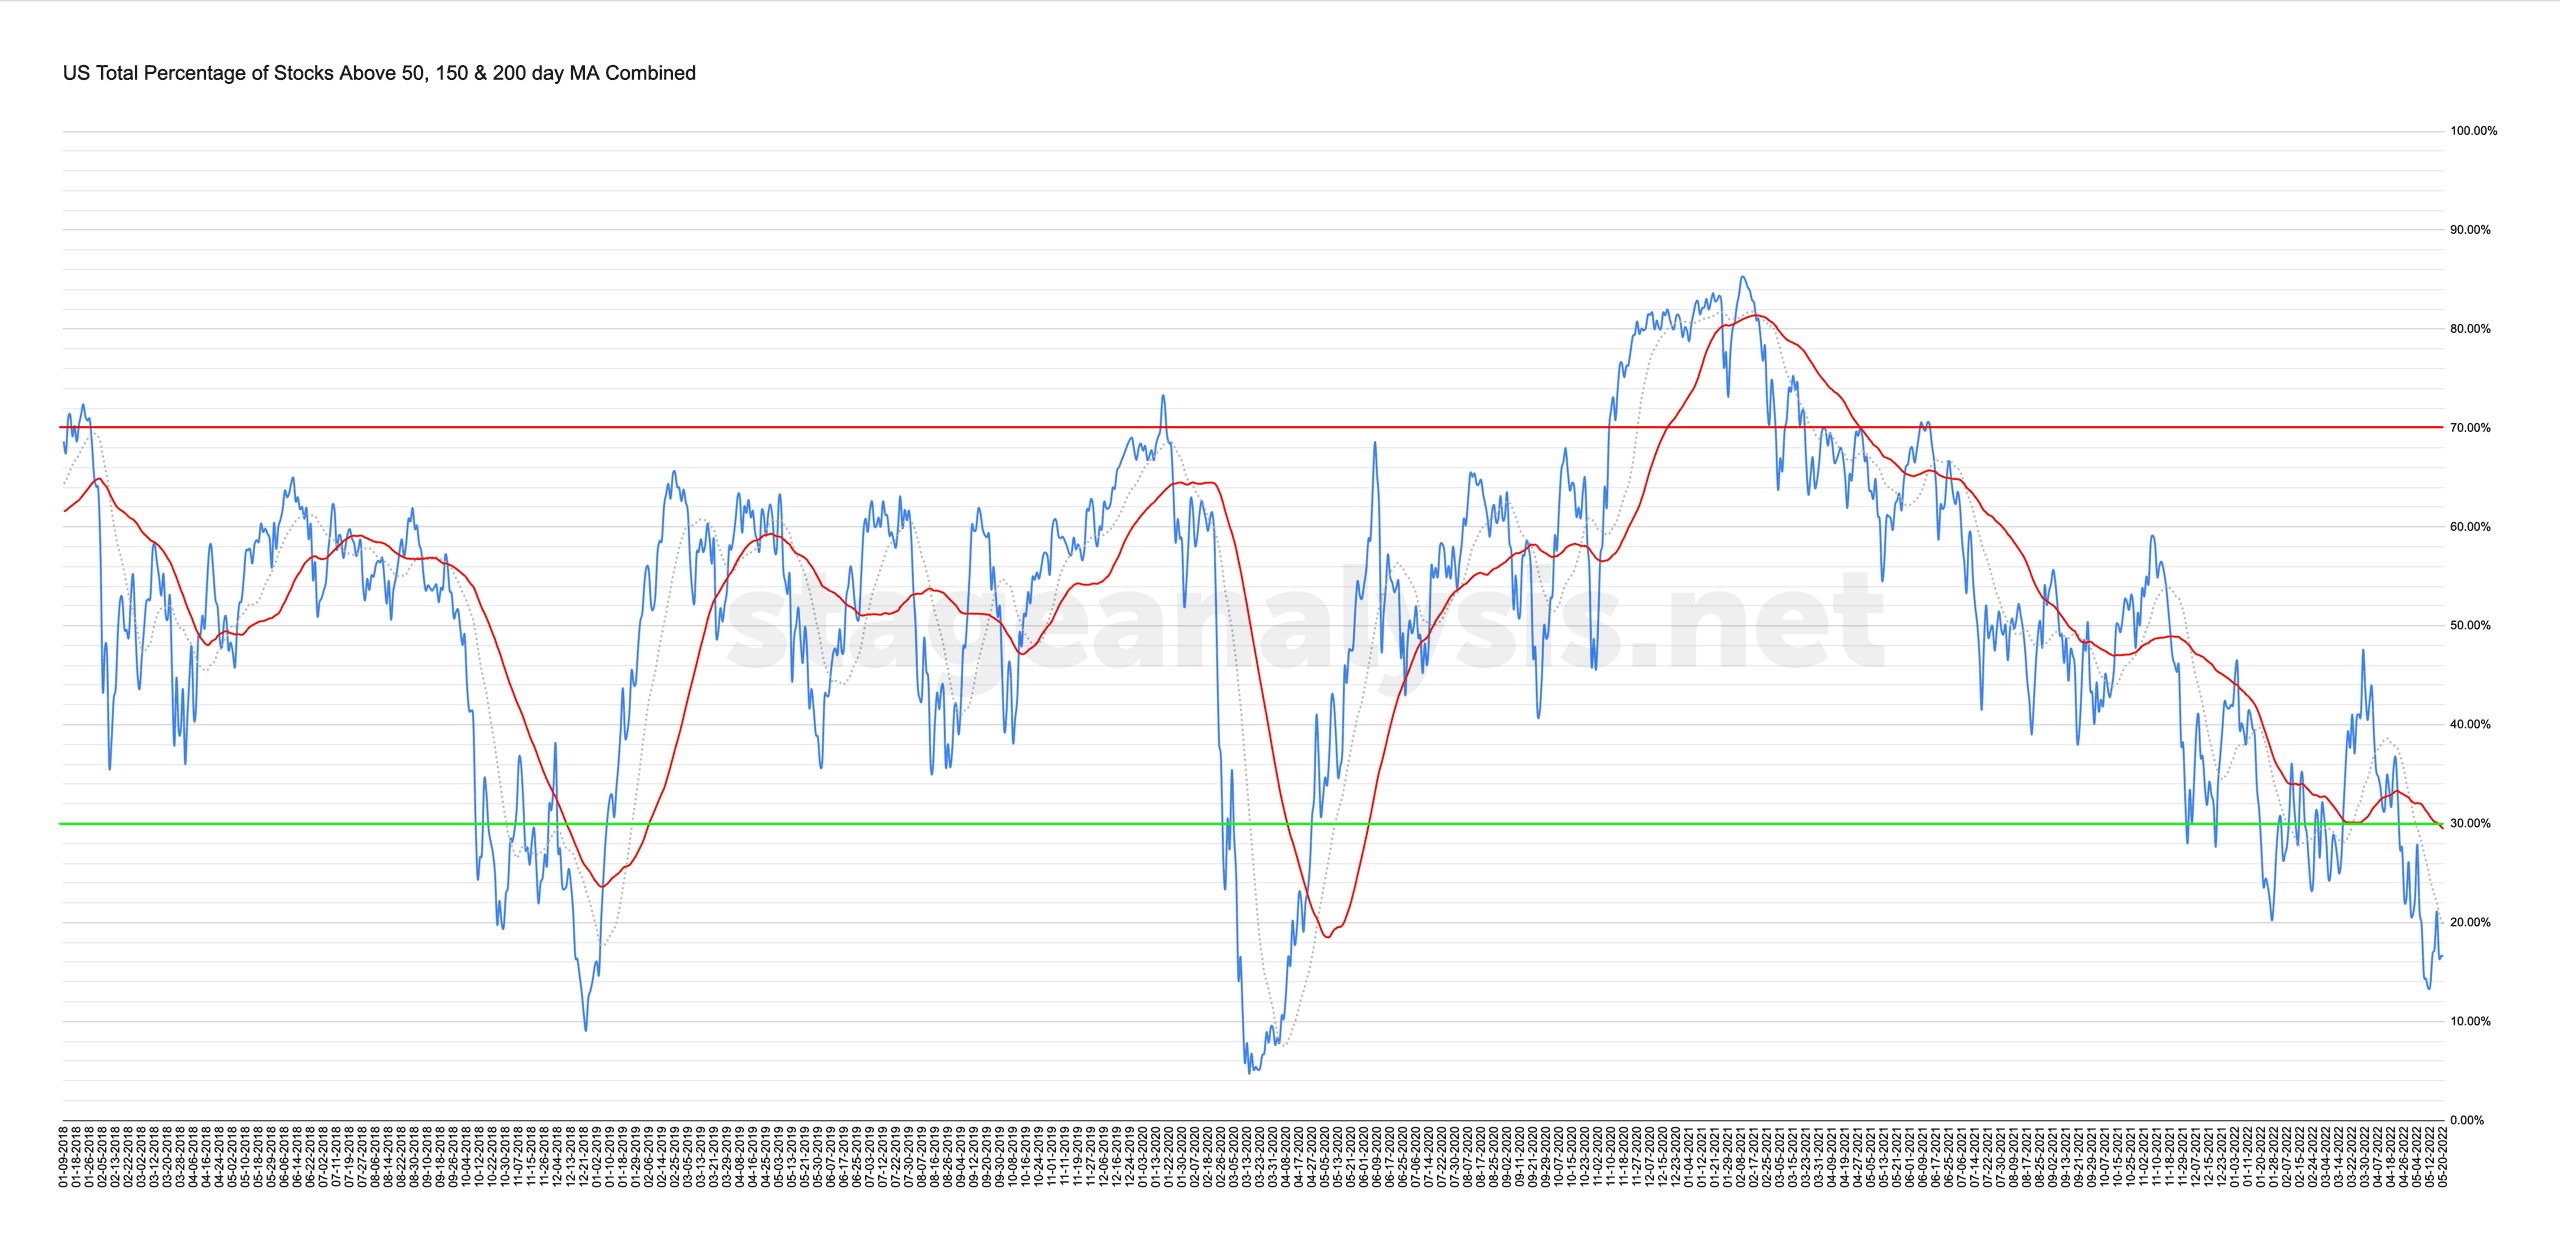
Custom Percentage of Stocks Above Their 50 Day, 150 Day & 200 Day Moving Averages Combined Market Breadth Charts for the Overall US Market, NYSE and Nasdaq for Market Timing and Strategy.
Read More
29 May, 2022
Stage Analysis Members Weekend Video – 29 May 2022 (1hr 43mins)
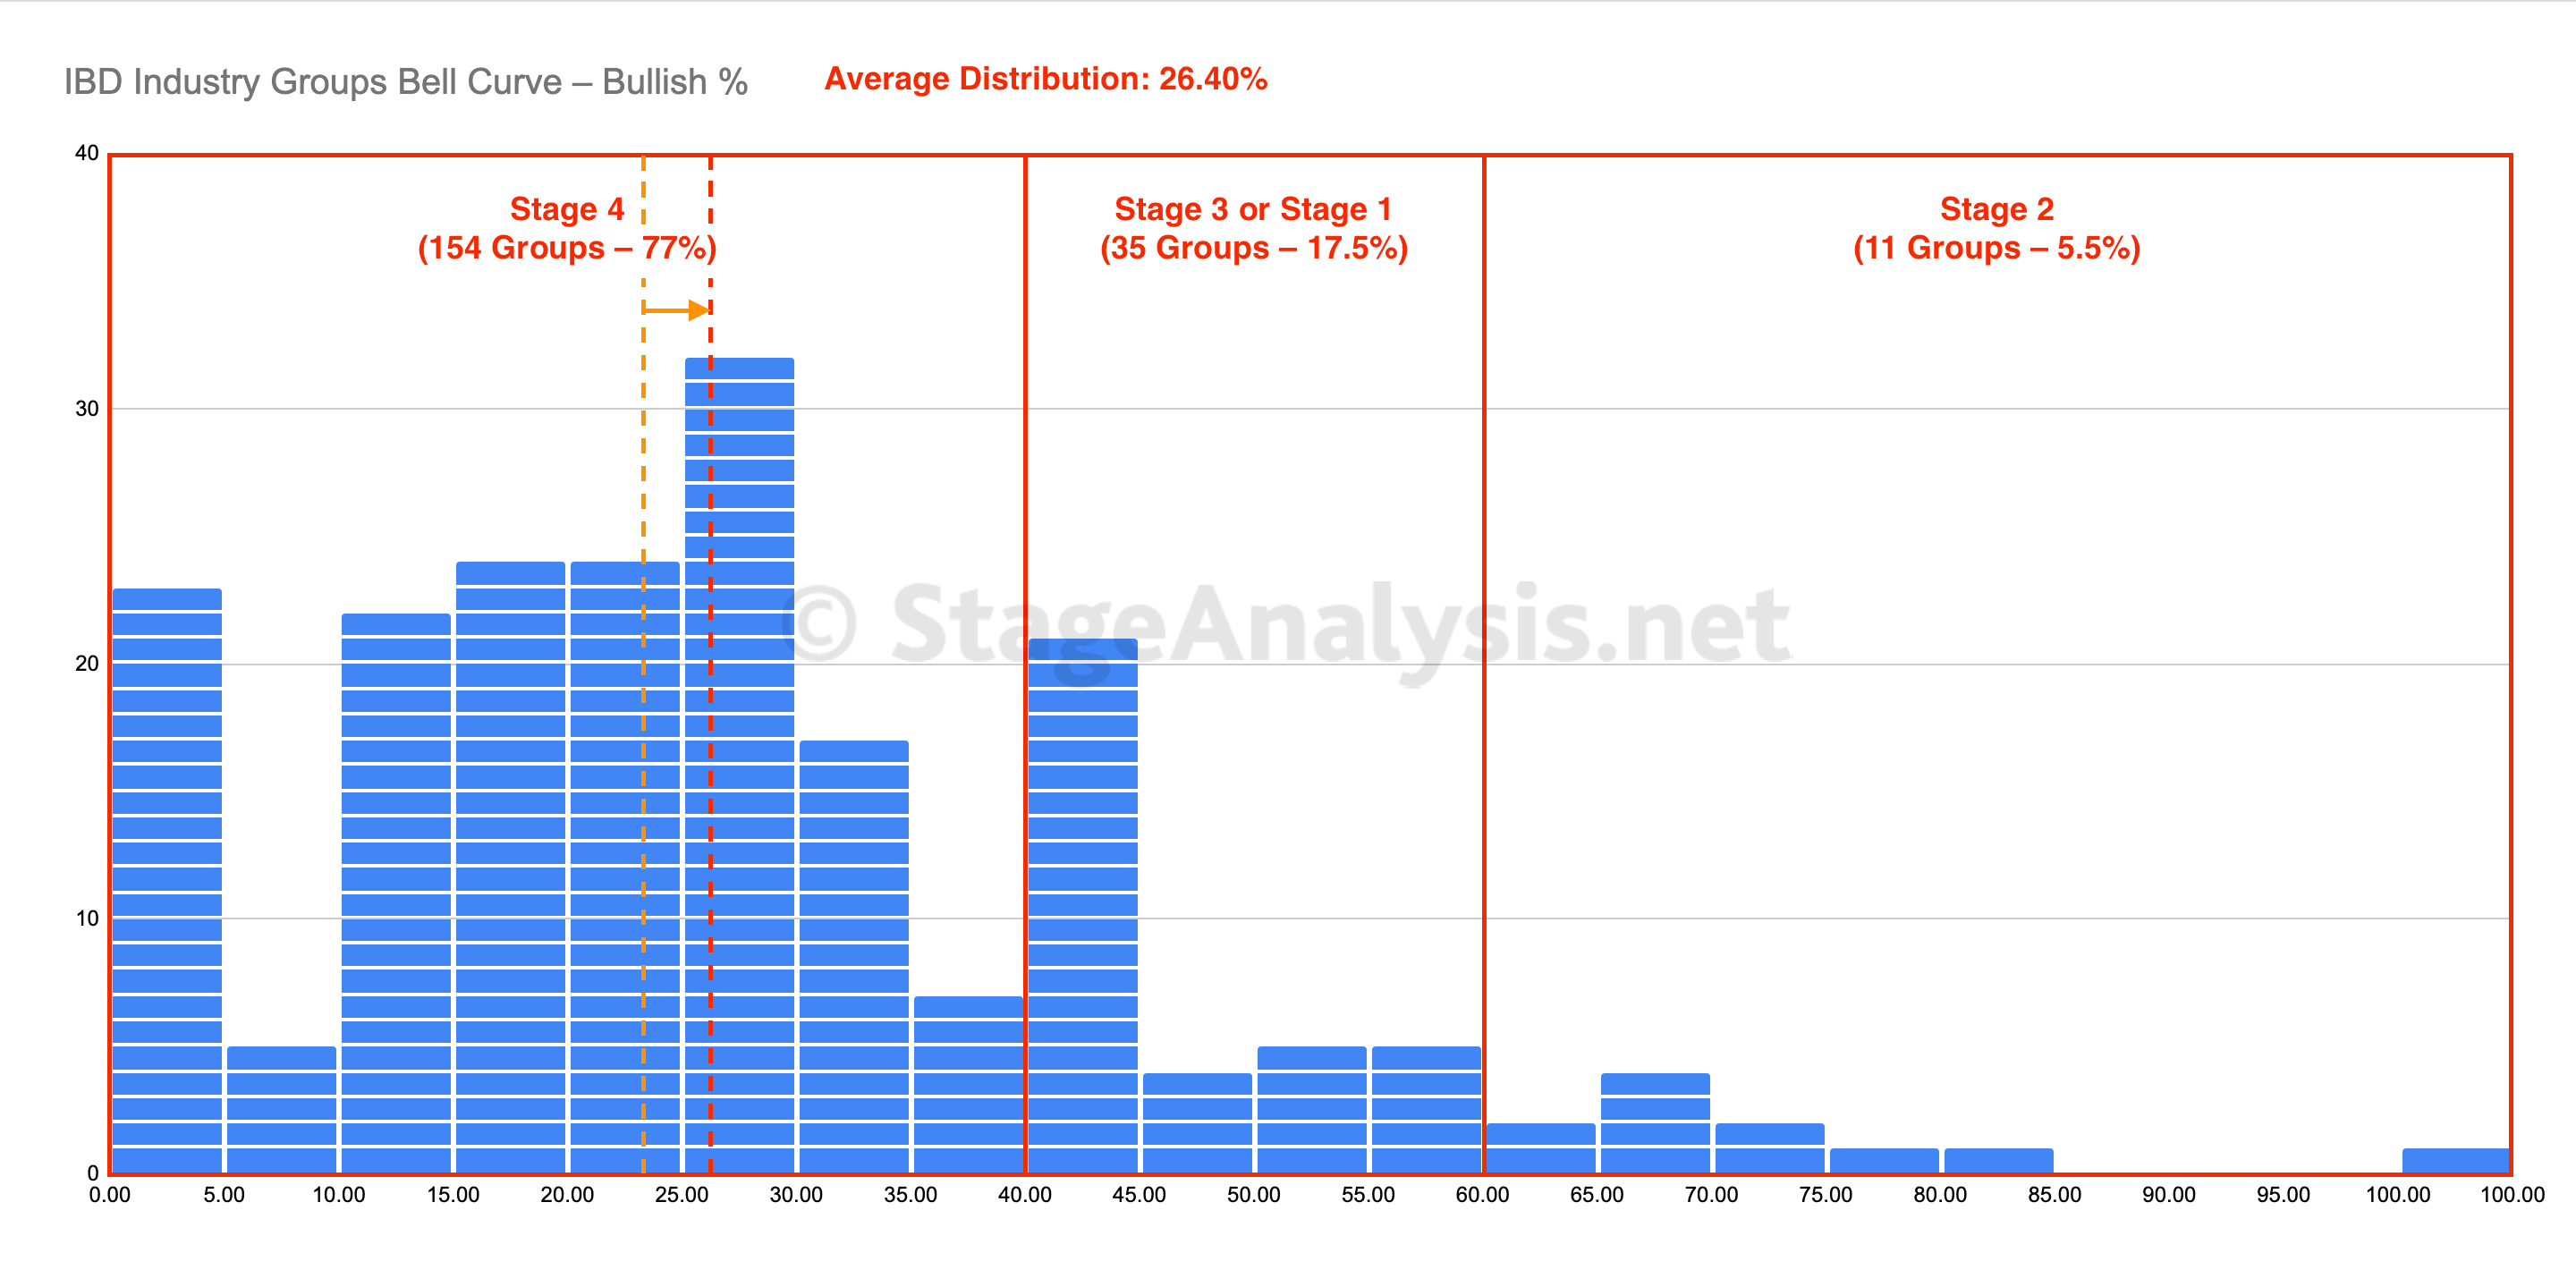
This weekends Stage Analysis Members Video features analysis of some attempted Stage 2 breakouts on strong relative volume and some strong volume springs. Followed by the Major Indexes Review on Multiple Timeframes, and the IBD Industry Group Bell Curve - Bullish %, as well as the Industry Groups Relative Strength Rankings and groups on the move. I also cover the Market Breadth Charts in detail to help to determine the Weight of Evidence and then I finish with detailed coverage of the weekends watchlist stocks from the US stock market and IPO stocks update from the midweek video.
Read More

28 May, 2022
Market Breadth: Percentage of Stocks Above their 50 Day, 150 Day & 200 Day Moving Averages Combined
Custom Percentage of Stocks Above Their 50 Day, 150 Day & 200 Day Moving Averages Combined Market Breadth Charts for the Overall US Market, NYSE and Nasdaq for Market Timing and Strategy.
Read More
25 May, 2022
Stage Analysis Members Midweek Video – IPO Special –25 May 2022 (1hr 30mins)
Todays Stage Analysis members video includes a special feature focusing on the IPO stocks that listed in the last year and are attempting to build bases. The has been a huge decline in the IPO stocks since November, with a more than -60% decline in the IPO etf for example that covers the group. But some of those younger stocks that have listed could recover and become future leading stocks once the Stage 4 decline ends and starts to transition into Stage 1.
Read More
22 May, 2022
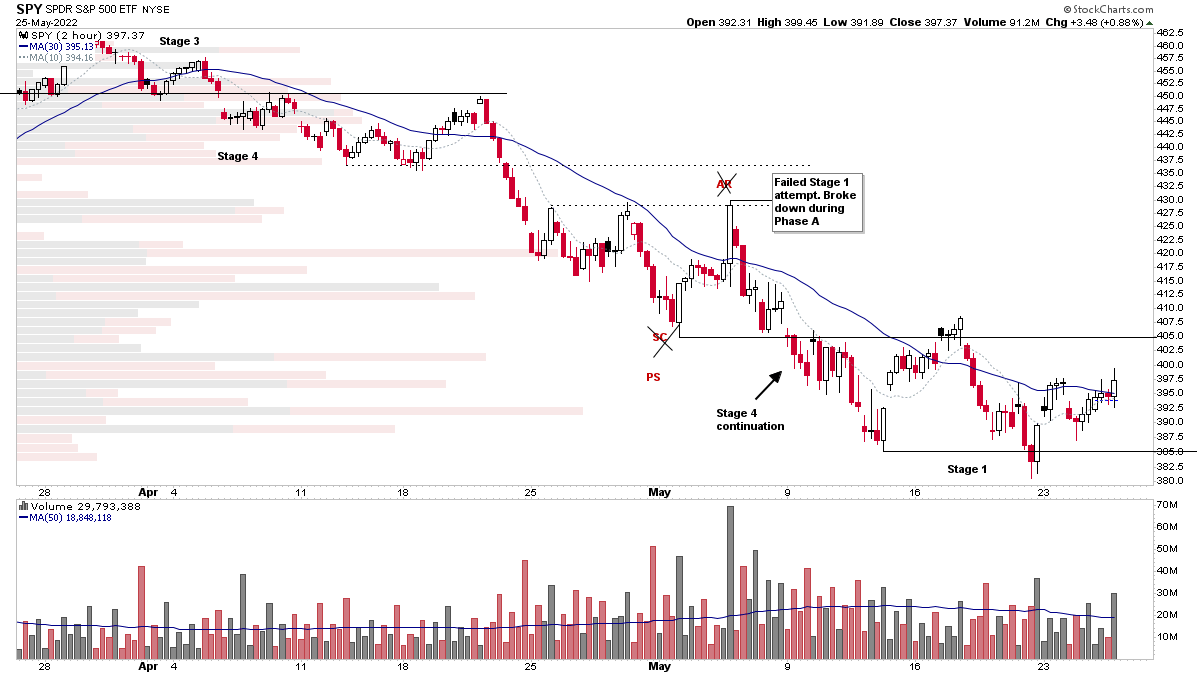
Stage Analysis Members Weekend Video – 22 May 2022 (1hr 18mins)
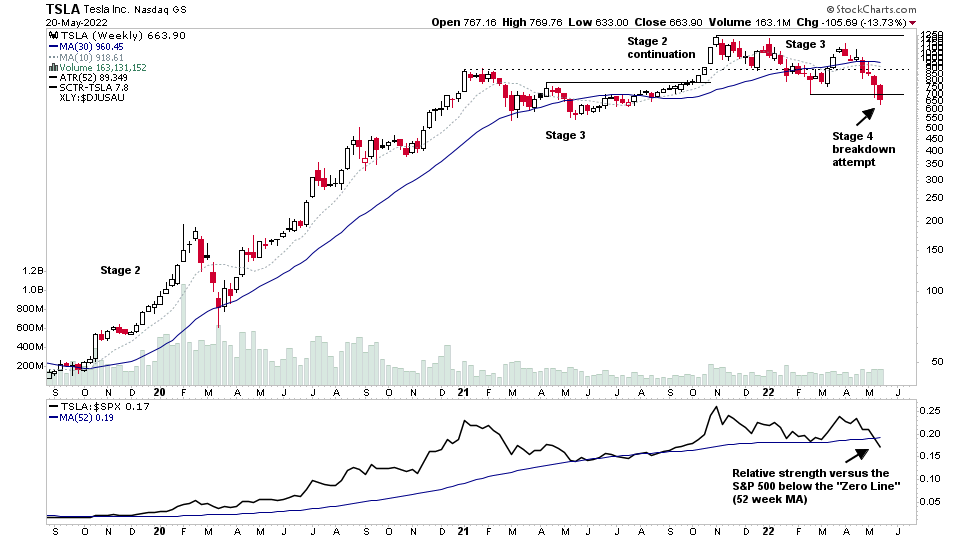
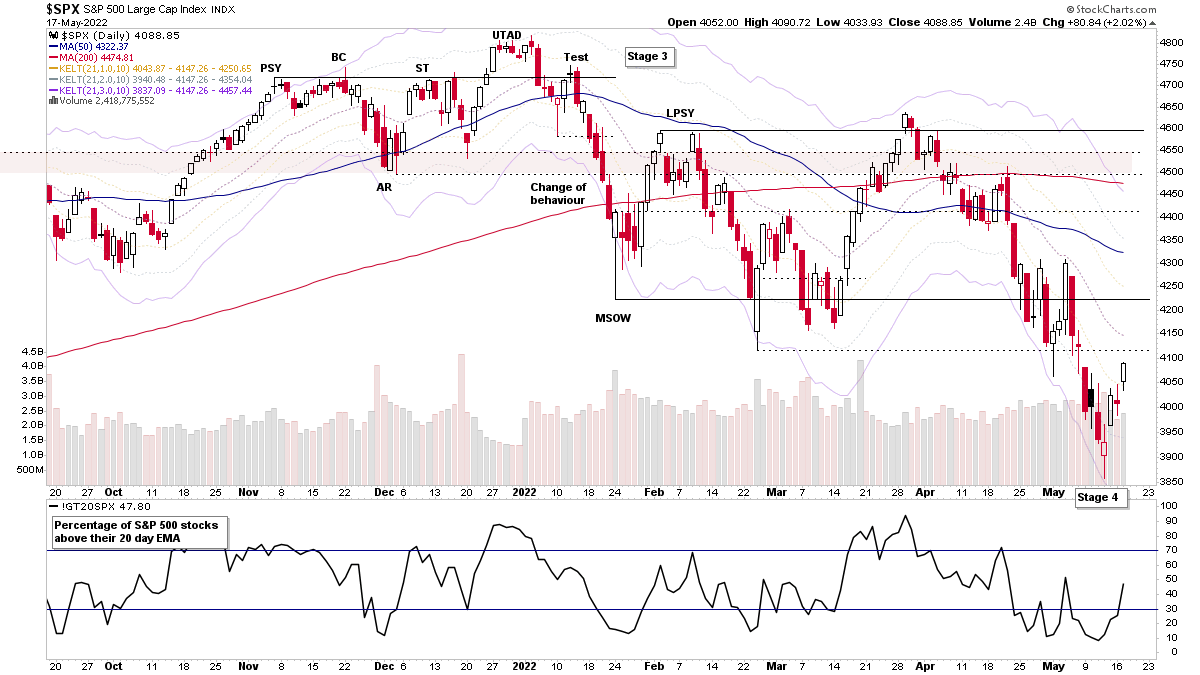
This weekends Stage Analysis Members Video features Stage Analysis of the mega caps $AAPL and $TLSA as they test major levels in early Stage 4, plus the Major Indexes Review. Then a look at the US Stocks Industry Groups Relative Strength tables and groups of interest. The Market Breadth Charts to determine The Weight of Evidence and the US Stocks Watchlist in Detail, with marked up charts of what I'm watching for on the long and short side.
Read More
21 May, 2022
Market Breadth: Percentage of Stocks Above their 50 Day, 150 Day & 200 Day Moving Averages Combined
Custom Percentage of Stocks Above Their 50 Day, 150 Day & 200 Day Moving Averages Combined Market Breadth Charts for the Overall US Market, NYSE and Nasdaq for Market Timing and Strategy.
Read More
19 May, 2022
Stage Analysis Members Midweek Video – 18 May 2022 (1hr 17mins)
The Stage Analysis Members Midweek Video features Analysis of the Stages of the major US sectors, as well as a look at the sector breadth visual the custom IBD Industry Groups Bell Curve – Bullish % chart that I do for the members that shows the distribution of the 200 IBD Industry Groups as a bell curve chart...
Read More
18 May, 2022
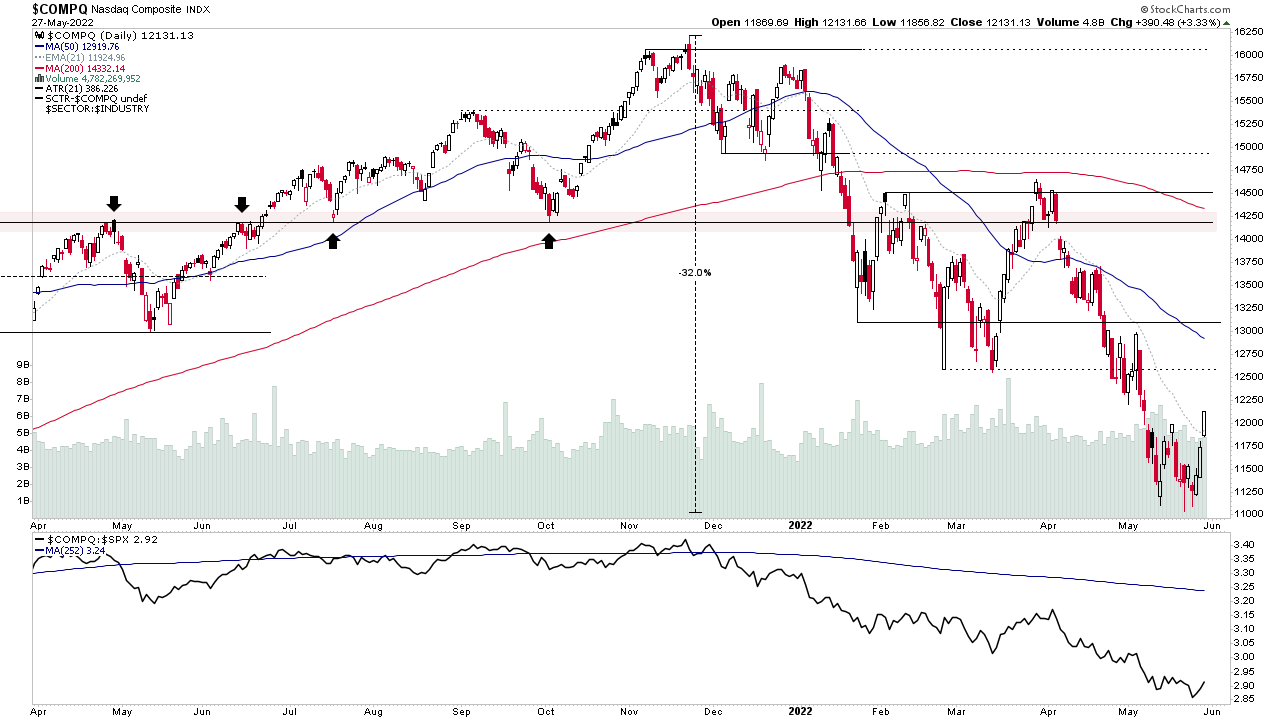
NYSE Bullish Percent Status Change to Bull Alert and New CAN SLIM Follow Through Day Triggered
The major indexes managed to put in a Follow Through Day (FTD) which is defined in the excellent book about the CAN SLIM method called – How to Make Money in Stocks: A Winning System in Good Times and Bad, Fourth Edition by William O'Neil. Which changes the Investors Business Daily (IBD) outlook to Confirmed Uptrend.
Read More
14 May, 2022
Market Breadth: Percentage of Stocks Above their 50 Day, 150 Day & 200 Day Moving Averages Combined
Custom Percentage of Stocks Above Their 50 Day, 150 Day & 200 Day Moving Averages Combined Market Breadth Charts for the Overall US Market, NYSE and Nasdaq for Market Timing and Strategy.
Read More