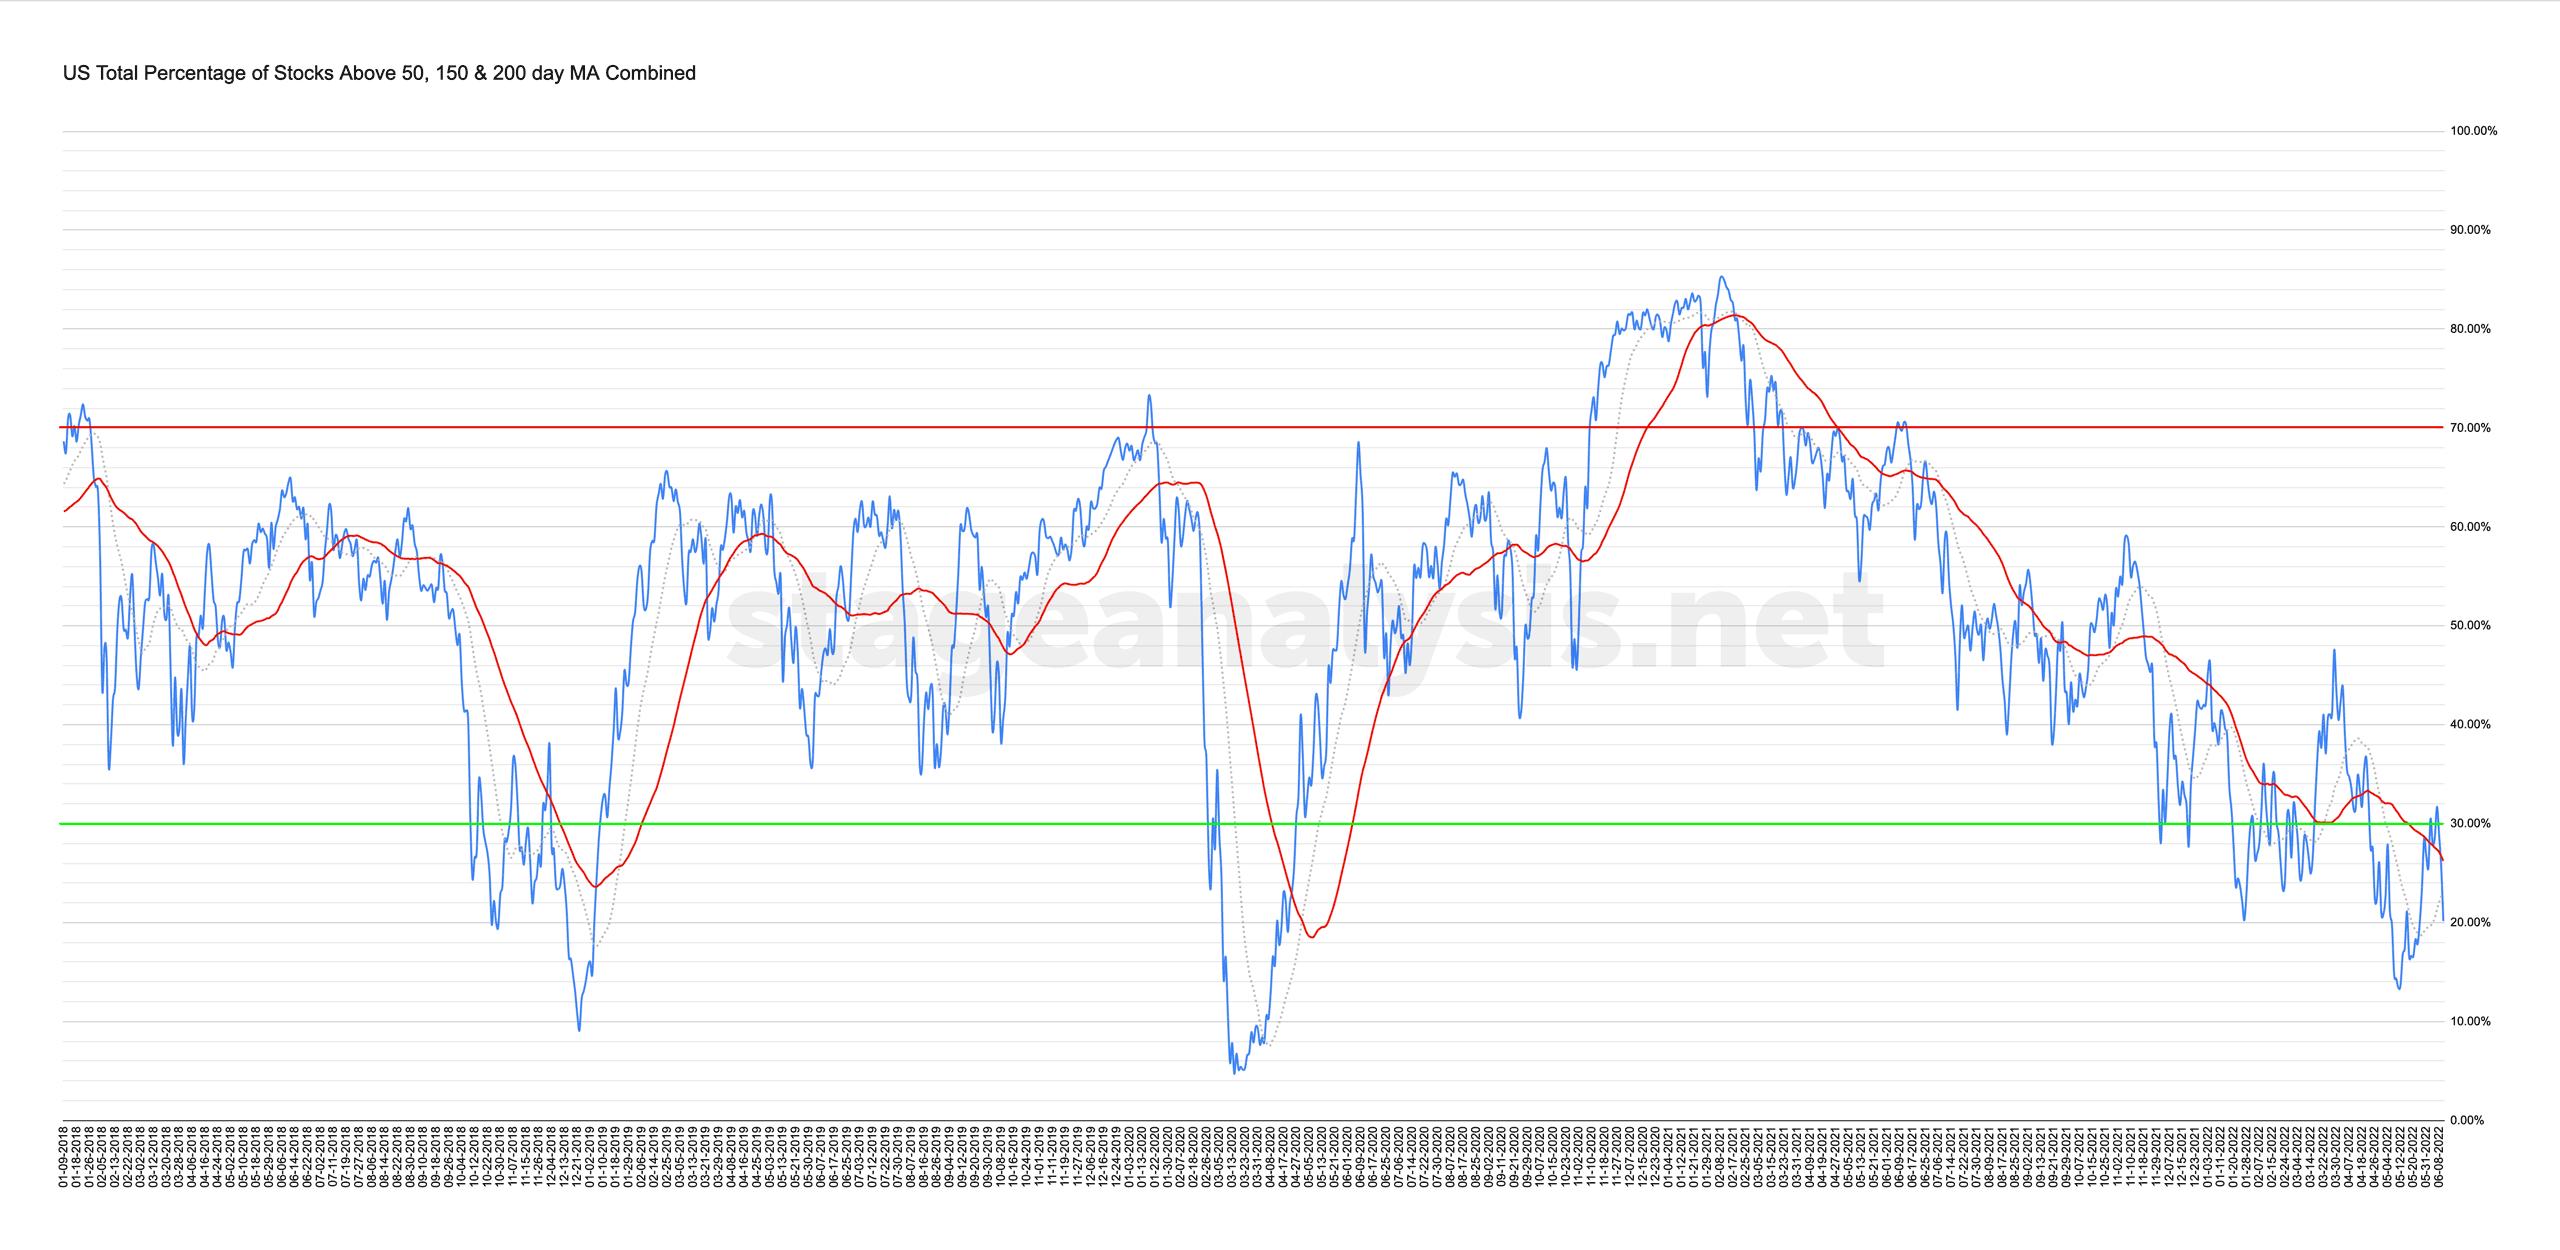
Custom Percentage of Stocks Above Their 50 Day, 150 Day & 200 Day Moving Averages Combined Market Breadth Charts for the Overall US Market, NYSE and Nasdaq for Market Timing and Strategy.
Read More

Blog
25 June, 2022
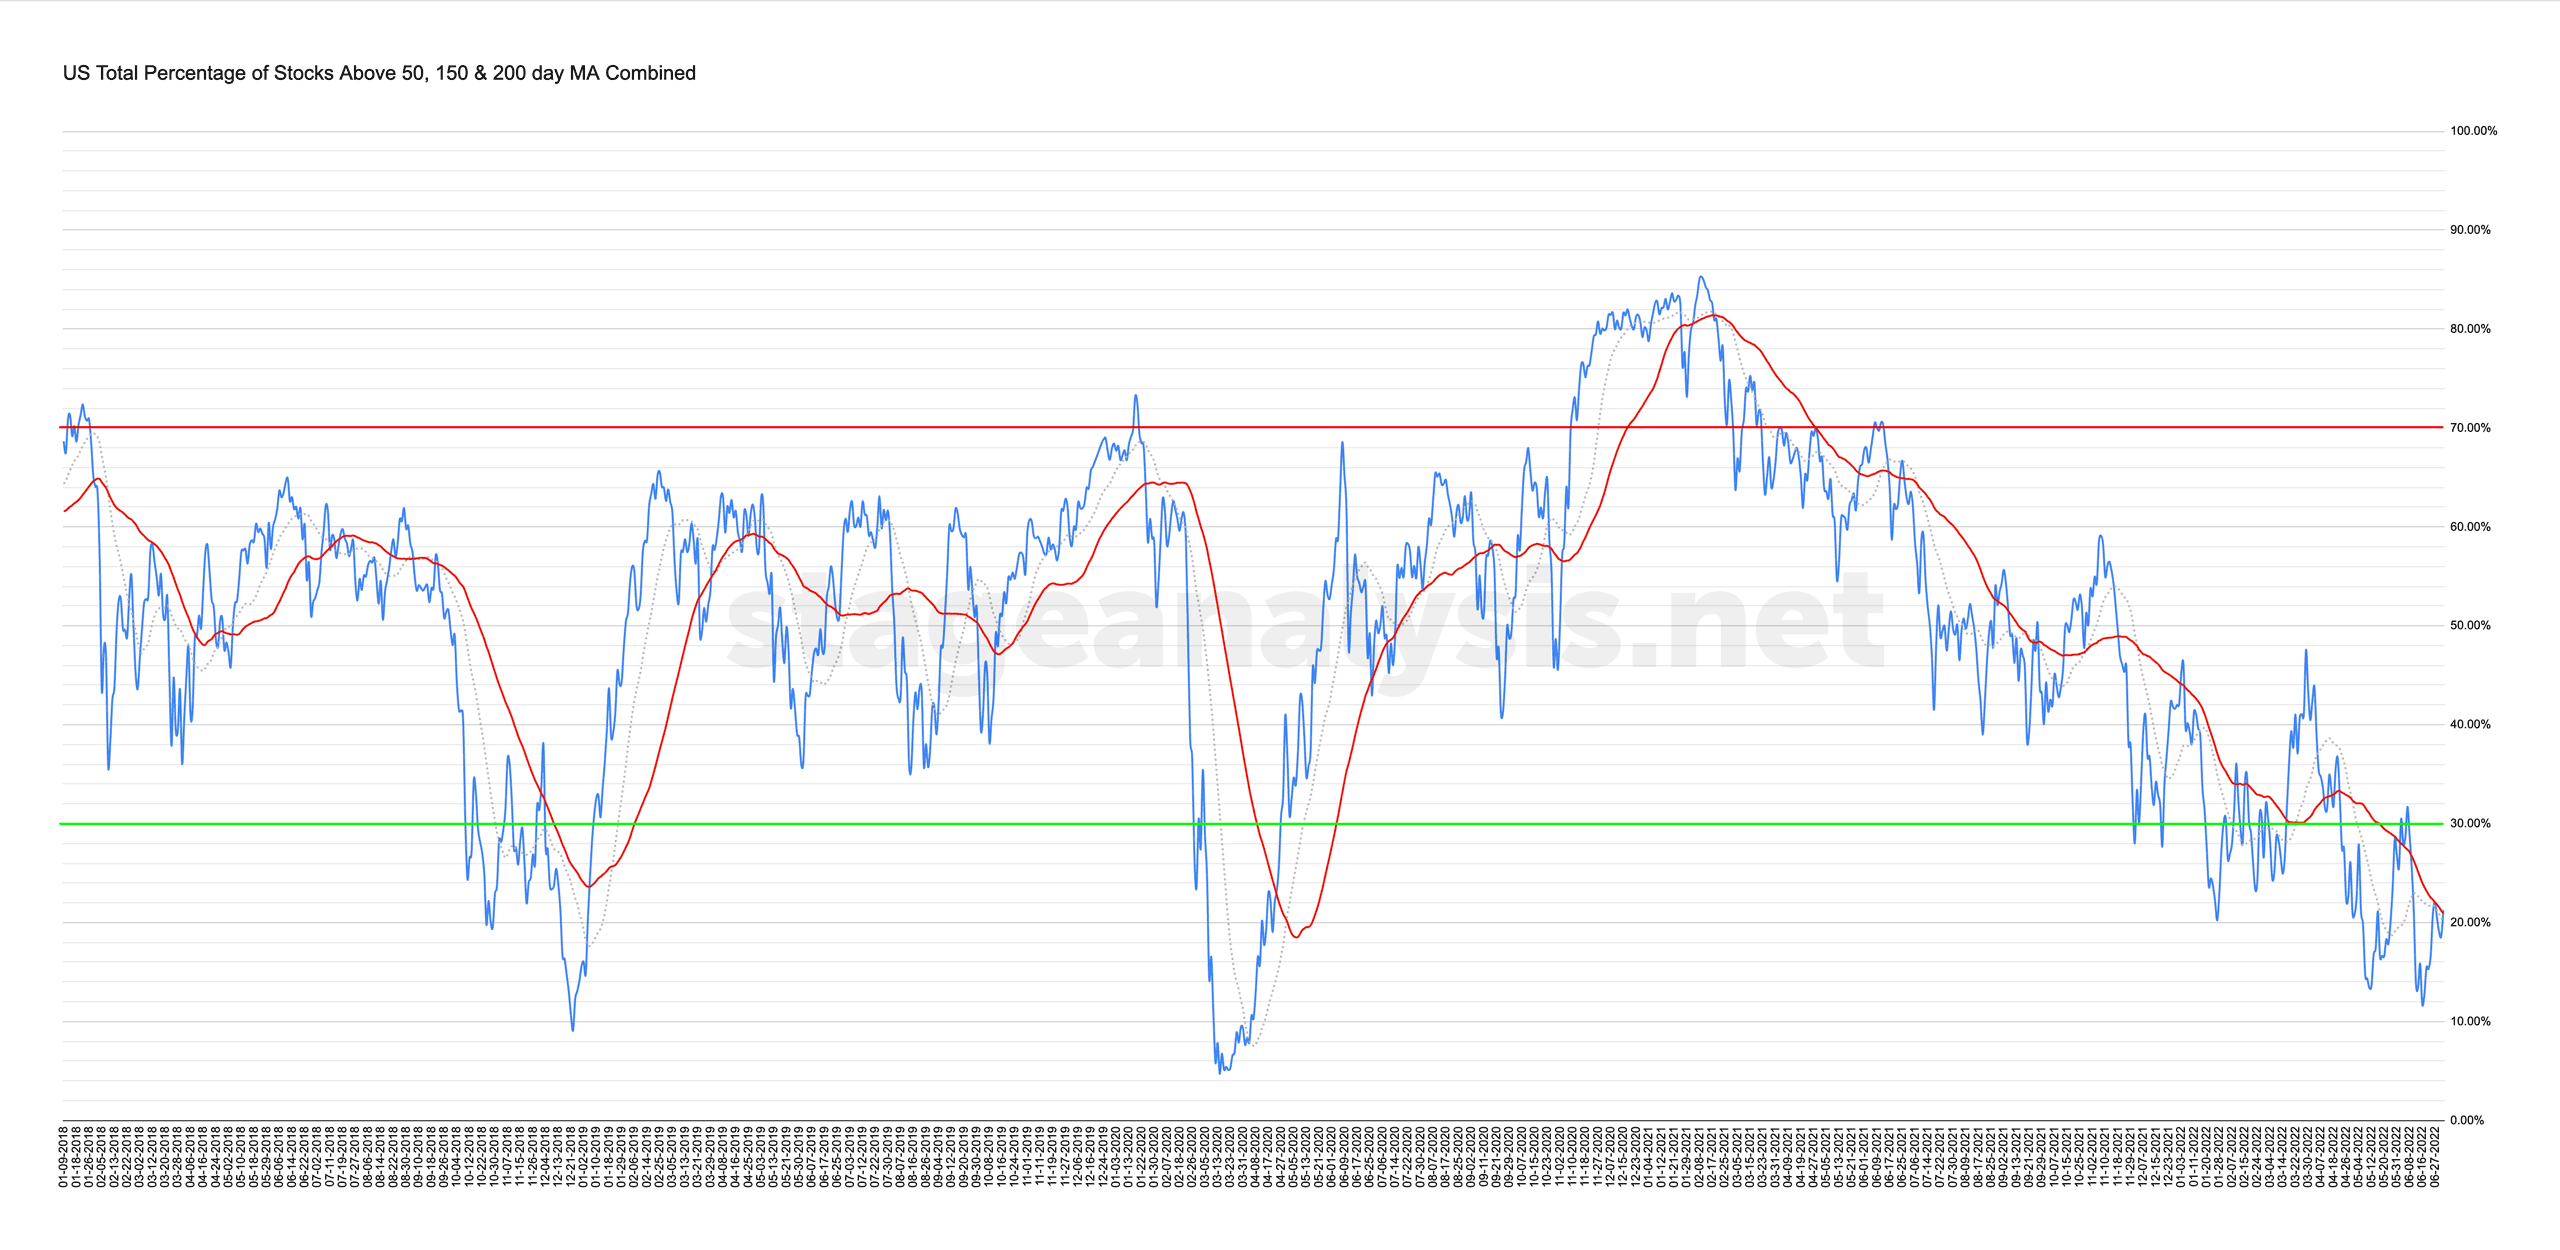
Market Breadth: Percentage of Stocks Above their 50 Day, 150 Day & 200 Day Moving Averages Combined
Custom Percentage of Stocks Above Their 50 Day, 150 Day & 200 Day Moving Averages Combined Market Breadth Charts for the Overall US Market, NYSE and Nasdaq for Market Timing and Strategy.
Read More
19 June, 2022
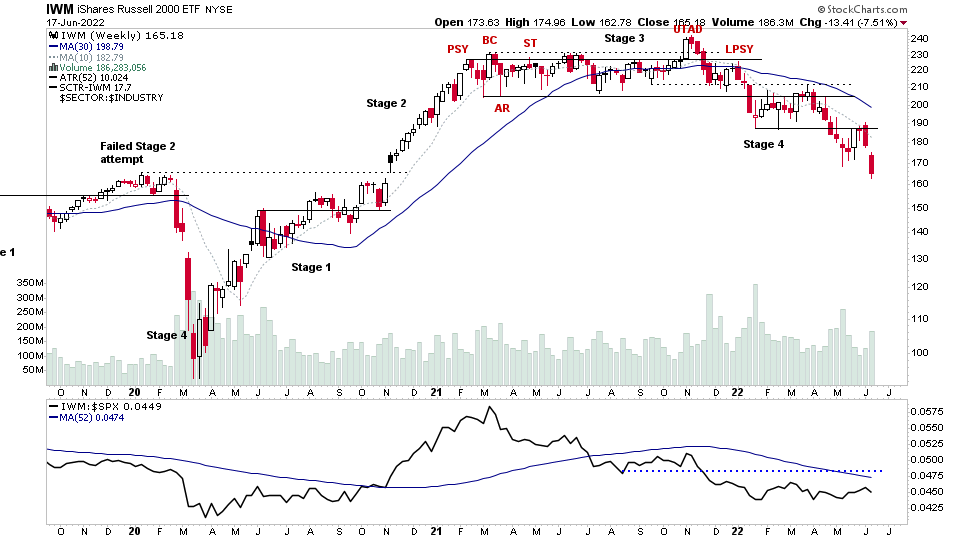
Stage Analysis Members Weekend Video – 19 June 2022 (1hr 24mins)
The Stage Analysis Members Weekend Video this week covers the Major Indexes with analysis of S&P 500, Nasdaq, Russell 2000 and more. Plus a look at futures charts of Oil, Copper, Treasuries & Gold...
Read More
18 June, 2022
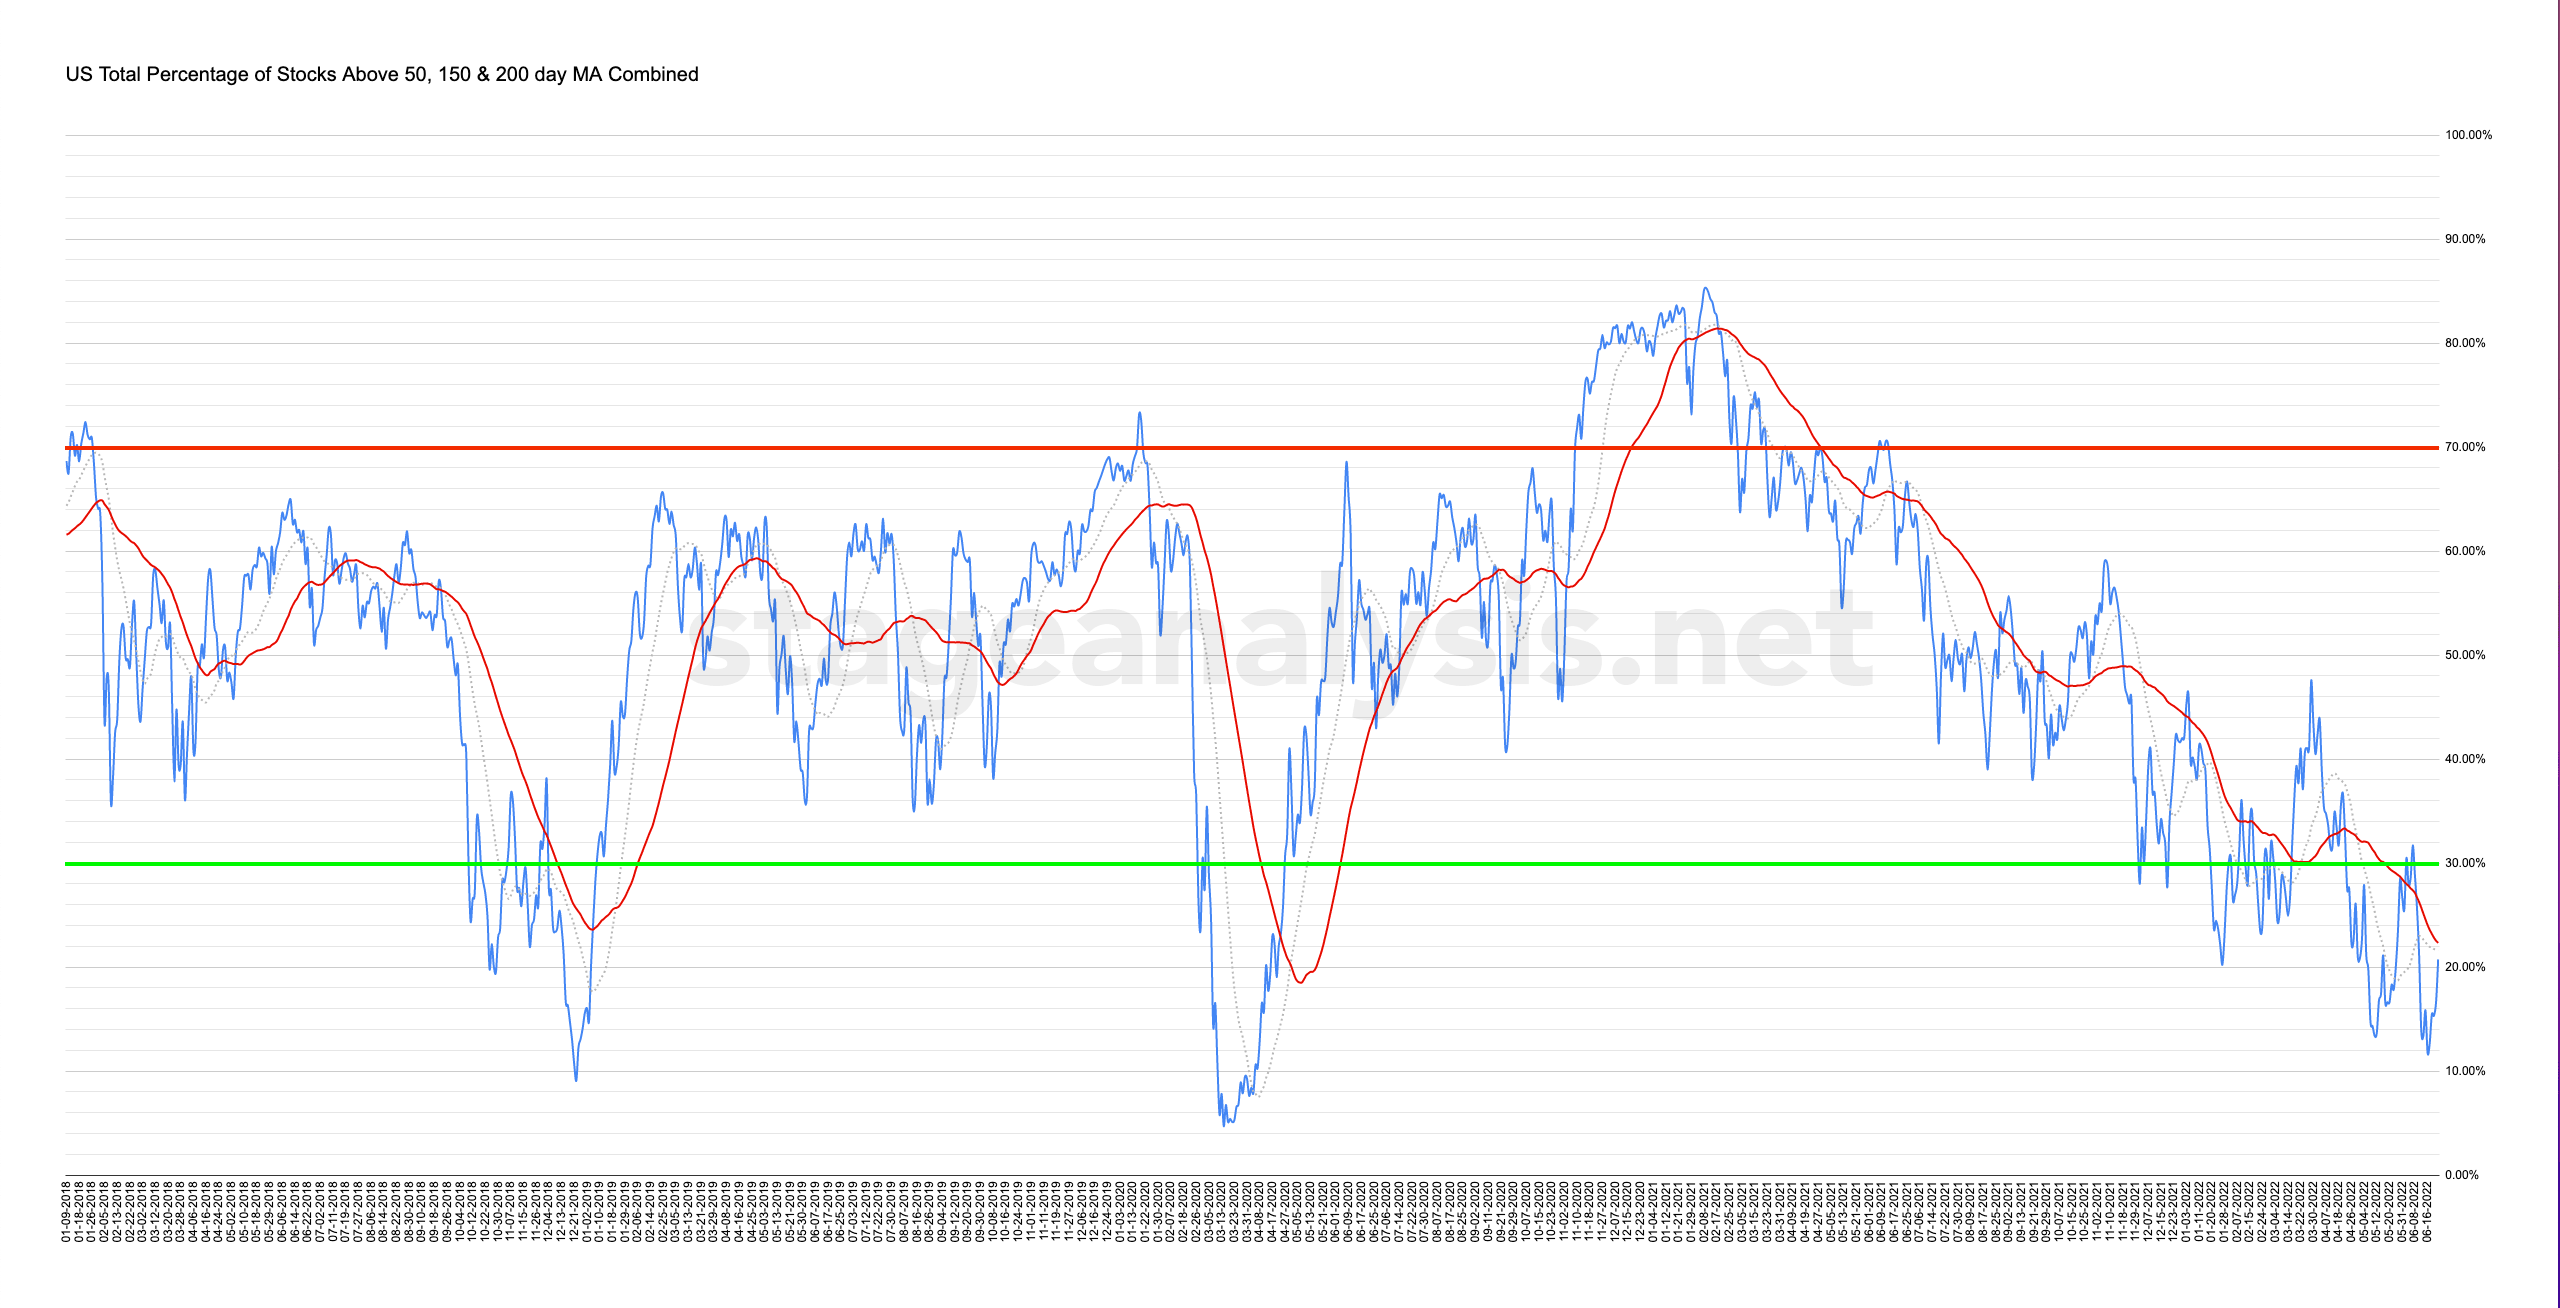
Market Breadth: Percentage of Stocks Above their 50 Day, 150 Day & 200 Day Moving Averages Combined
Custom Percentage of Stocks Above Their 50 Day, 150 Day & 200 Day Moving Averages Combined Market Breadth Charts for the Overall US Market, NYSE and Nasdaq for Market Timing and Strategy.
Read More
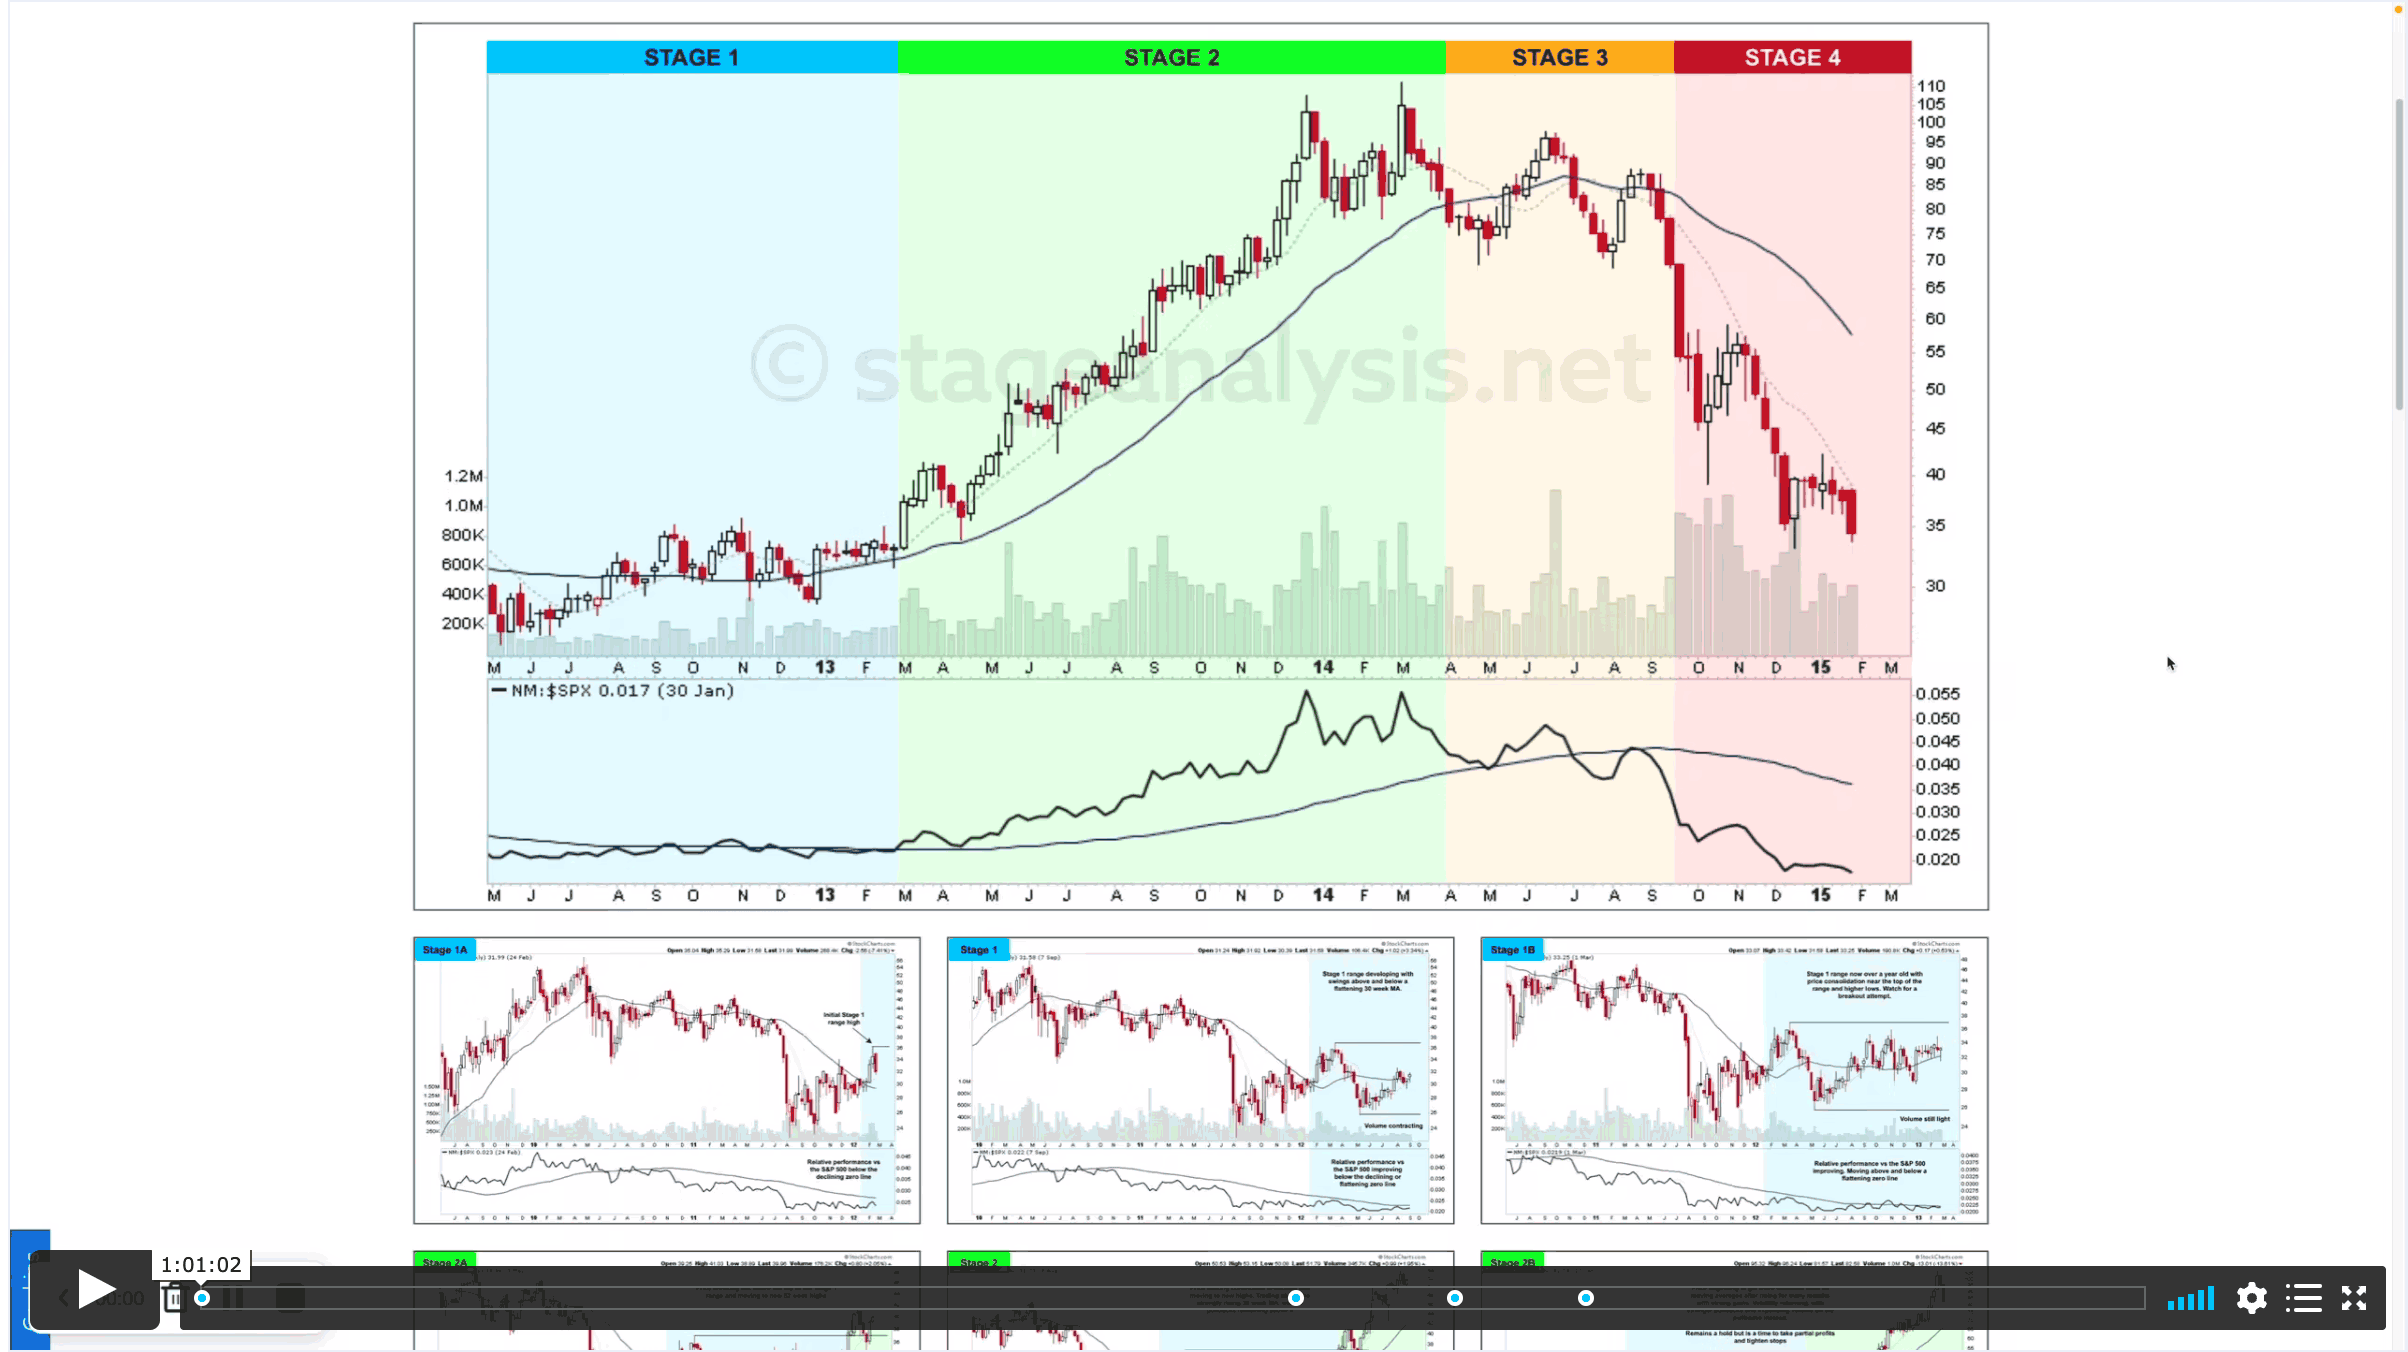
15 June, 2022
Stage Analysis Members Midweek Video – 15 June 2022 (1hr 4mins)
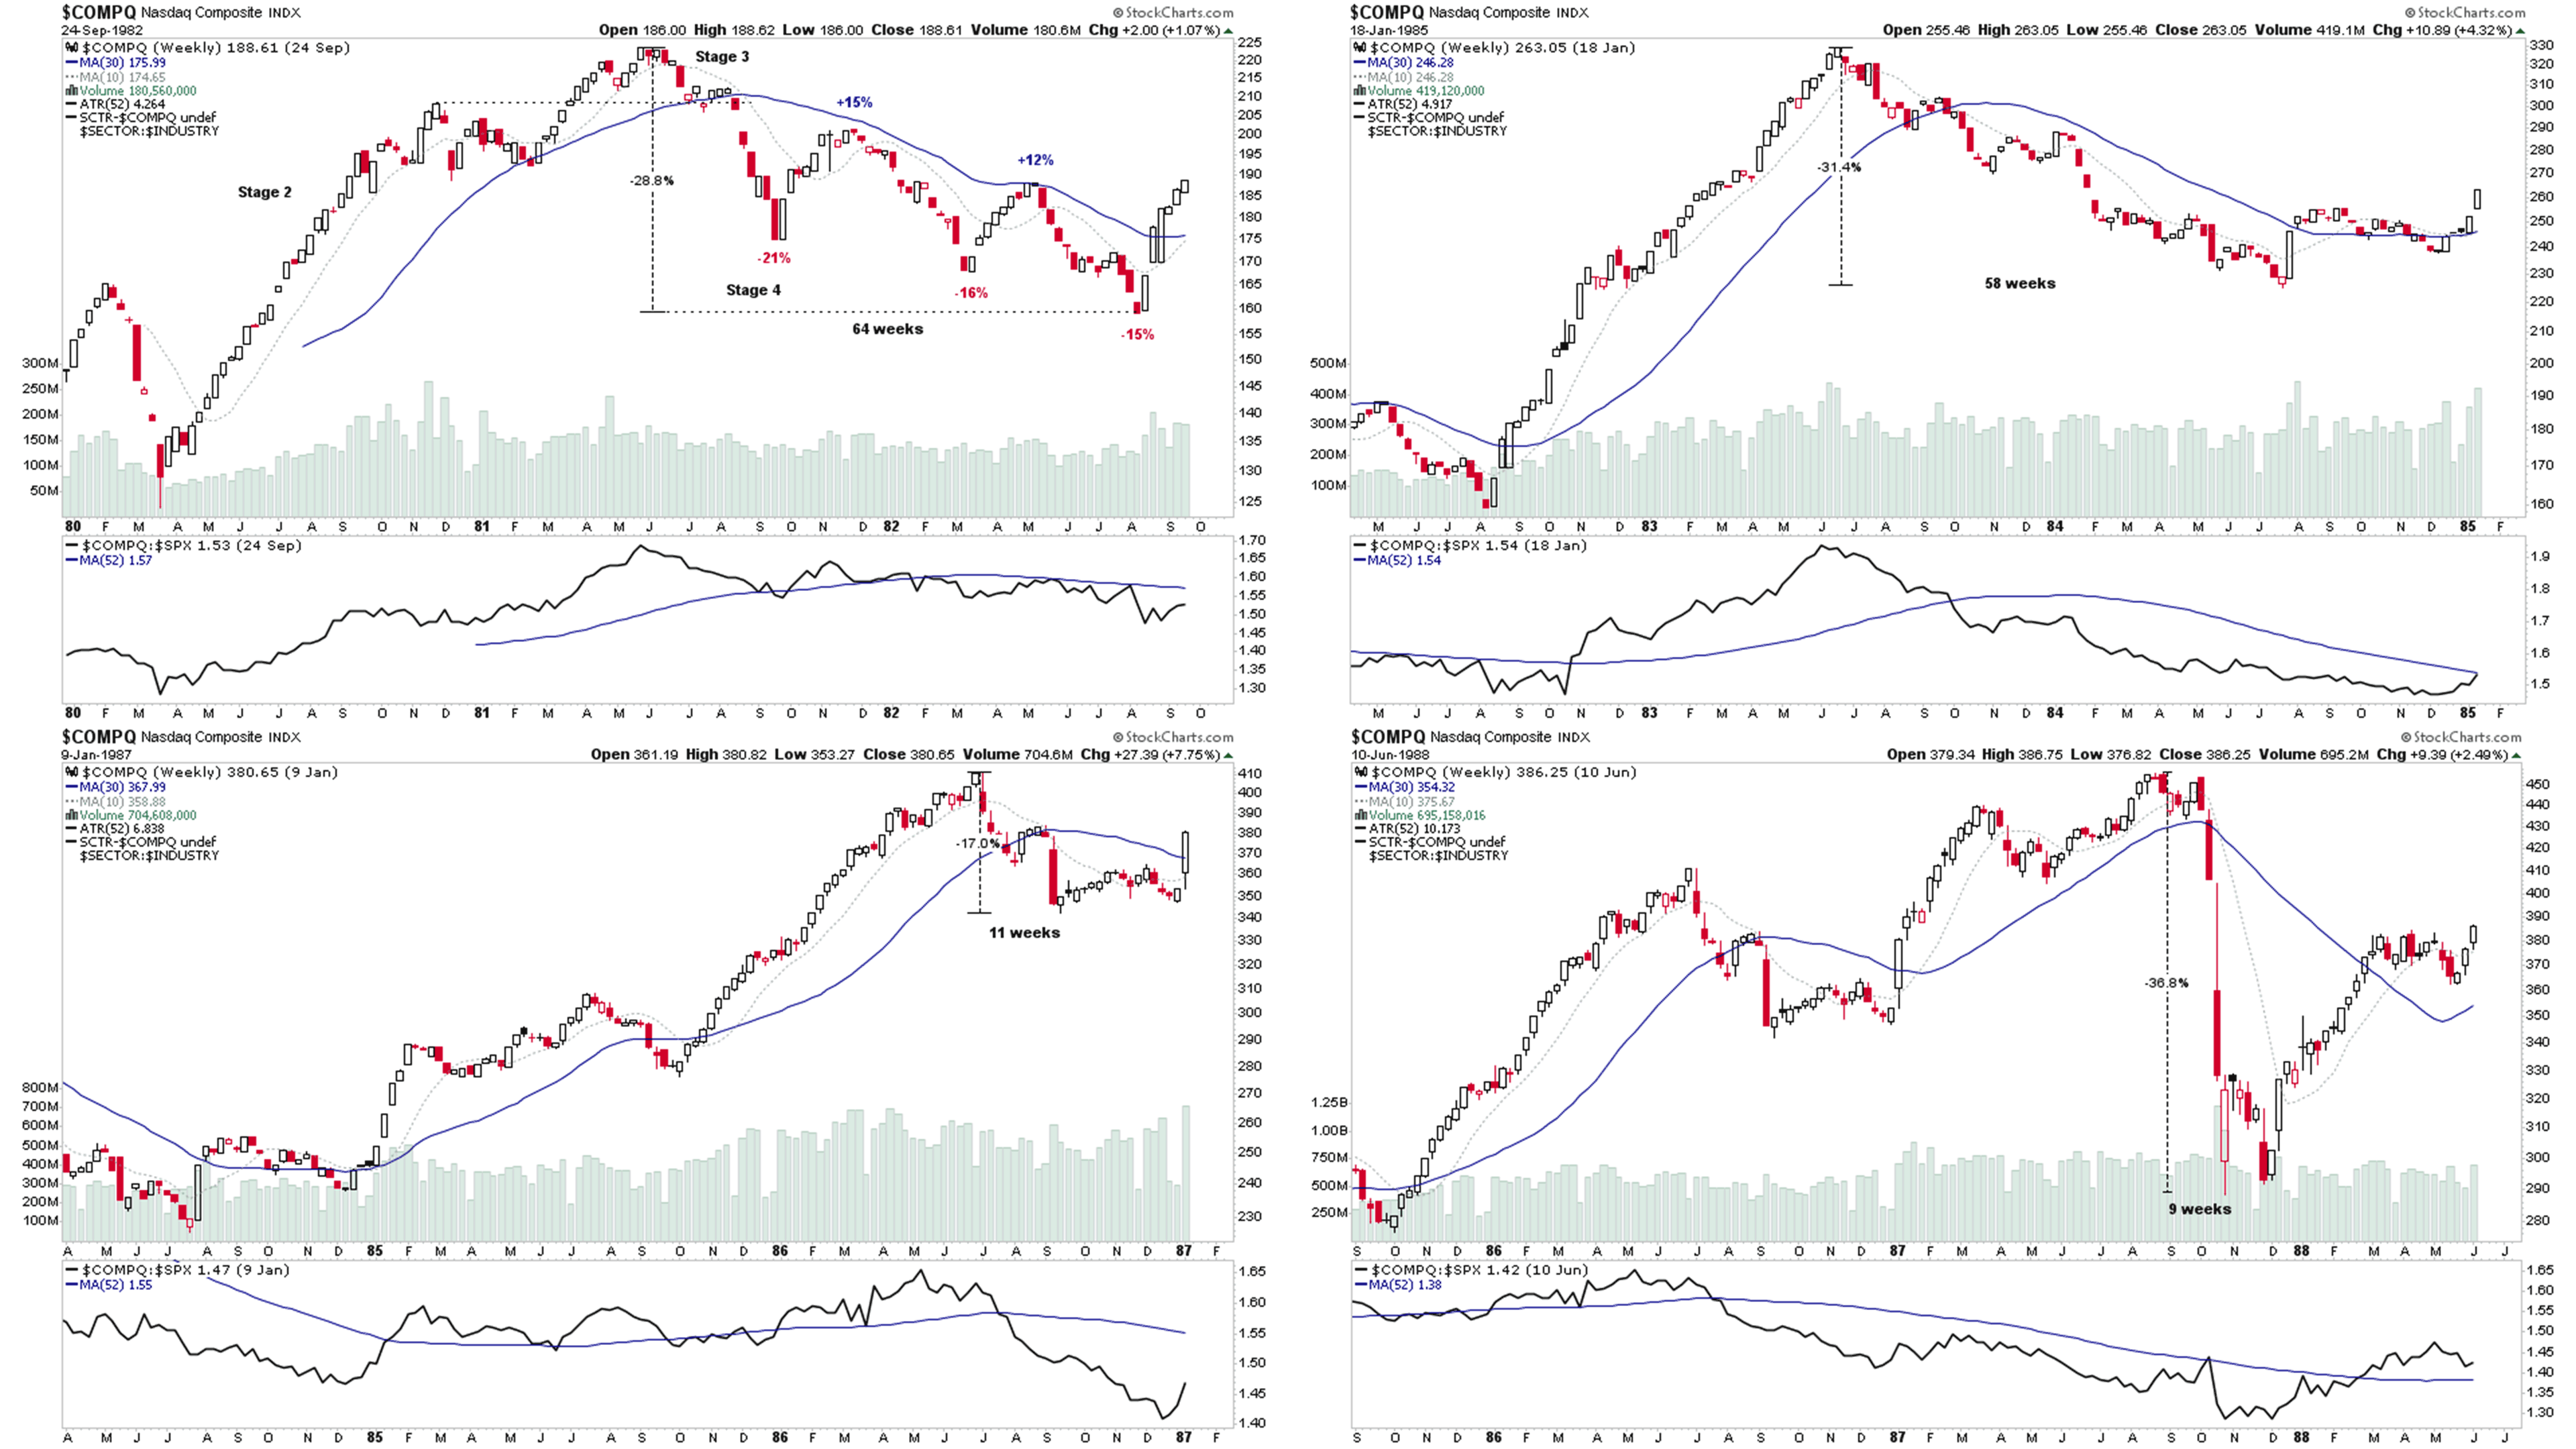
A packed schedule on todays Stage Analysis Members Midweek Video, with a brief overview of historical Stage 4 declines in the Nasdaq to start, looking at how the 15 previous significant Stage 4 declines since the early 1980s ended – capitulation or not?
Read More
12 June, 2022
Stage Analysis Members Weekend Video – 12 June 2022 (1hr 20mins)
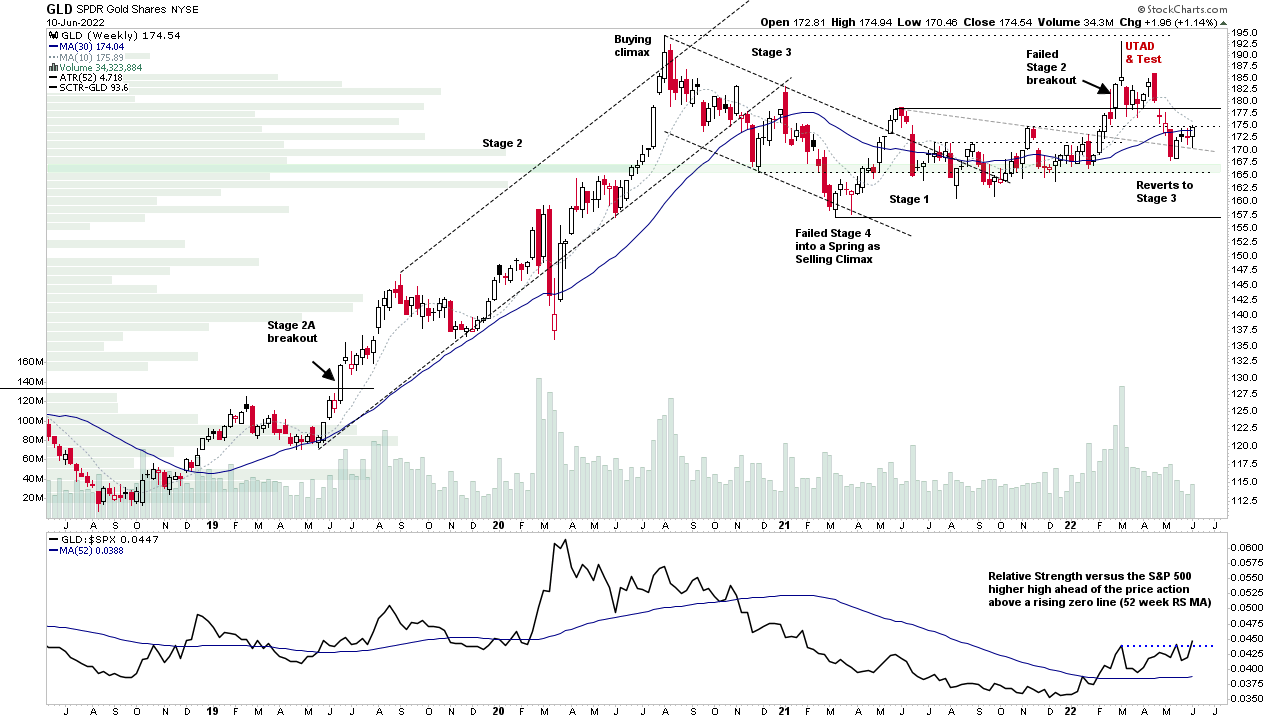
This weeks Stage Analysis Members Video features a special on the precious metals, with Stage Analysis of Gold and Silver on multiple timeframes as well and the most interesting Gold miners and Silver miners charts...
Read More
12 June, 2022
Crypto Breadth: Percentage of Crypto Coins Above Short, Medium & Long Term Moving Averages
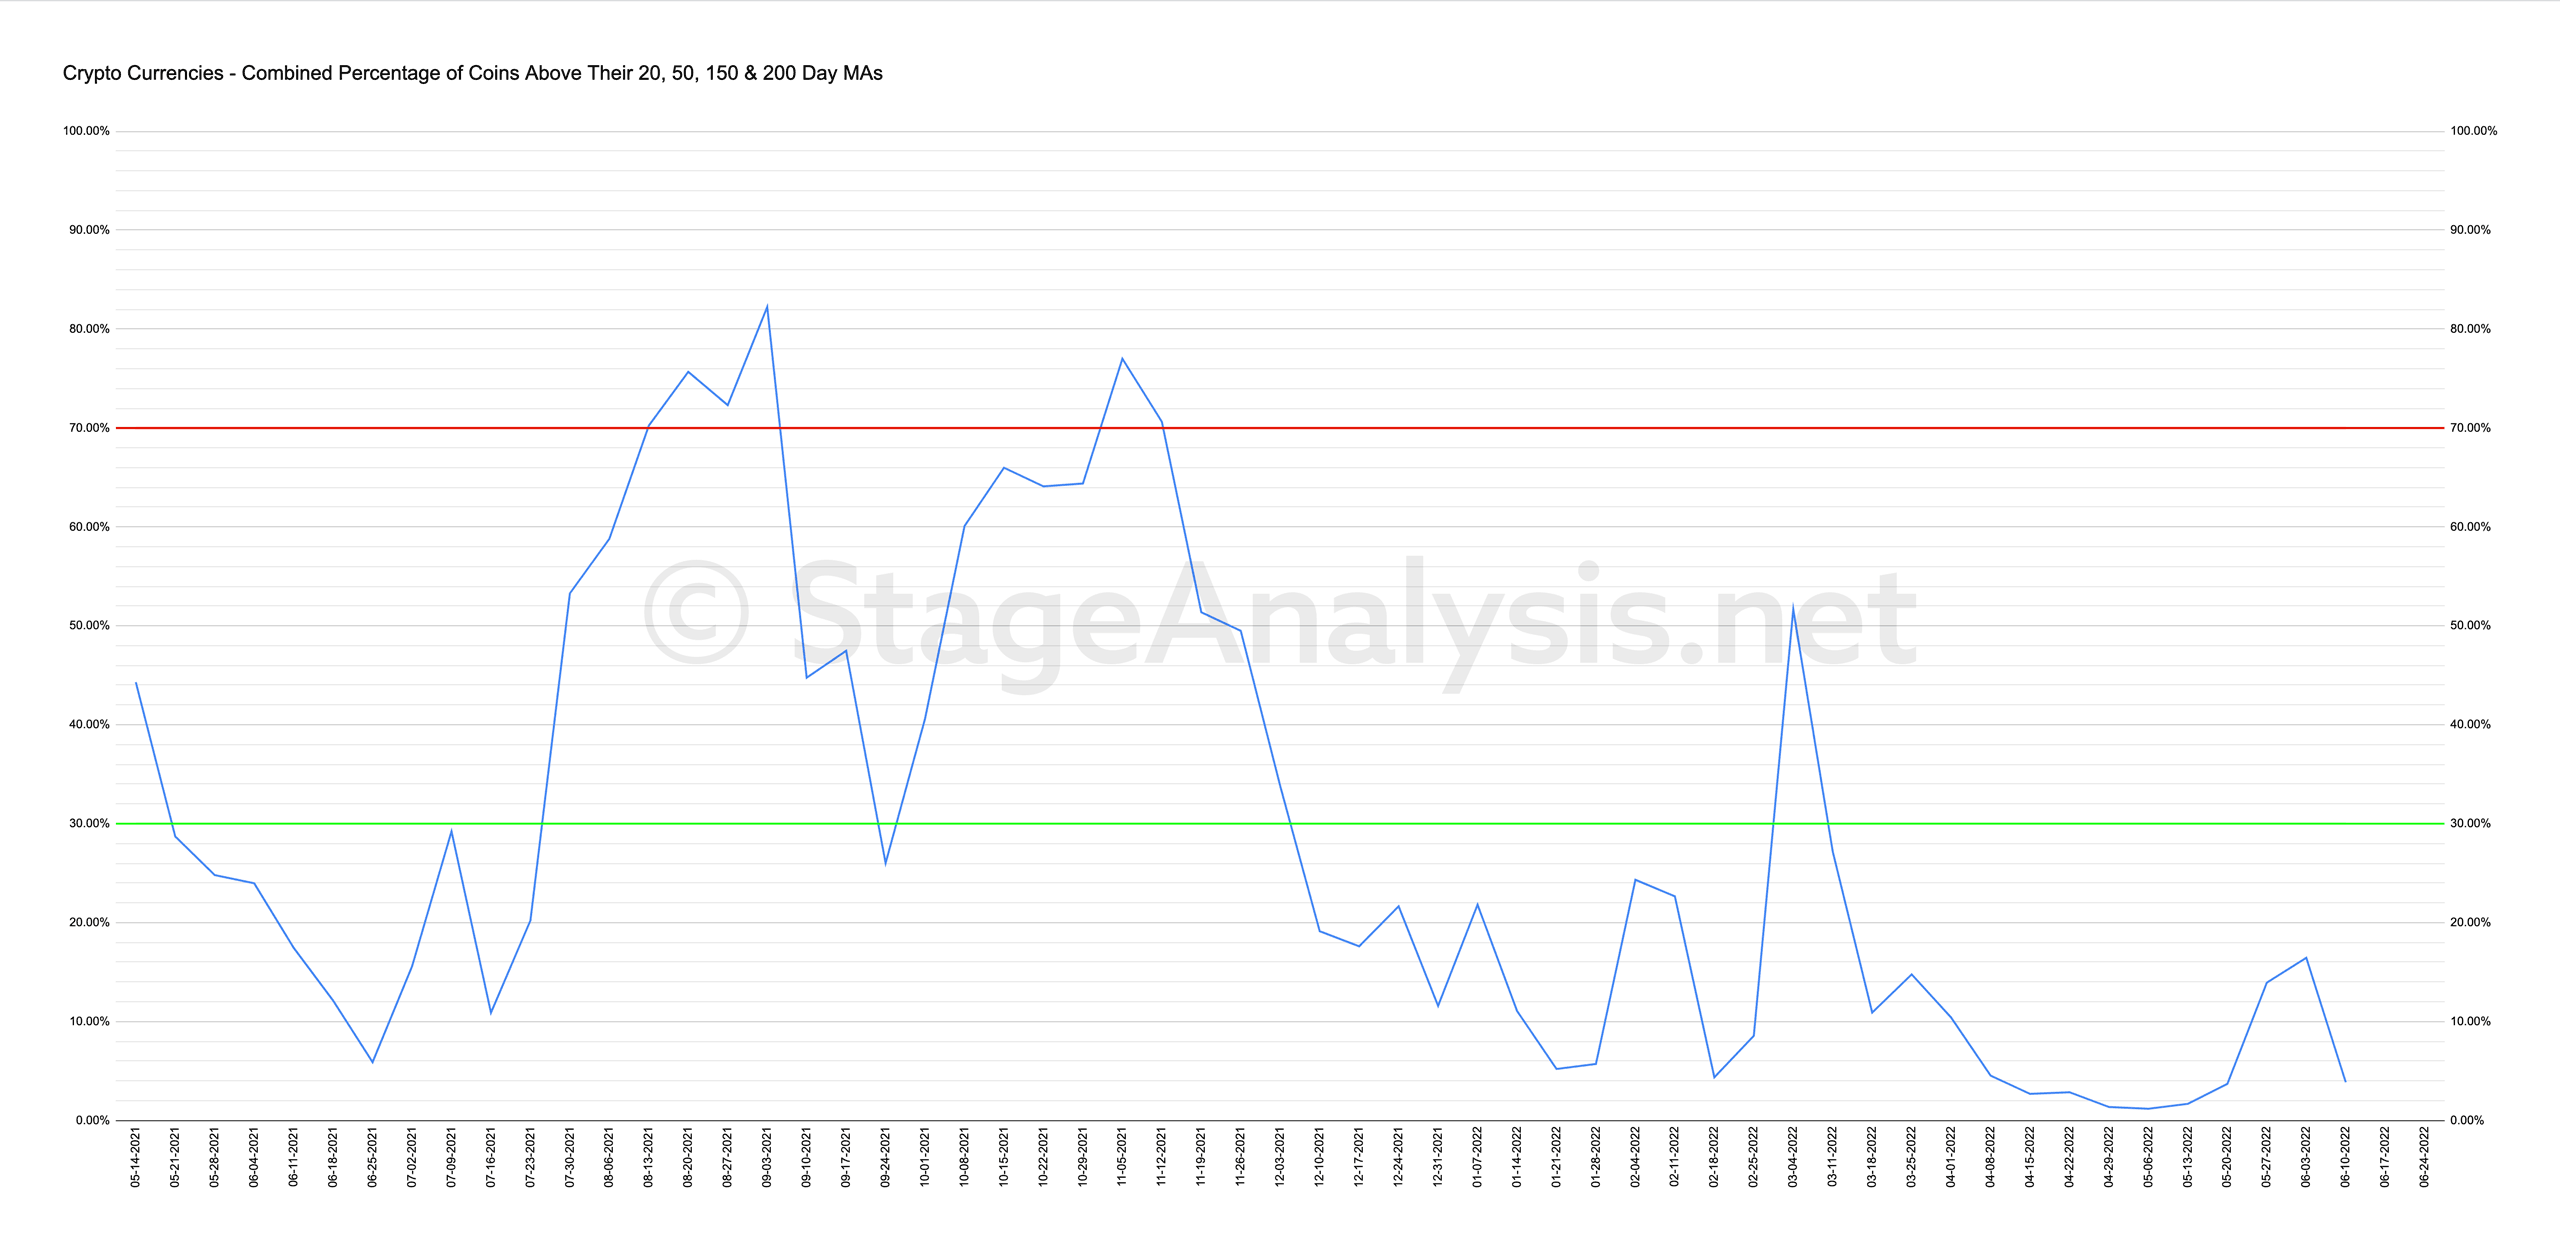
It's been a long time since I've posted the Crypto Coin breadth charts that cover the 149 crypto coins that stockcharts shows...
Read More
11 June, 2022
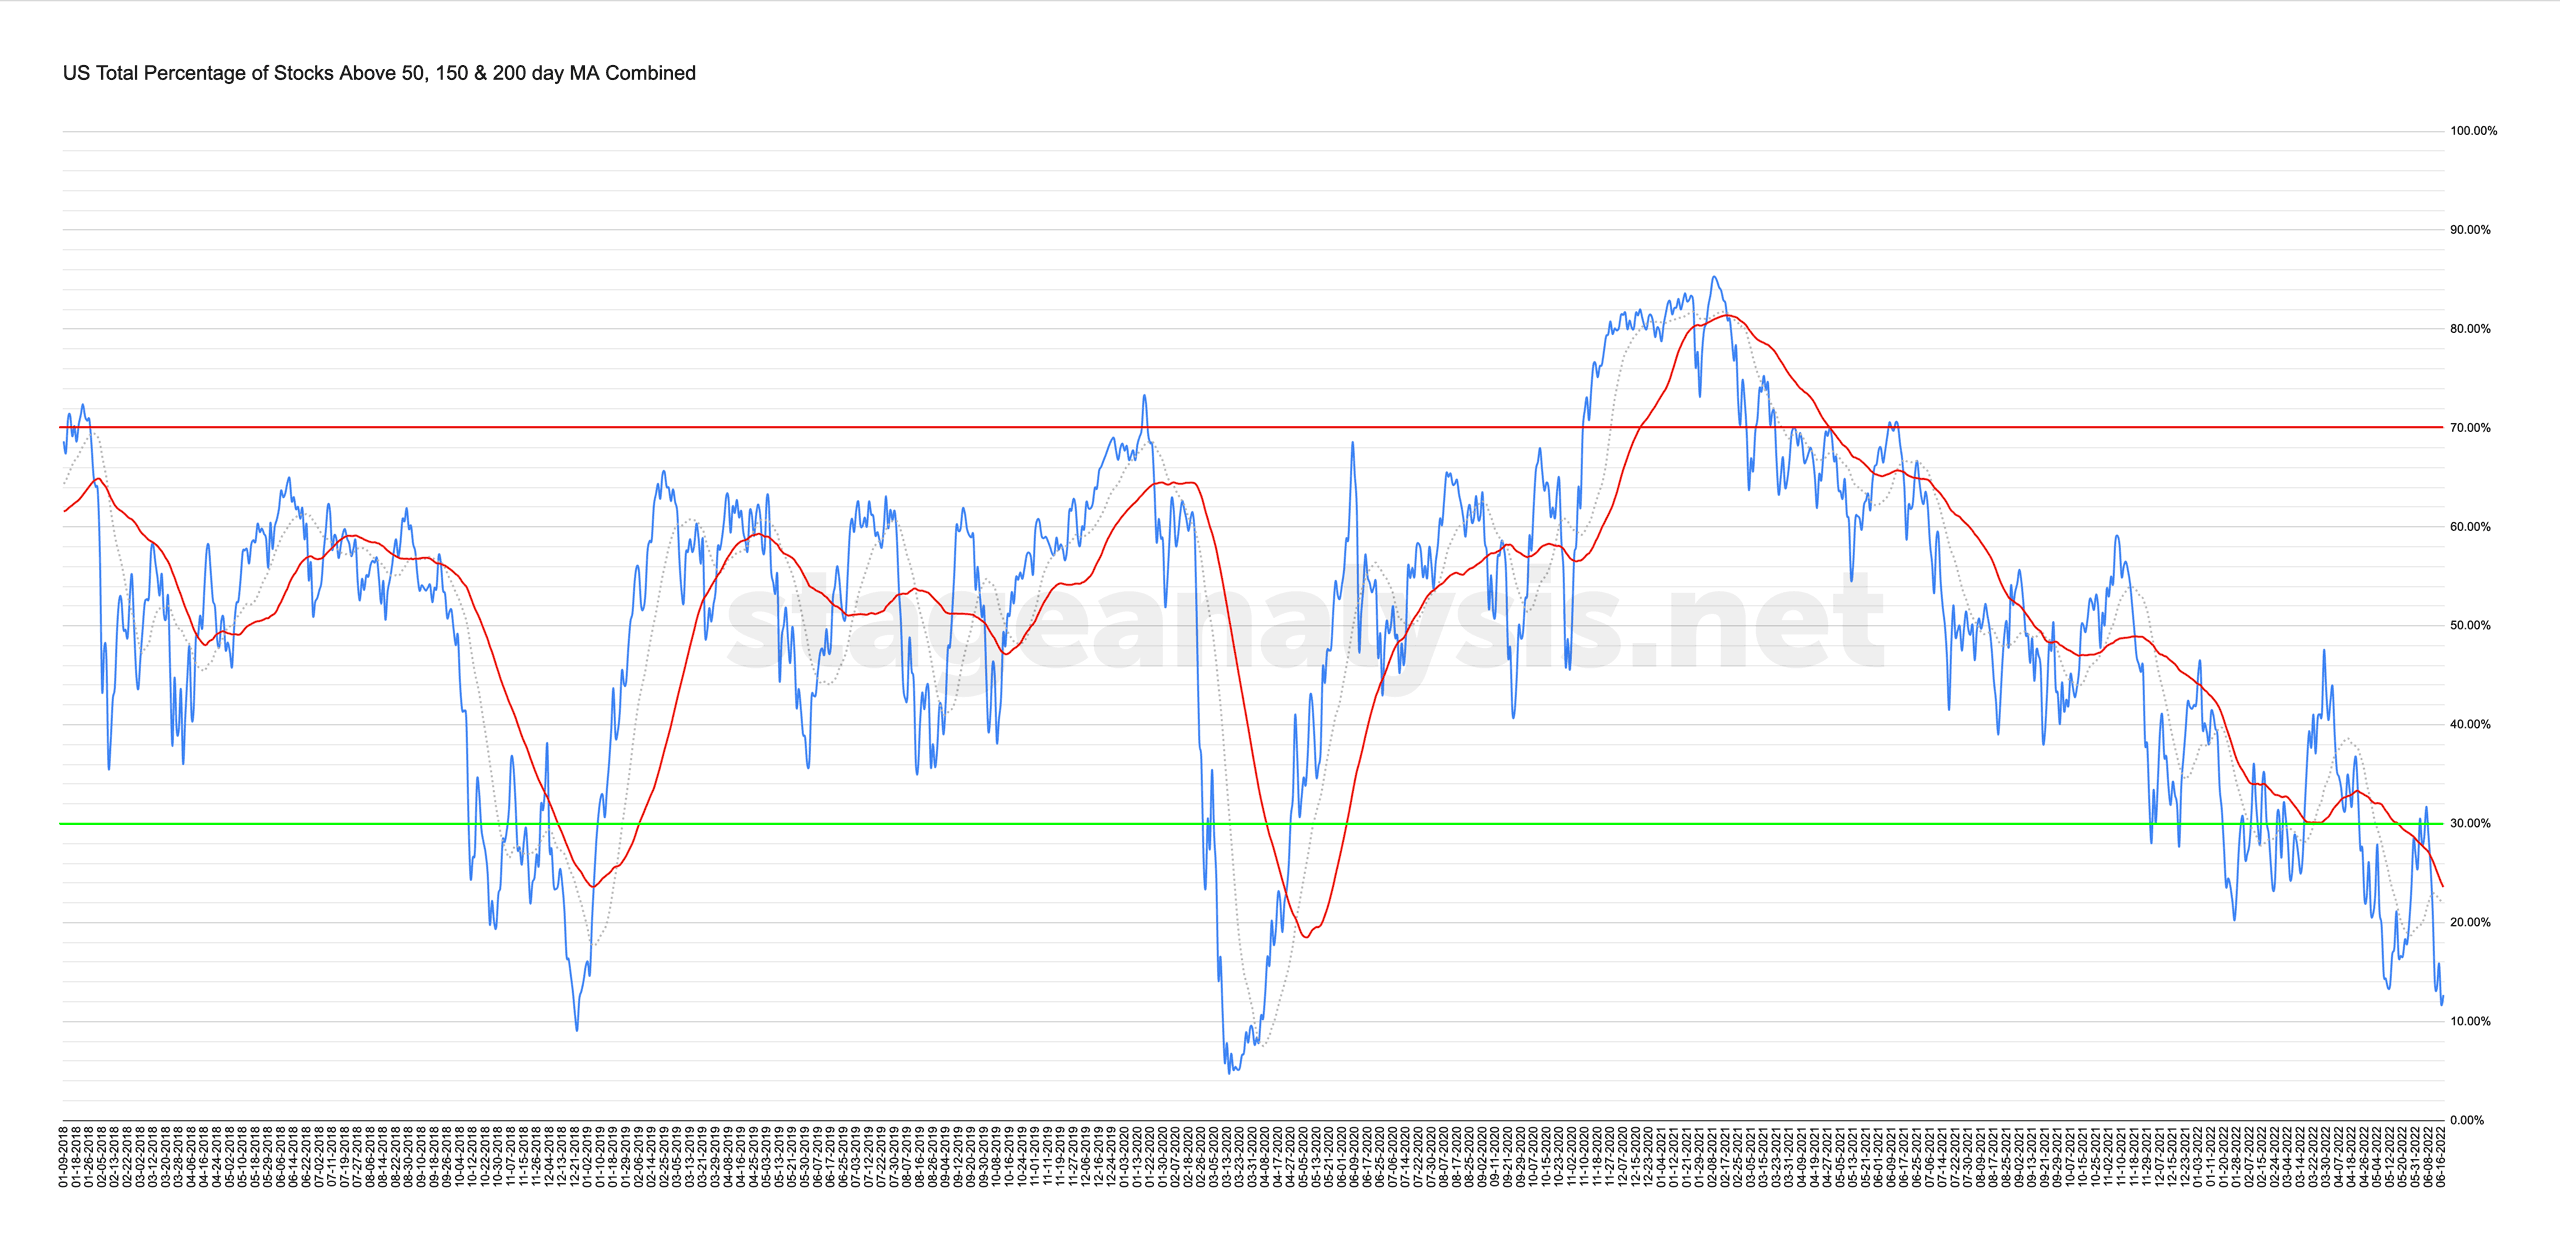
Market Breadth: Percentage of Stocks Above their 50 Day, 150 Day & 200 Day Moving Averages Combined
Custom Percentage of Stocks Above Their 50 Day, 150 Day & 200 Day Moving Averages Combined Market Breadth Charts for the Overall US Market, NYSE and Nasdaq for Market Timing and Strategy.
Read More
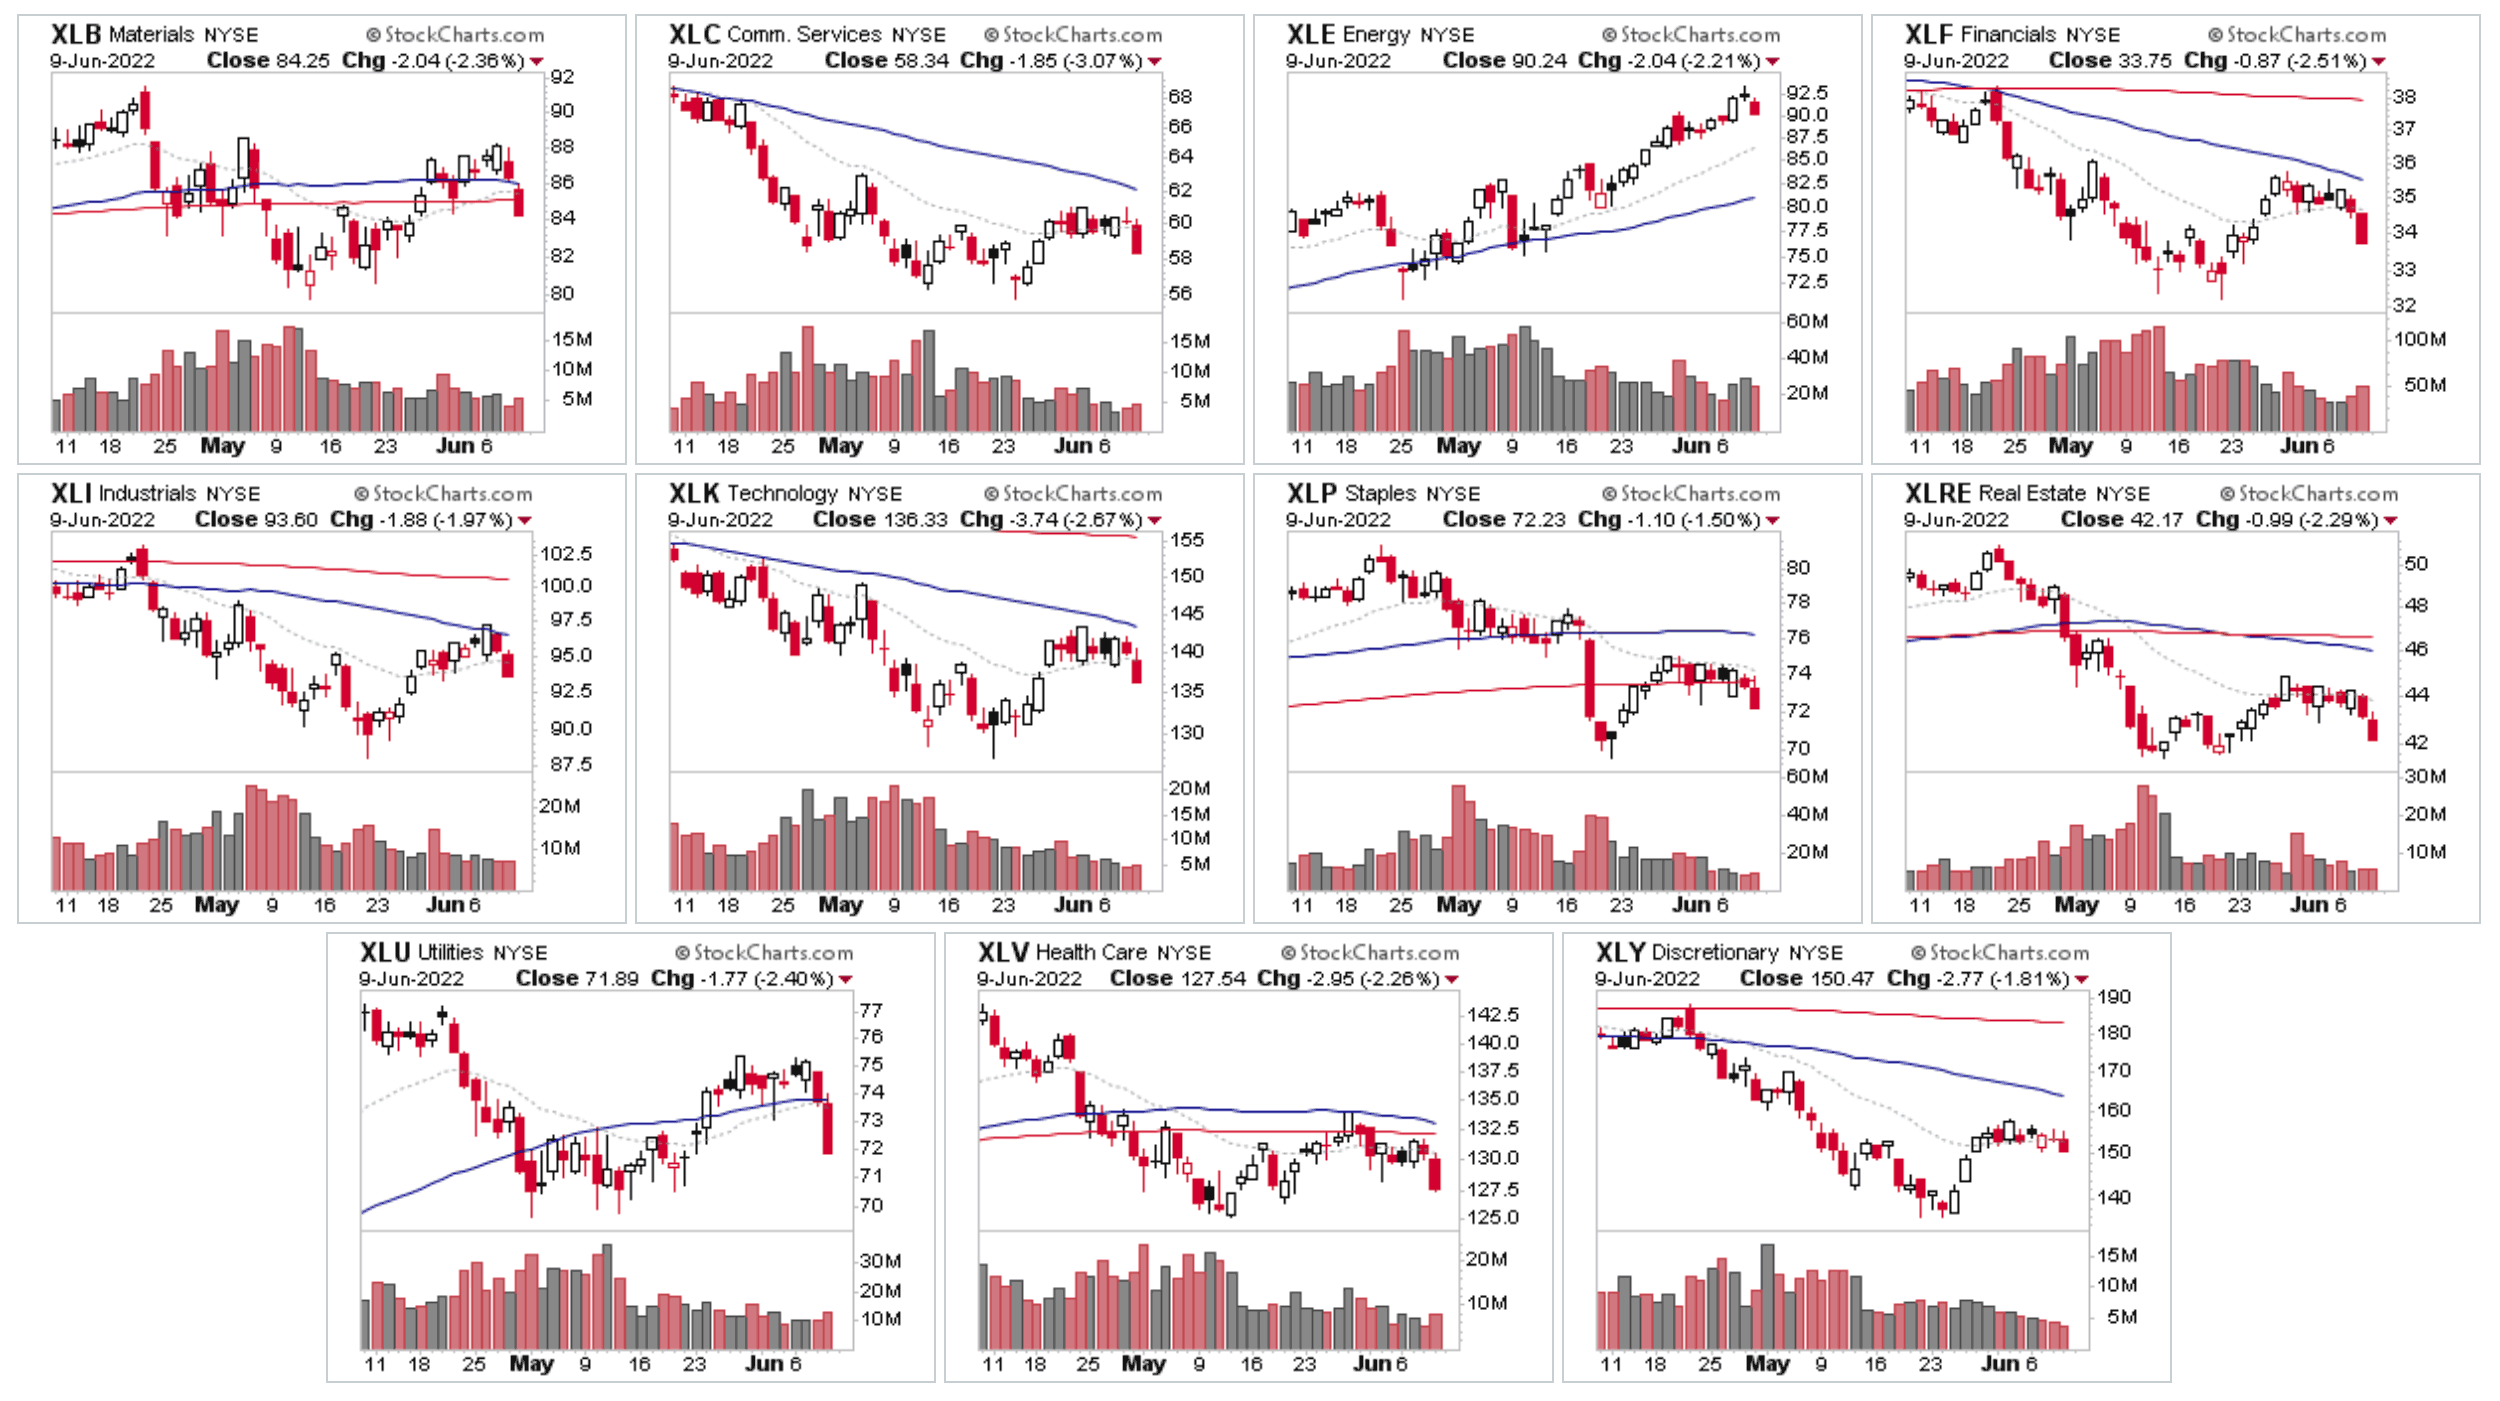
09 June, 2022
Stage 4 Trend Reasserts Itself – 10 June 2022
Broad based selling today with stocks accelerating to the downside in the afternoon session after initially attempting to hold up during the morning, and if you zoom into the intraday 2 hour chart...
Read More
08 June, 2022
Stage Analysis Members Midweek Video – Searching for Stage 1 Bases in the Software Group – 8 June 2022 (1hr)
This weeks Stage Analysis Members midweek video features a special on the searching for Stage 1 Bases in the Software Group, as numerous software stocks have been appearing in the watchlist scans over the last month or so and exhibiting a change of behaviour...
Read More