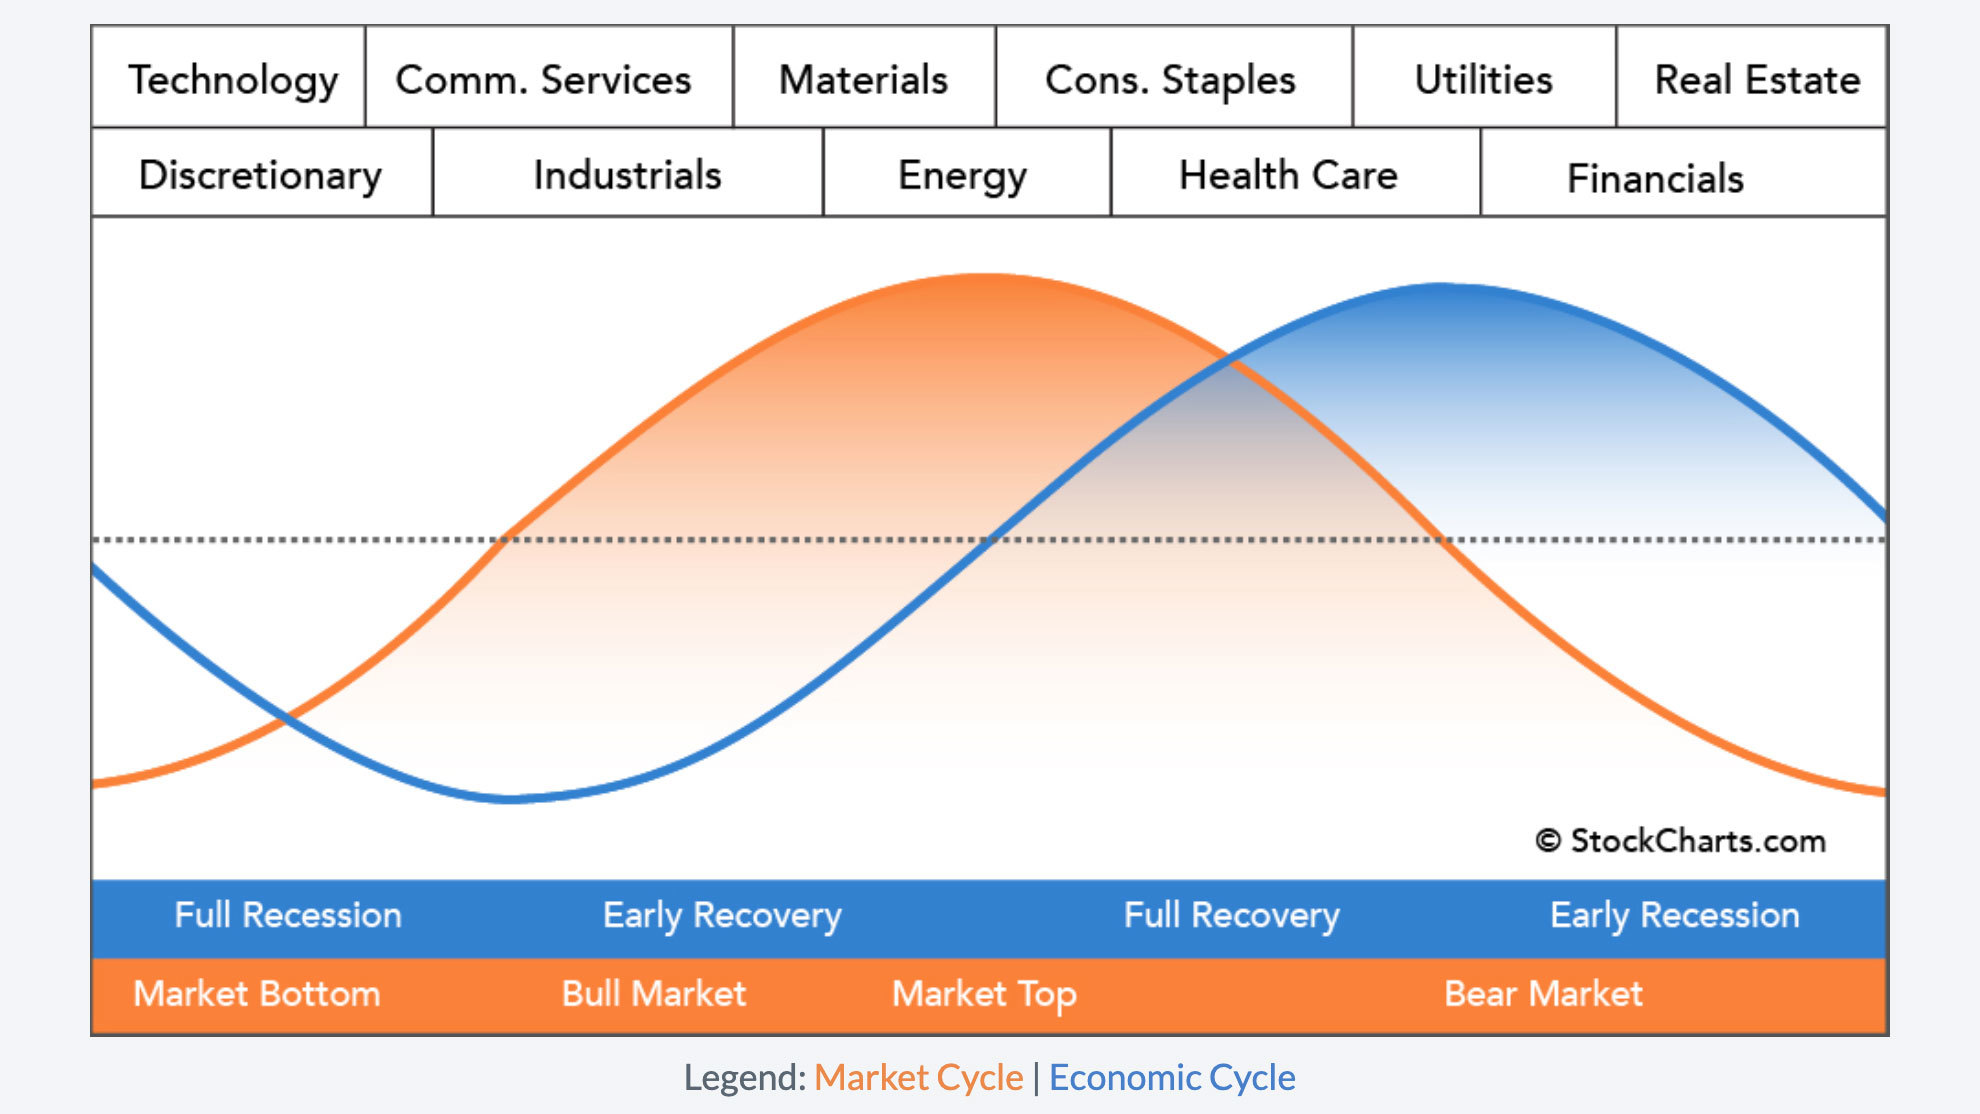
Tonights Stage Analysis Members midweek video begins with a look at the Sector Rotation Model that suggests the sectors that tend to lead the market at the different points in the market cycle and economic cycle. Followed by a brief chat of the recent article on the Top 5 Books To Learn the Wyckoff Method, before discussing the Major Index charts...
Read More

Blog
17 July, 2022
Stage Analysis Members Weekend Video – 17 July 2022 (1hr 30mins)
The Stage Analysis Members weekend video starts with a look at US Stocks Industry Groups Relative Strength Rankings and some of the groups on the move and stocks from those groups. Then in the members only content first a review of the Major Indexes – S&P 500, Nasdaq, Russell 2000 as well as chart analysis of Oil, Copper, Treasuries, Gold and the VIX...
Read More

16 July, 2022
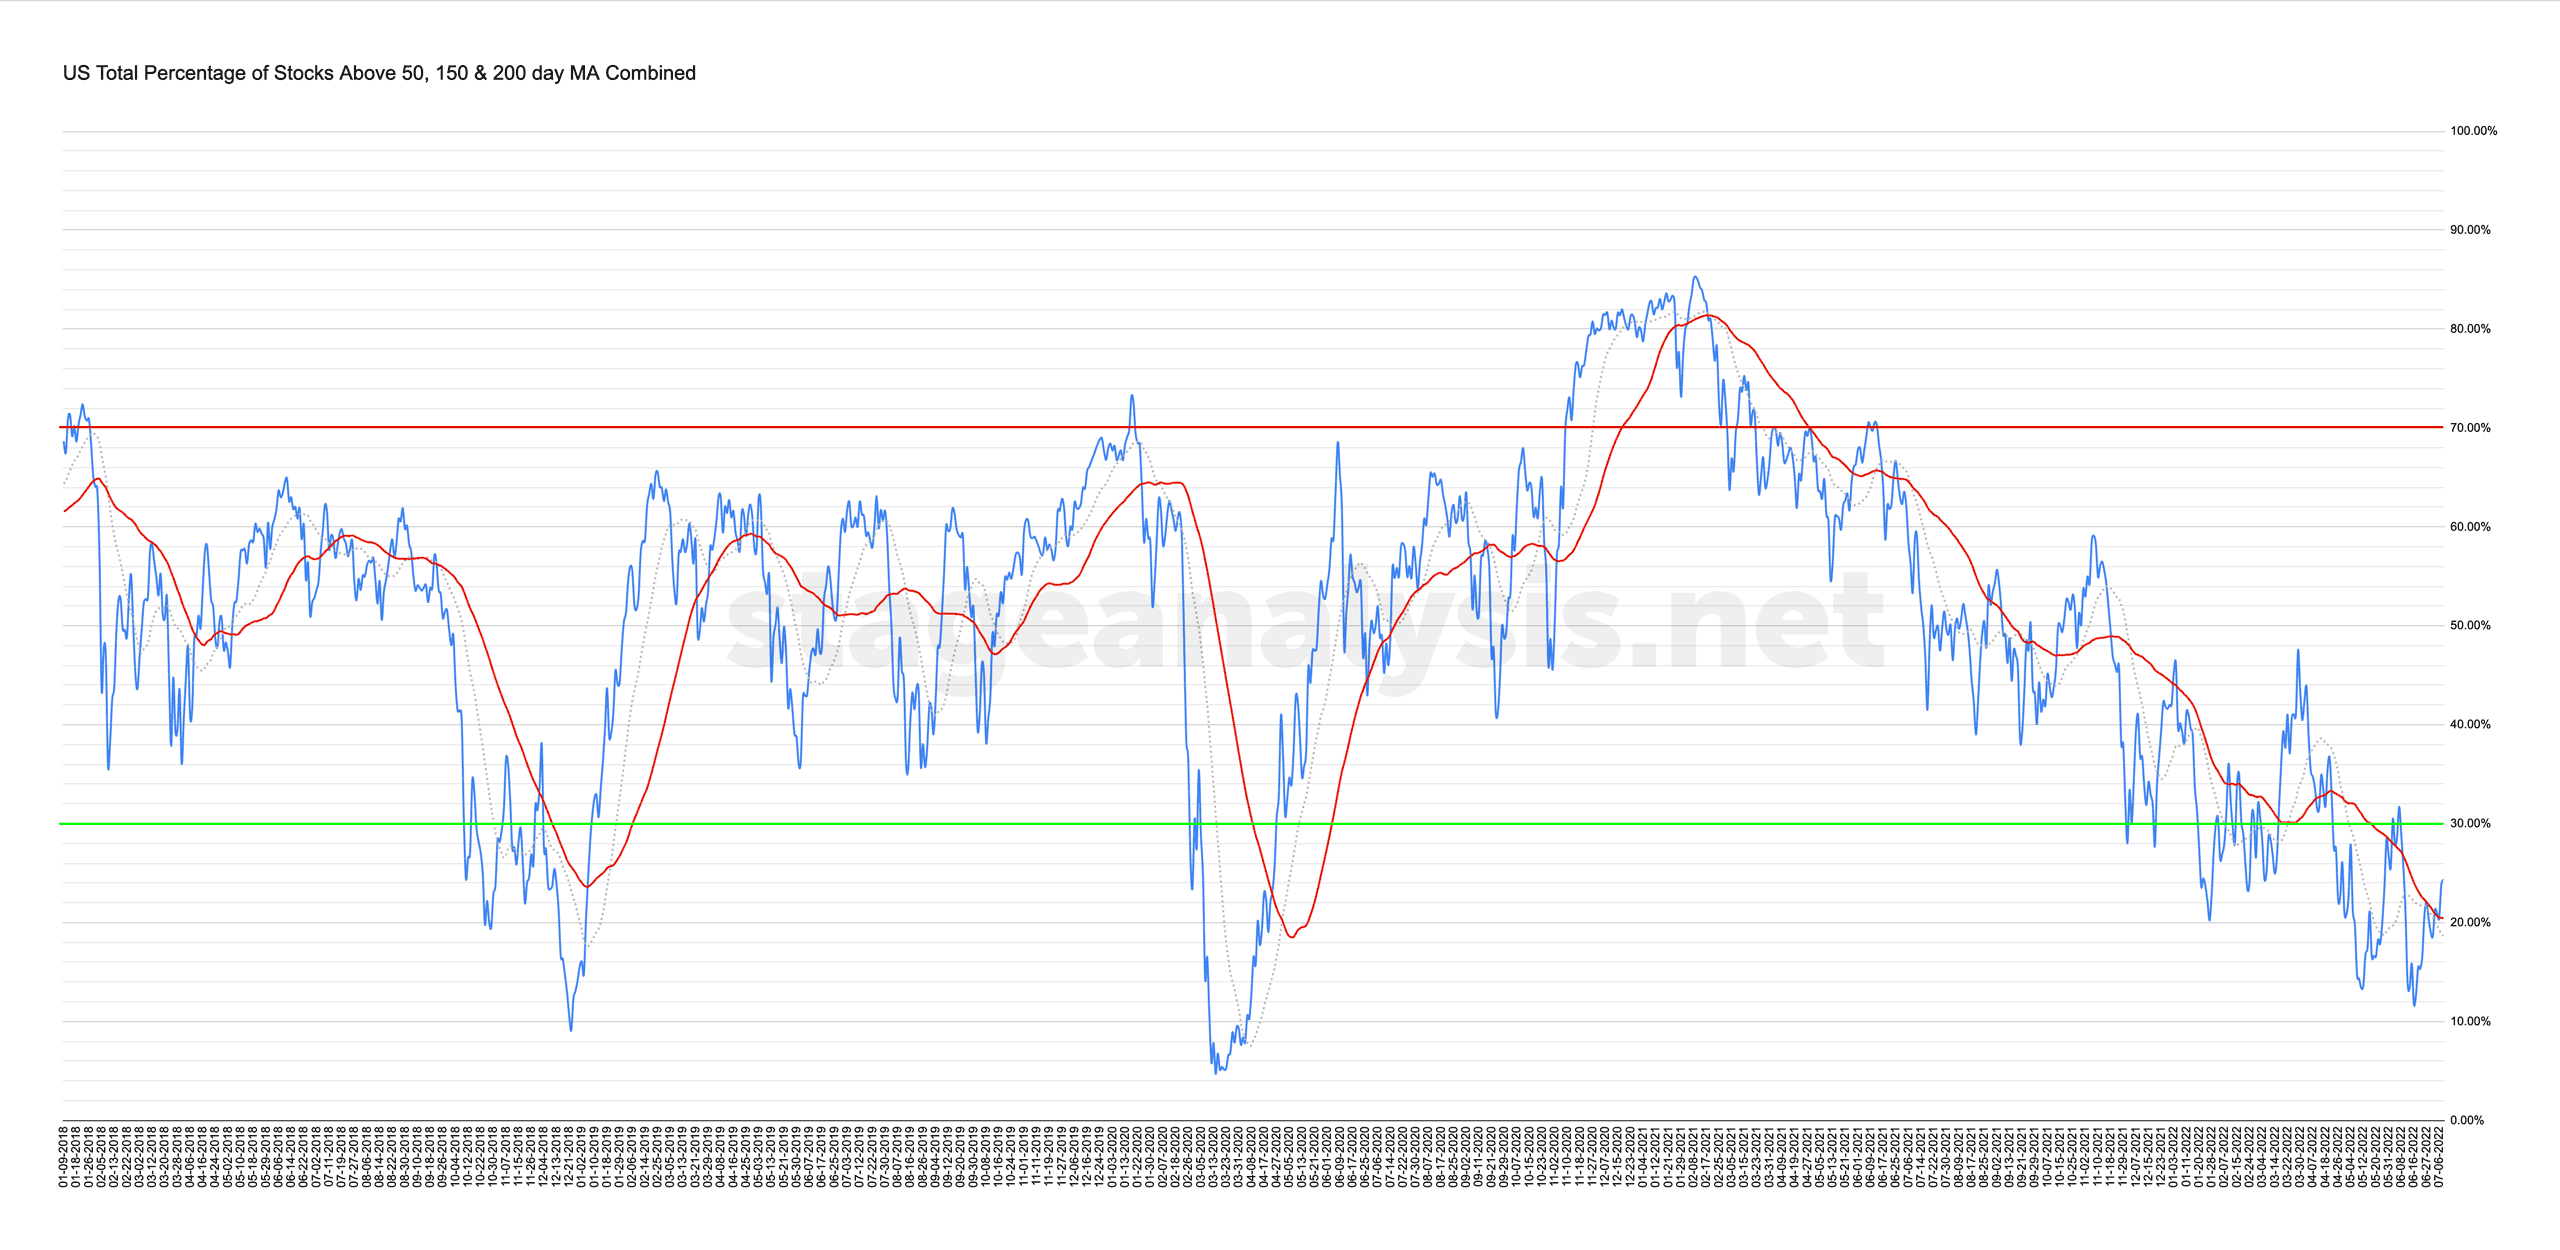
Market Breadth: Percentage of Stocks Above their 50 Day, 150 Day & 200 Day Moving Averages Combined
Custom Percentage of Stocks Above Their 50 Day, 150 Day & 200 Day Moving Averages Combined Market Breadth Charts for the Overall US Market, NYSE and Nasdaq for Market Timing and Strategy.
Read More
14 July, 2022
Stage Analysis Members Midweek Video – 13 July 2022 (1hr 5mins)
The Stage Analysis members midweek video begins this week with a further discussion on How Stocks Transition From the Stage 4 Declining Phase to the Stage 1 Basing Phase using an early Stage 1 example from the Global Trend Alert to help to explain some of the characteristics to look for...
Read More
10 July, 2022
Stage Analysis Members Weekend Video – 10 July 2022 (1hr 39mins)
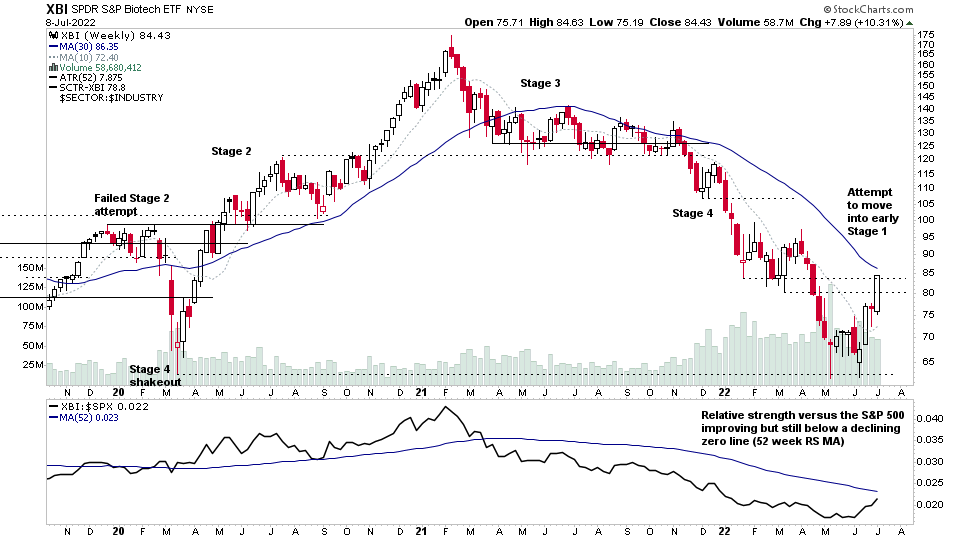
In this weeks Stage Analysis Members video we look at the in-focus group – Biotechnology, which has been showing a lot of relative strength in the short term as it attempts to rebound from a deep Stage 4 decline back into potential Stage 1, and look at a few of the strongest stocks from the group...
Read More
09 July, 2022
Market Breadth: Percentage of Stocks Above their 50 Day, 150 Day & 200 Day Moving Averages Combined
Custom Percentage of Stocks Above Their 50 Day, 150 Day & 200 Day Moving Averages Combined Market Breadth Charts for the Overall US Market, NYSE and Nasdaq for Market Timing and Strategy.
Read More
07 July, 2022
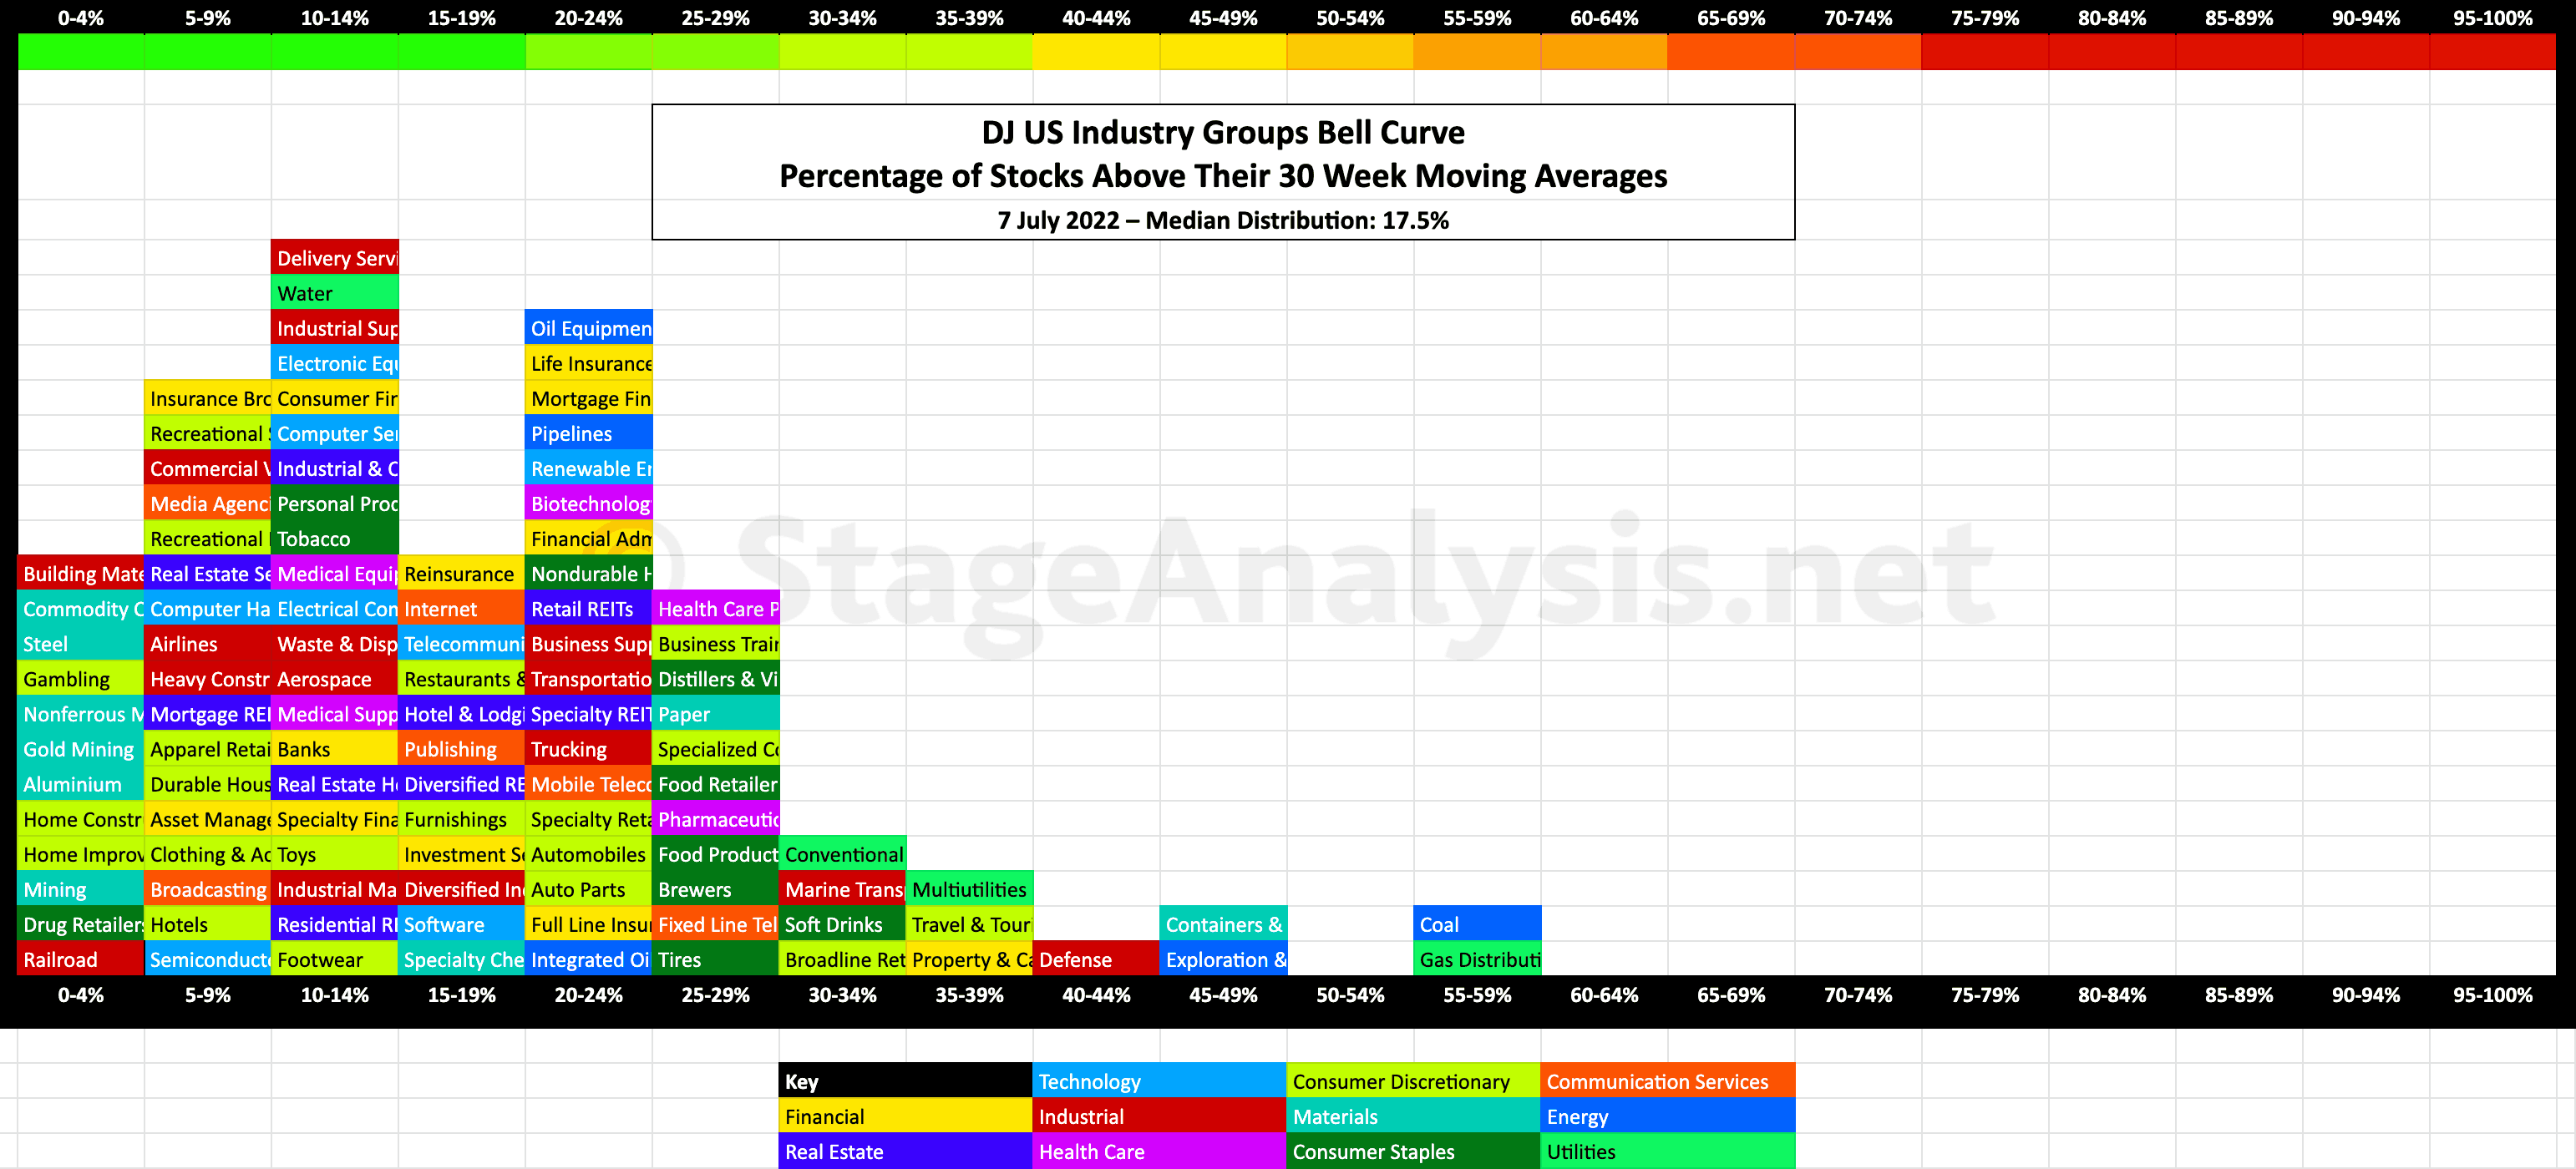
US Industry Groups Bell Curve – Exclusive to Stage Analysis
Exclusive graphic of the 104 Dow Jones Industry Groups showing the Percentage of Stocks Above 30 week MA in each group visualised as a Bell Curve chart – inspired by the Sector Bell Curve work by Tom Dorsey in his Point & Figure book....
Read More
06 July, 2022
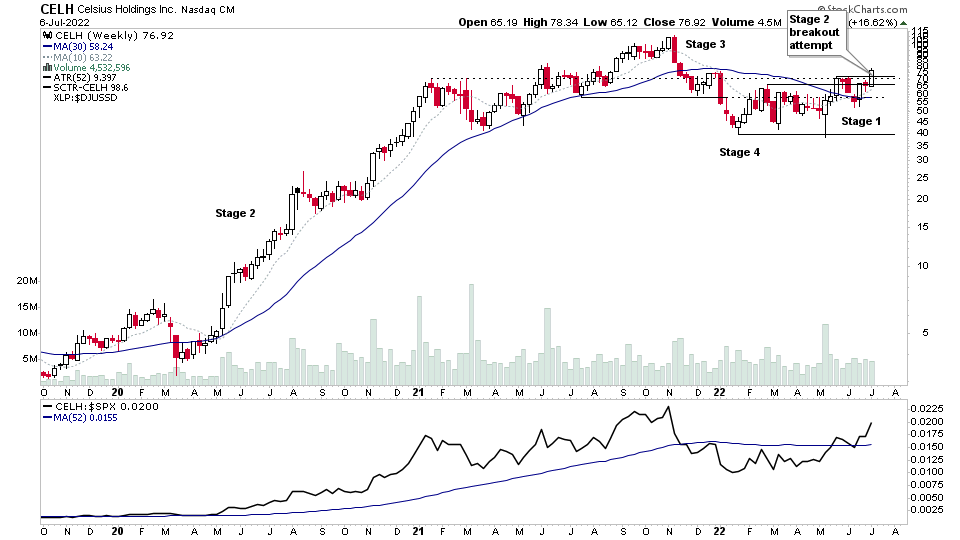
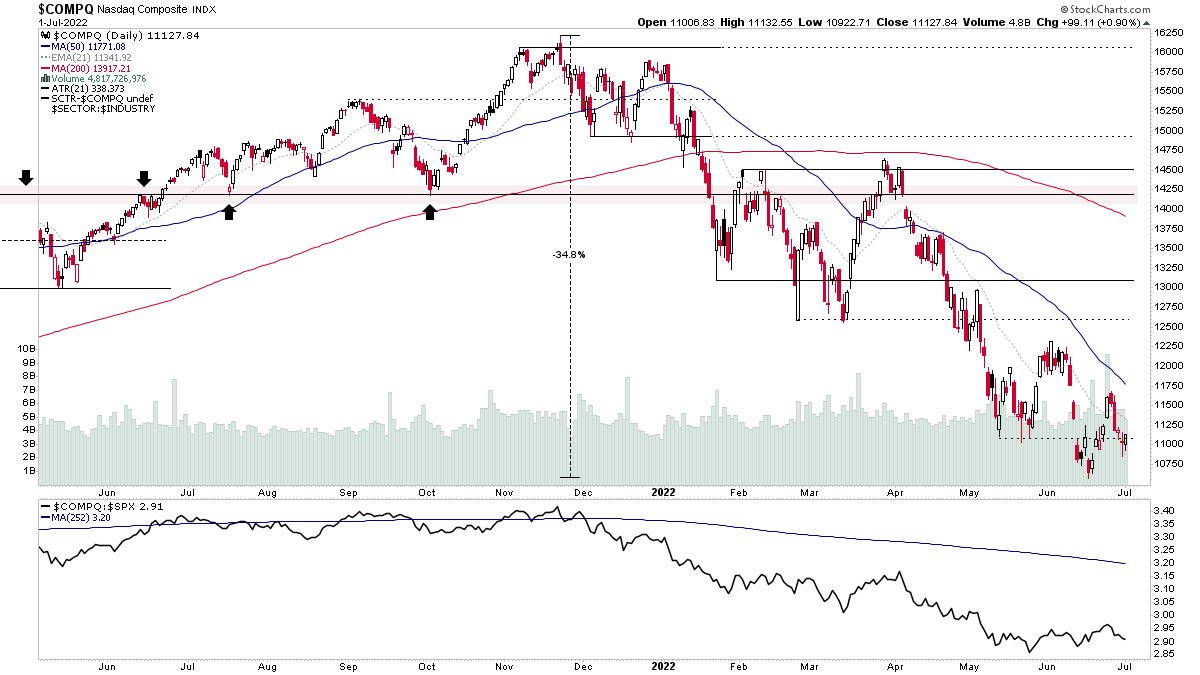
Stage Analysis Members Midweek Video – 6 July 2022 (1hr 21mins)
Midweek video covering the Stage 2 breakout attempt in CELH. Plus an In Focus segment on the Biotech (XBI) and Chinese (FXI) ETFs. Followed by the Major Indexes Update – S&P 500, Nasdaq Composite and Russell 2000, and short term Market Breadth charts, and then an in-depth run through of the recent US Watchlist Stocks...
Read More
03 July, 2022
Stage Analysis Members Weekend Video – 3 July 2022 (1hr 20mins)
The Stage Analysis Members Weekend Video this week covers the Major Indexes with analysis of S&P 500, Nasdaq, Russell 2000, as well as Oil, Copper, US 7-10 Year Treasuries & Gold...
Read More
02 July, 2022
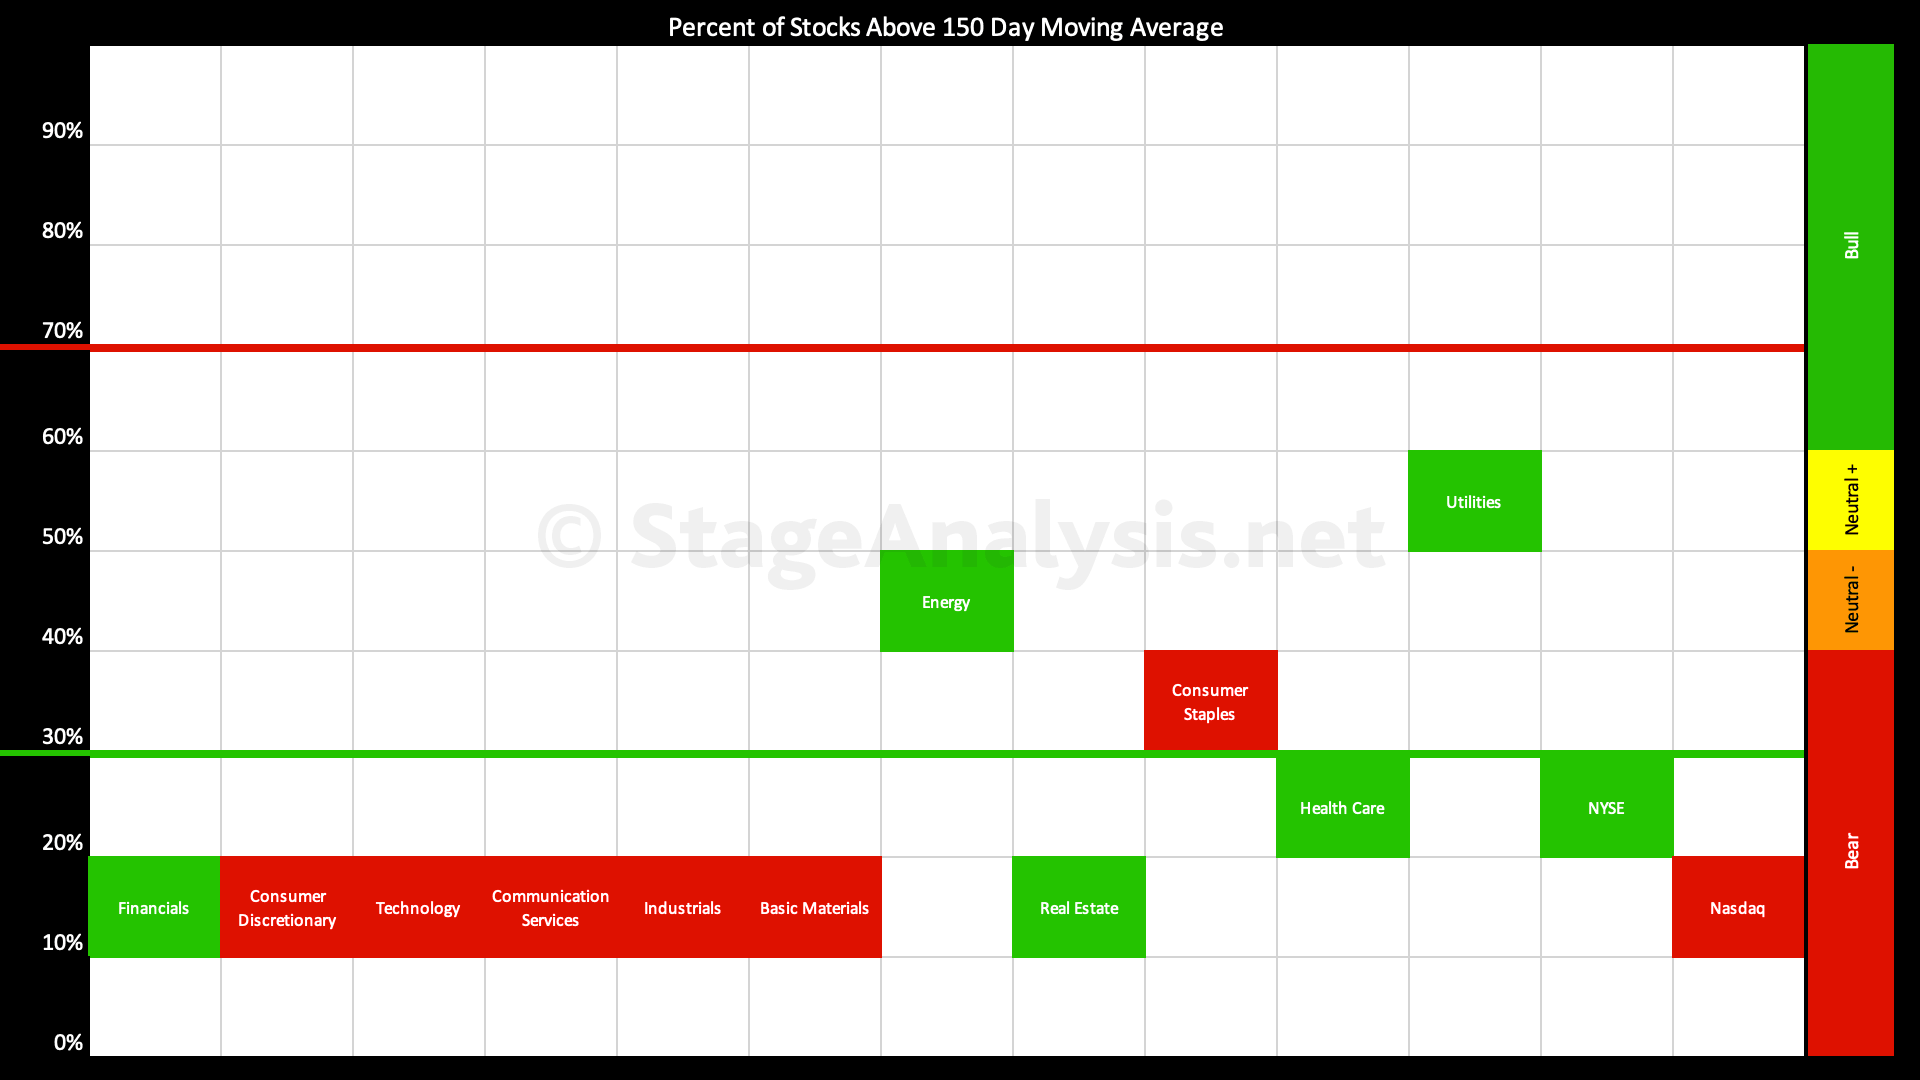
Sector Breadth: Percentage of US Stocks Above Their 150 day (30 Week) Moving Averages
The Sector breadth table has deteriorated further through June as it currently sits at 22.95%, but it did get down to a new 2022 low of 15.78% on the 17th June. So it has improved by +7.17% over the last two weeks...
Read More