The (delayed) members weekend video discussing the market, industry groups, market breadth and individual stocks from the watchlist in more detail.
Read More

Blog
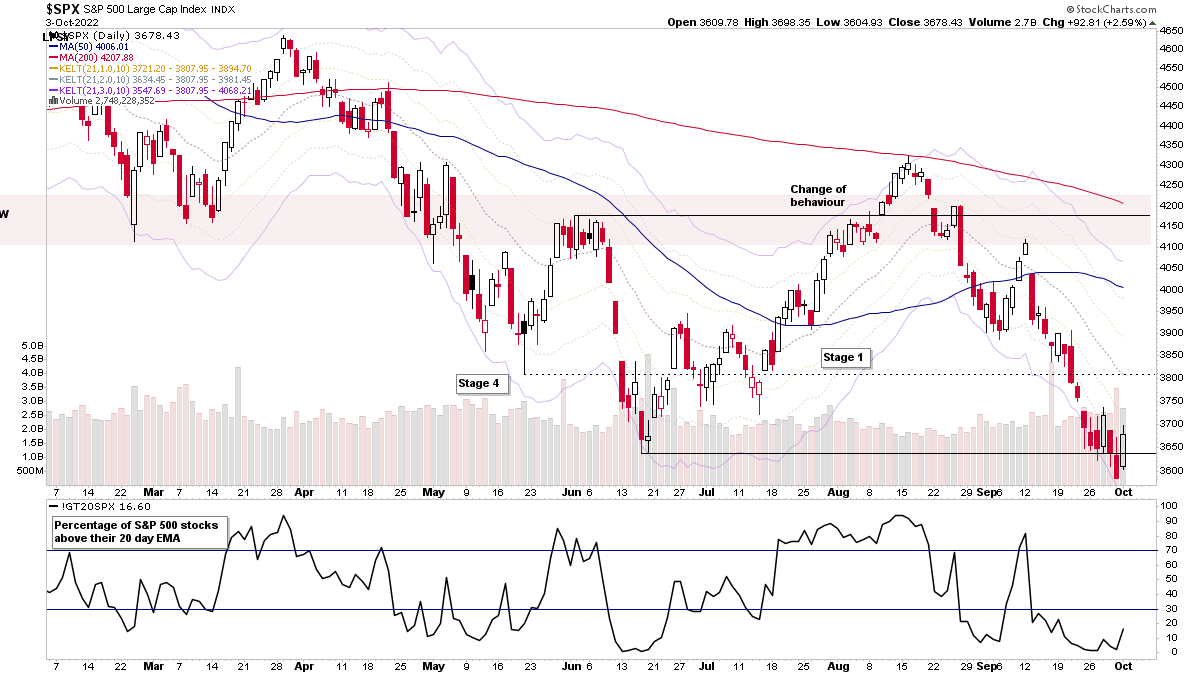
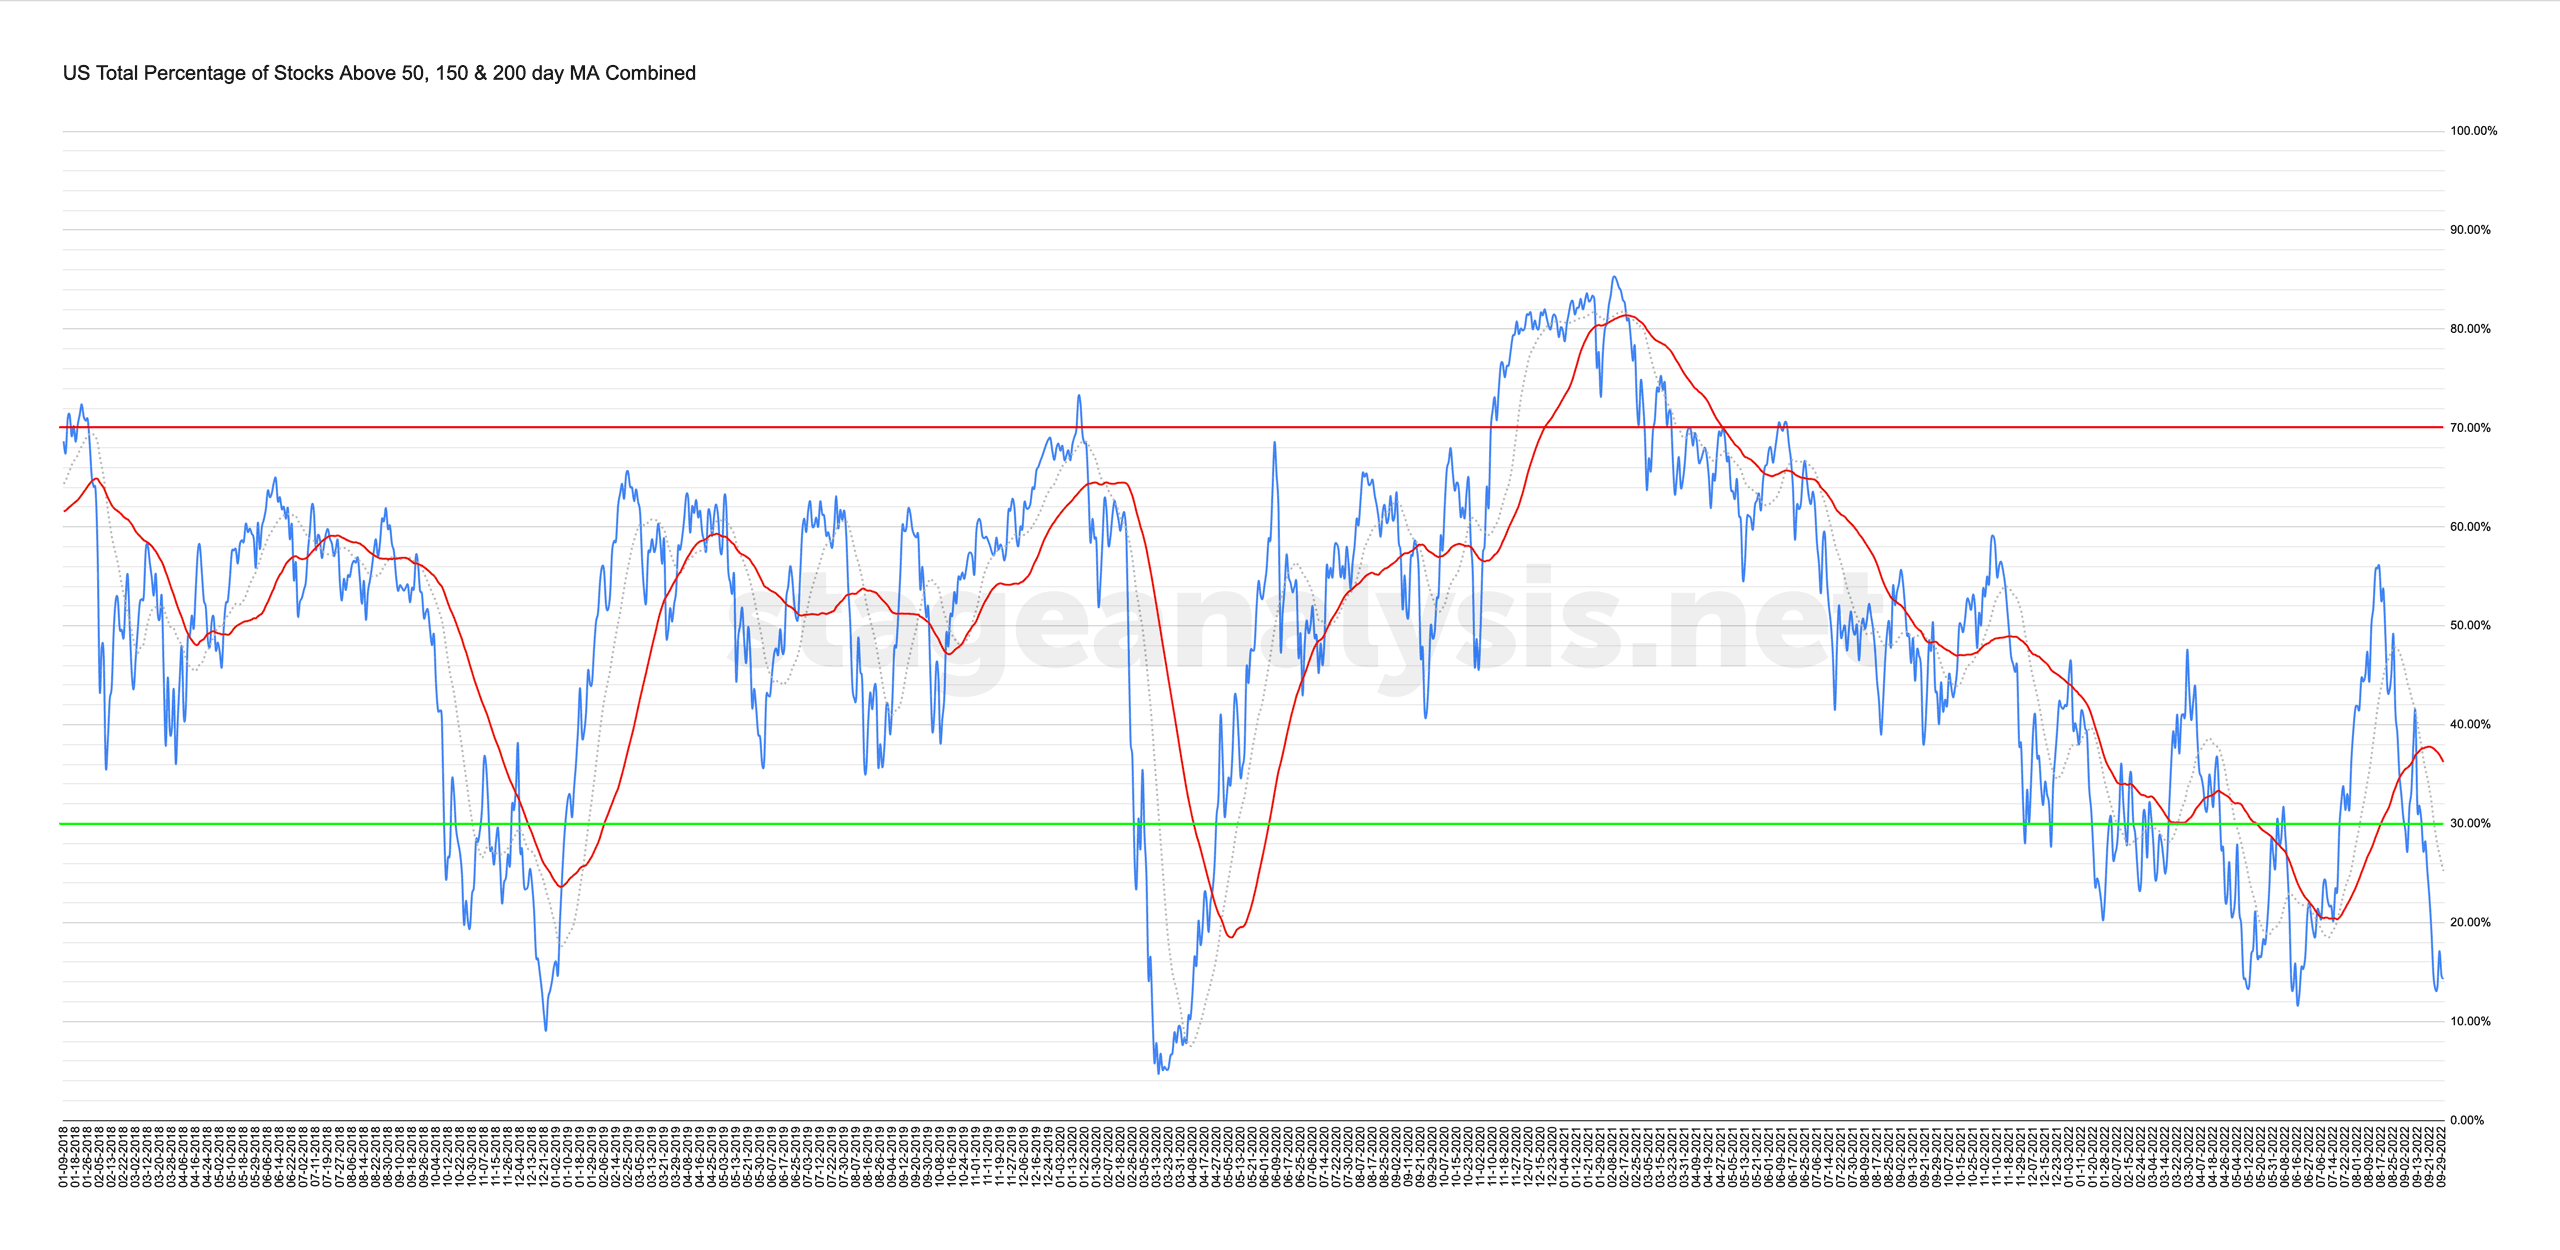
02 October, 2022
Market Breadth: Percentage of Stocks Above their 50 Day, 150 Day & 200 Day Moving Averages Combined
Custom Percentage of Stocks Above Their 50 Day, 150 Day & 200 Day Moving Averages Combined Market Breadth Charts for the Overall US Market, NYSE and Nasdaq for Market Timing and Strategy.
Read More
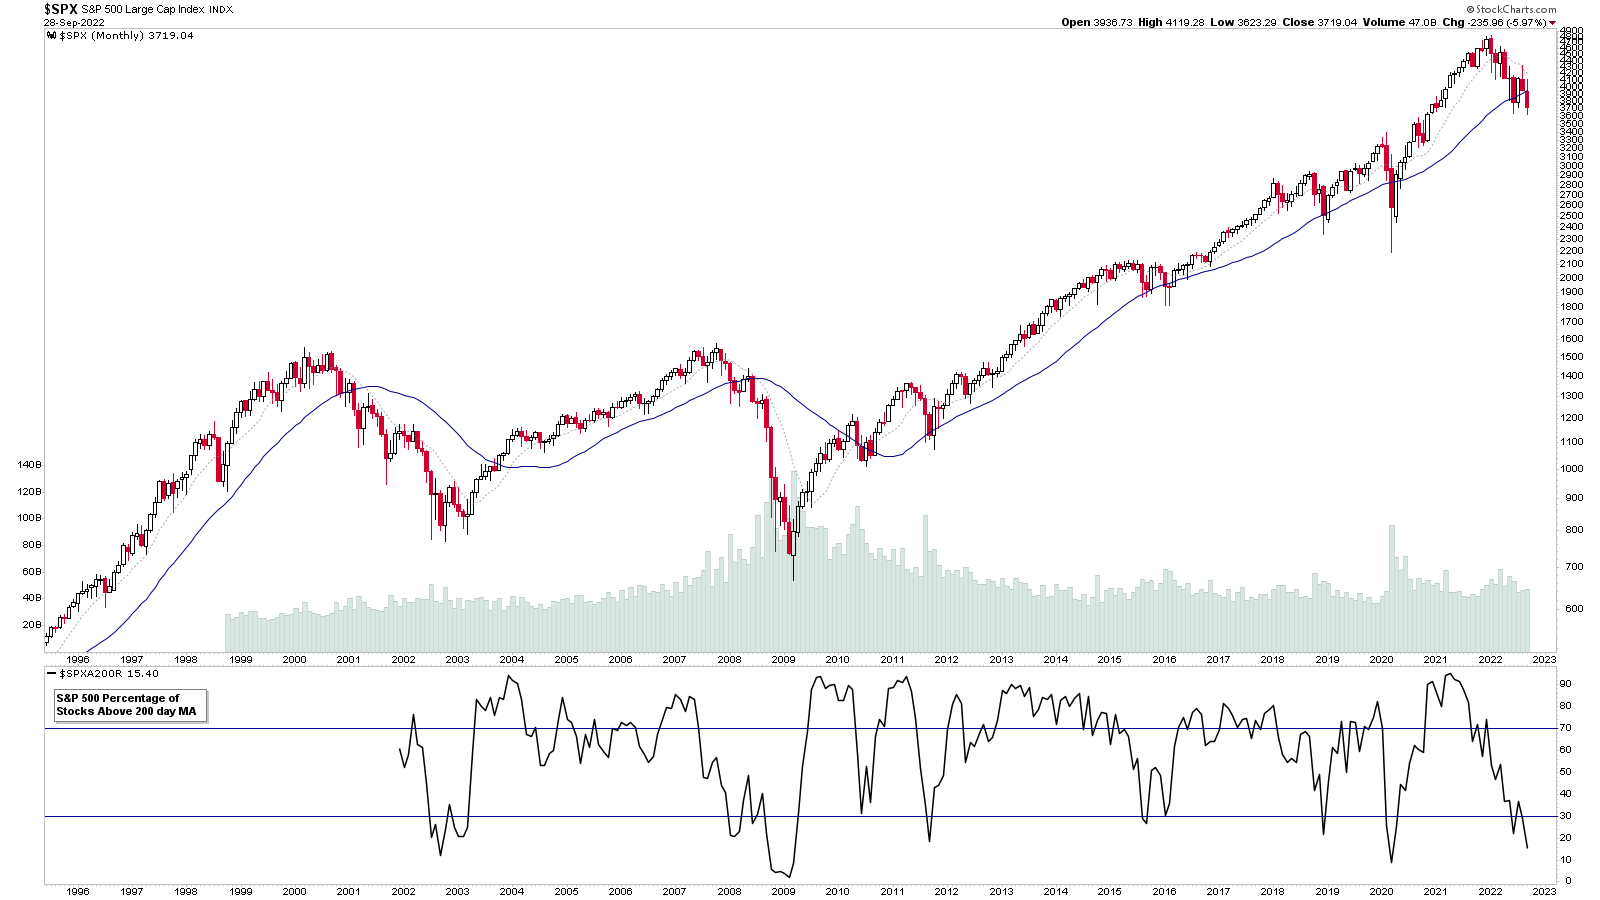
28 September, 2022
Stage Analysis Members Midweek Video – 28 September 2022 (59mins)
Midweek video reviewing the S&P 500 on multiple timeframes, including the 25 year monthly chart with breadth. Plus the VIX and Dollar Index and short-term market breadth. And finally going through some of the watchlist stocks and some additions from todays scans.
Read More
25 September, 2022
Stage Analysis Members Weekend Video – 25 September 2022 (1hr 5mins)
The regular members weekend video discussing the market, industry groups, market breadth and individual stocks from the watchlist in more detail...
Read More
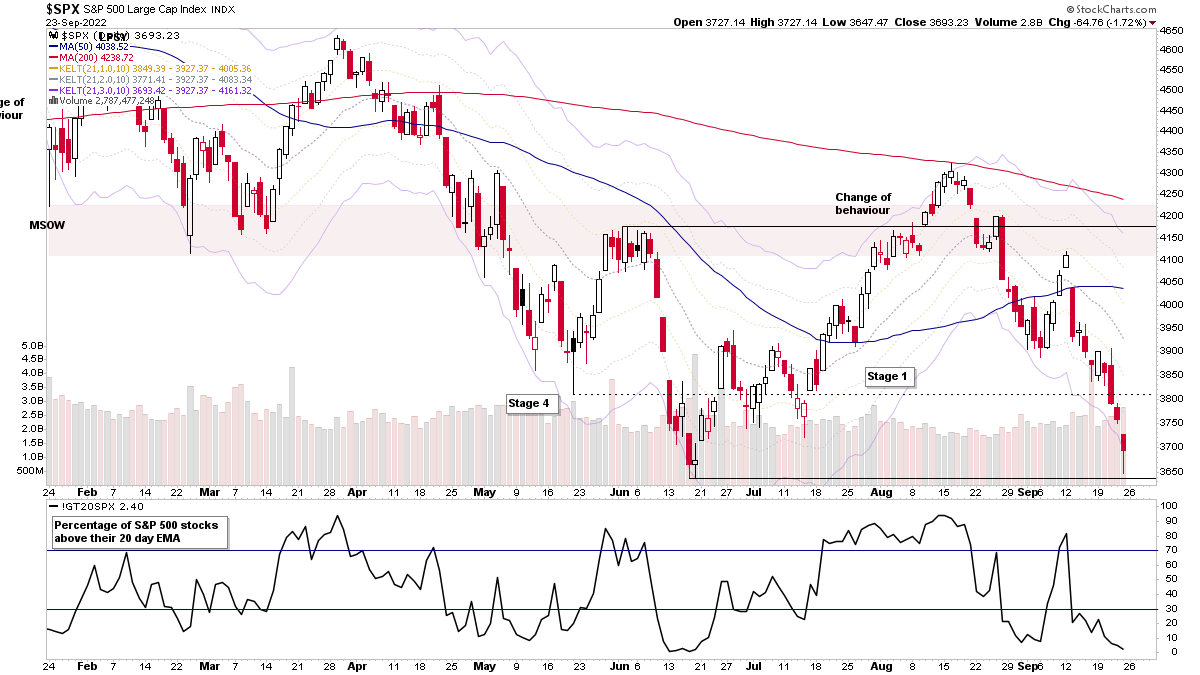
24 September, 2022
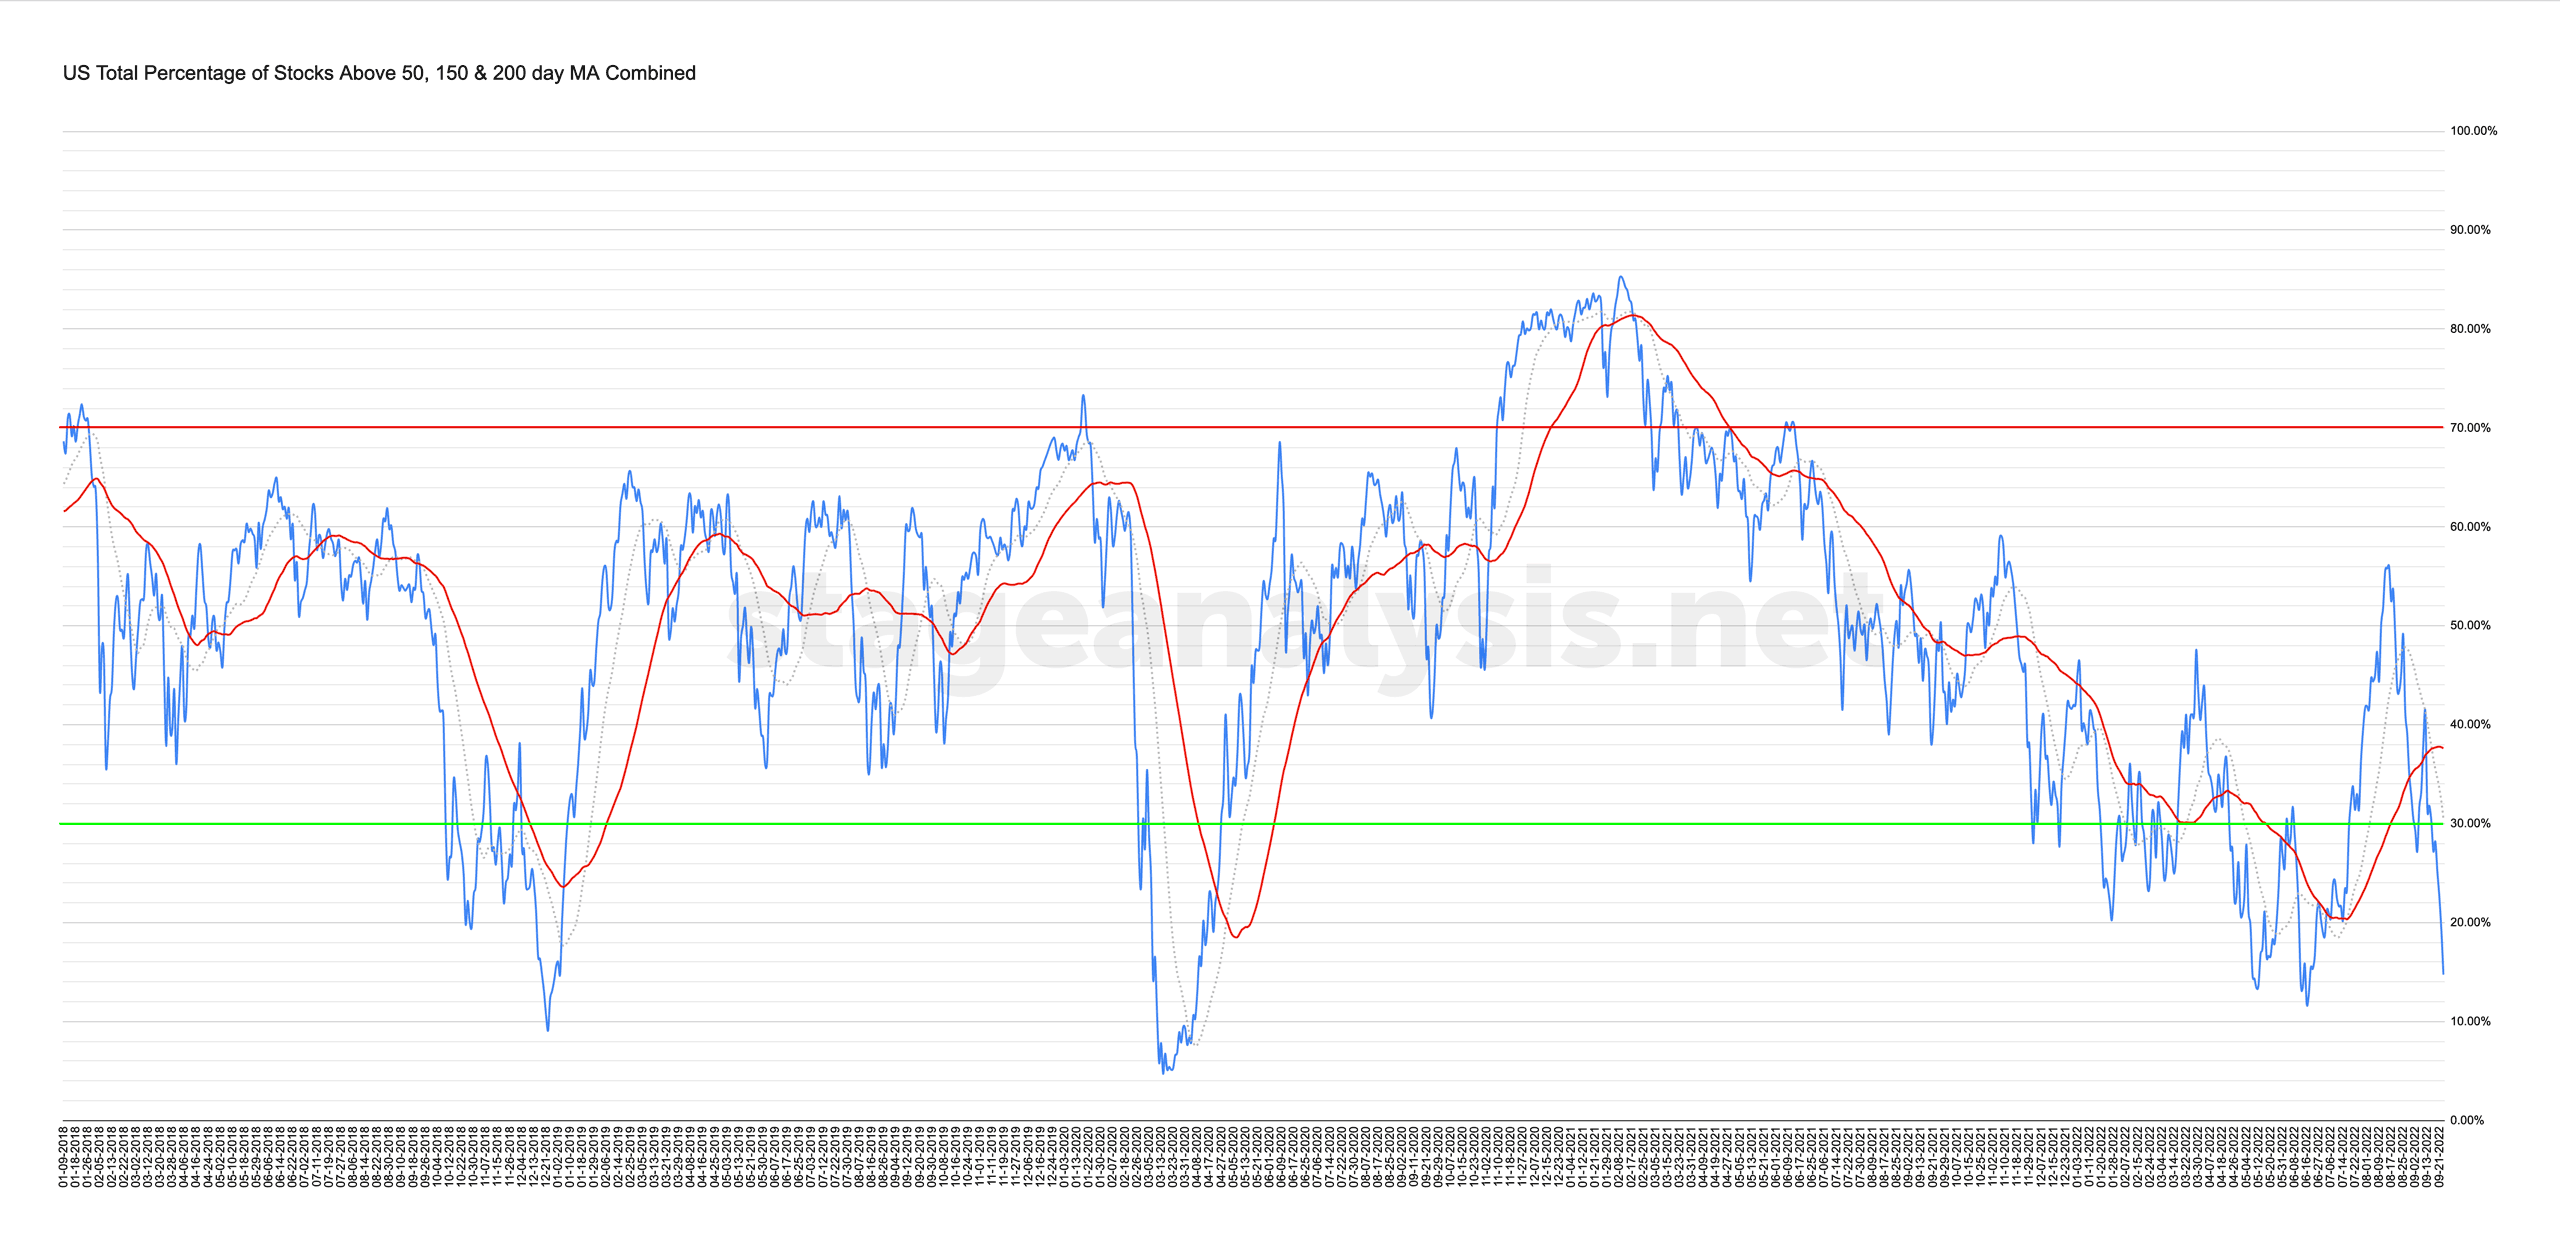
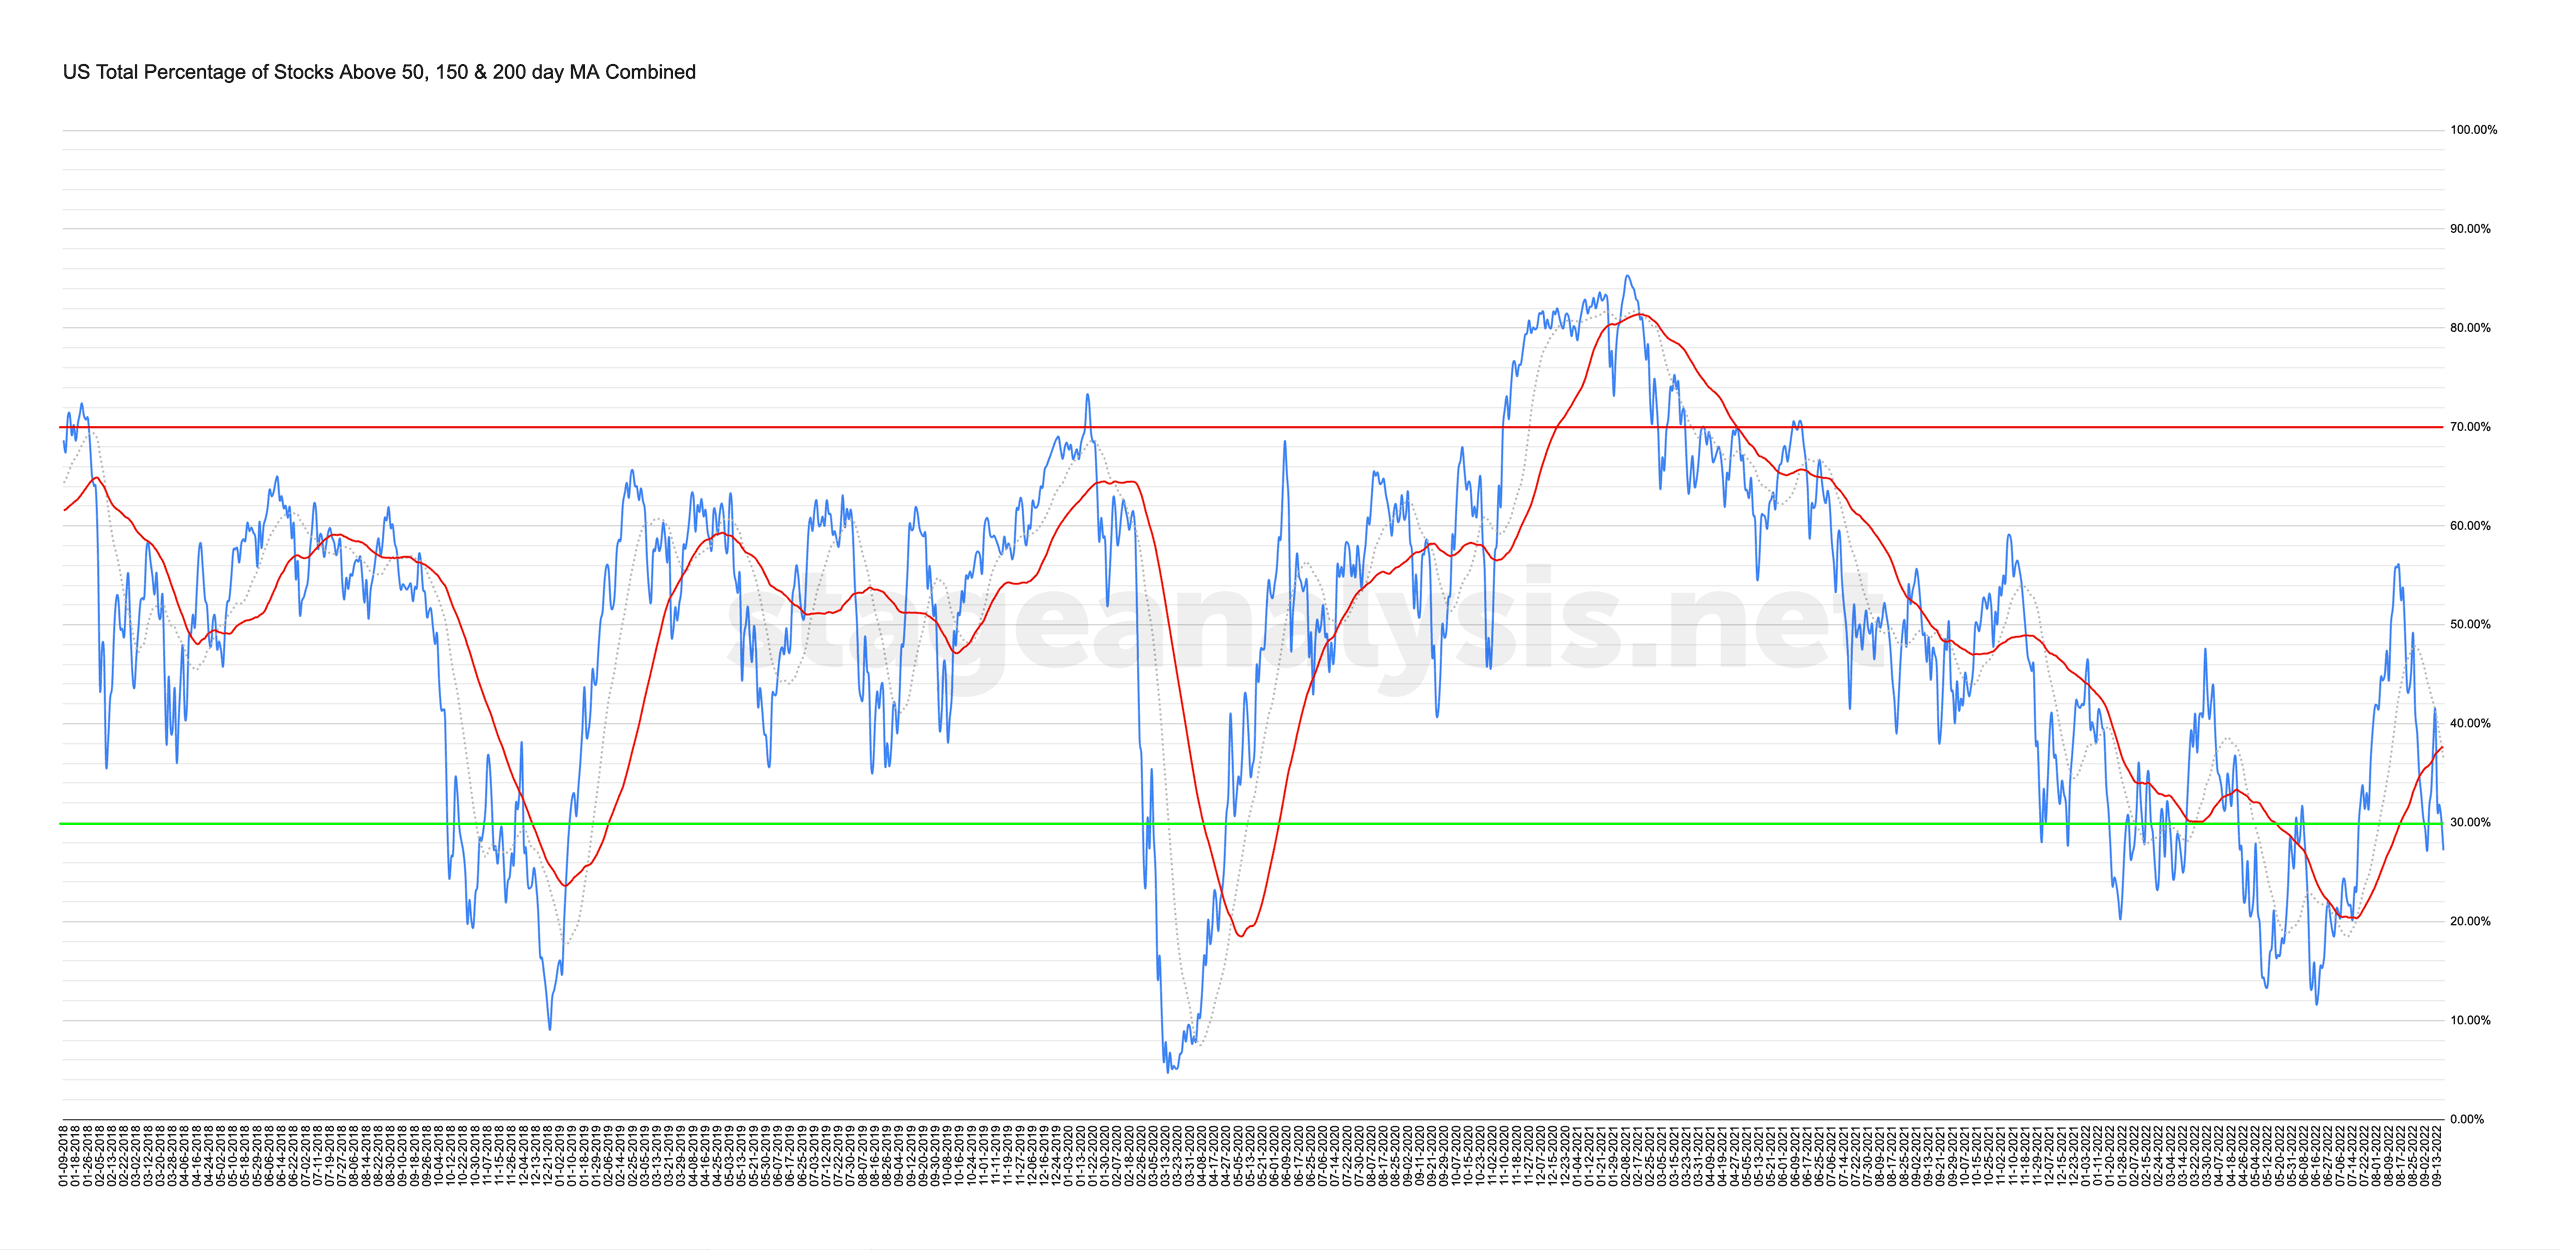
Market Breadth: Percentage of Stocks Above their 50 Day, 150 Day & 200 Day Moving Averages Combined
Custom Percentage of Stocks Above Their 50 Day, 150 Day & 200 Day Moving Averages Combined Market Breadth Charts for the Overall US Market, NYSE and Nasdaq for Market Timing and Strategy.
Read More
19 September, 2022
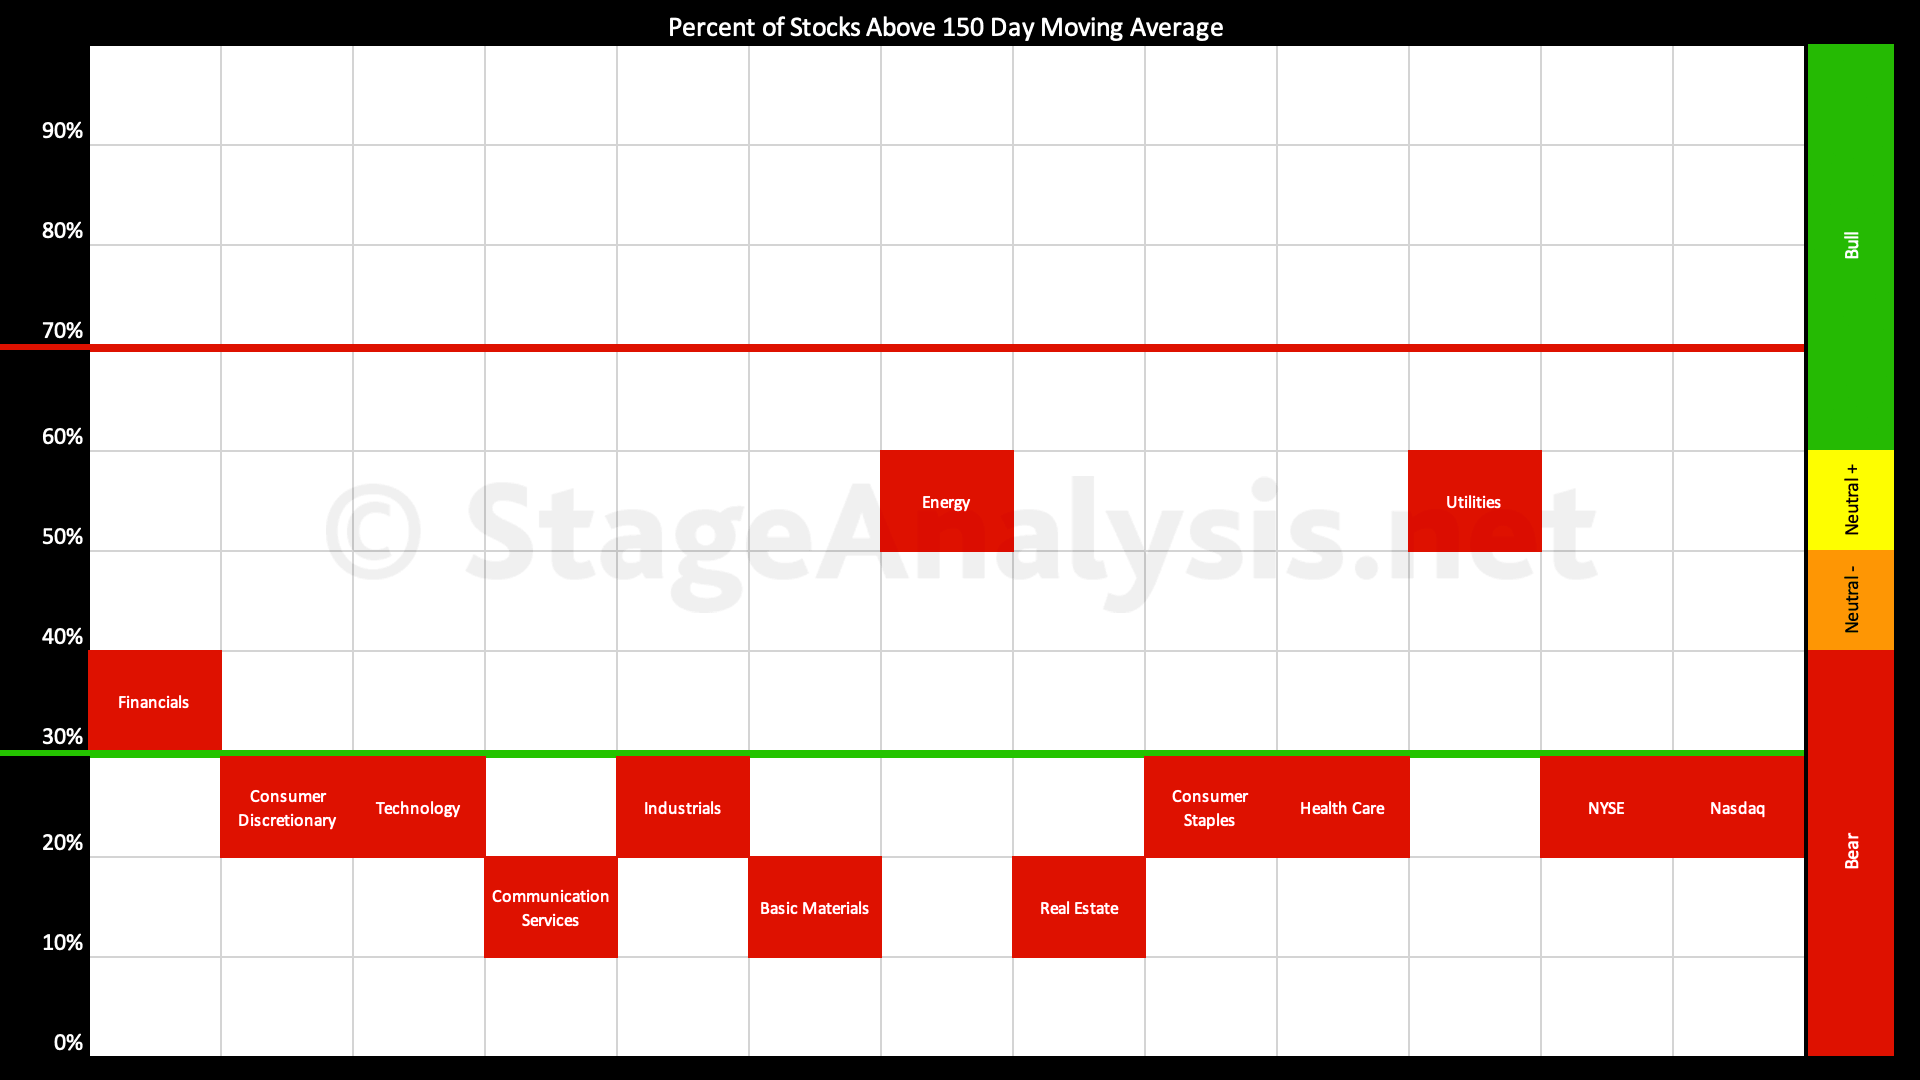
Sector Breadth: Percentage of US Stocks Above Their 150 day (30 Week) Moving Averages
The Percentage of US Stocks Above Their 150 day Moving Averages in the 11 major sectors declined by -9.98% over the last week to close the week at 29.17%, which is back in the lower range in the Stage 4 zone. Only the Utilities and Energy sectors are in the 40% to 60% range in the Stage 1 / Stage 3 zone. However, no sectors are currently above 60%, and so there are no sectors currently in the Stage 2 zone...
Read More
18 September, 2022
Stage Analysis Members Weekend Video – 18 September 2022 (1hr 14mins)
The regular members weekend video discussing the market, industry groups, market breadth and individual stocks from the watchlist...
Read More
17 September, 2022
Market Breadth: Percentage of Stocks Above their 50 Day, 150 Day & 200 Day Moving Averages Combined
Custom Percentage of Stocks Above Their 50 Day, 150 Day & 200 Day Moving Averages Combined Market Breadth Charts for the Overall US Market, NYSE and Nasdaq for Market Timing and Strategy.
Read More
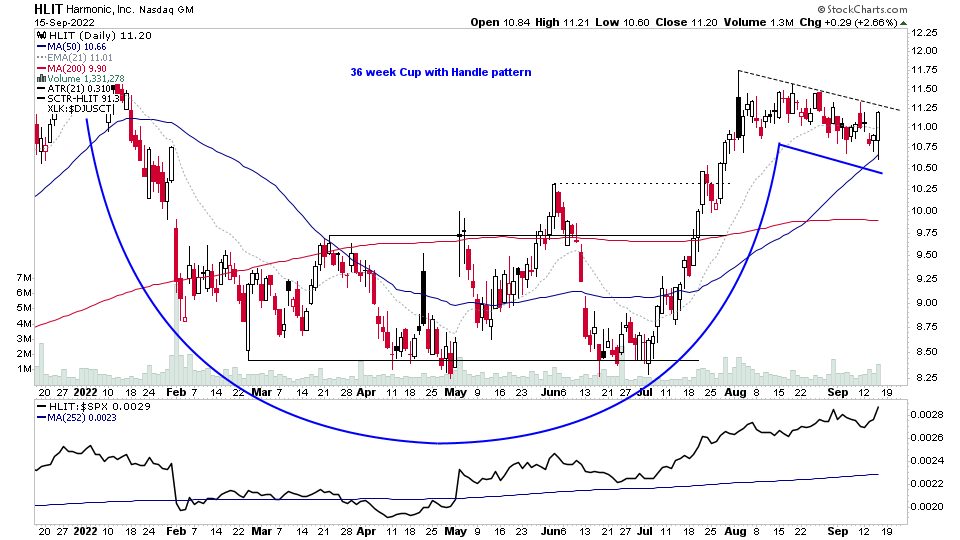
15 September, 2022
US Stocks Watchlist – 15 September 2022
Many individual stocks continue to show strong relative strength versus the market action and have continued on with the development of Stage 1 bases, and an increasing number of stocks have been moving into early Stage 2. However, many "setups" as people like to call them have become broken, with large shakeouts and breakdowns of patterns in many areas also...
Read More
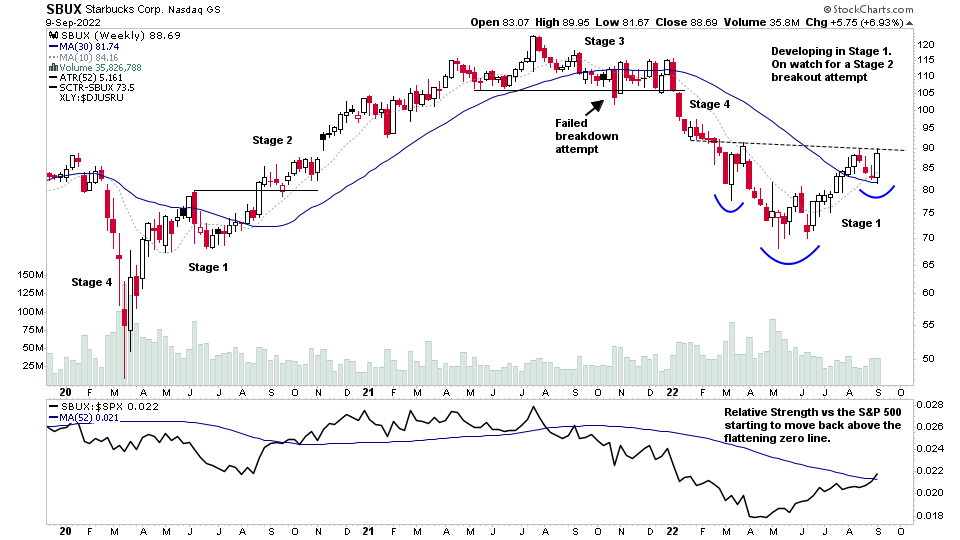
11 September, 2022
Stage Analysis Members Weekend Video – 11 September 2022 (1hr 34mins)
The weekend video begins with a detailed look at some of the weeks strong volume Stage 2 movers weekly charts and some interesting Stage 1 stocks too. Then an update on the major indexes developing Stage 1 base structures. What's moving in the US Industry Groups Relative Strength Rankings and the IBD Industry Groups Bell Curve – Bullish Percent...
Read More