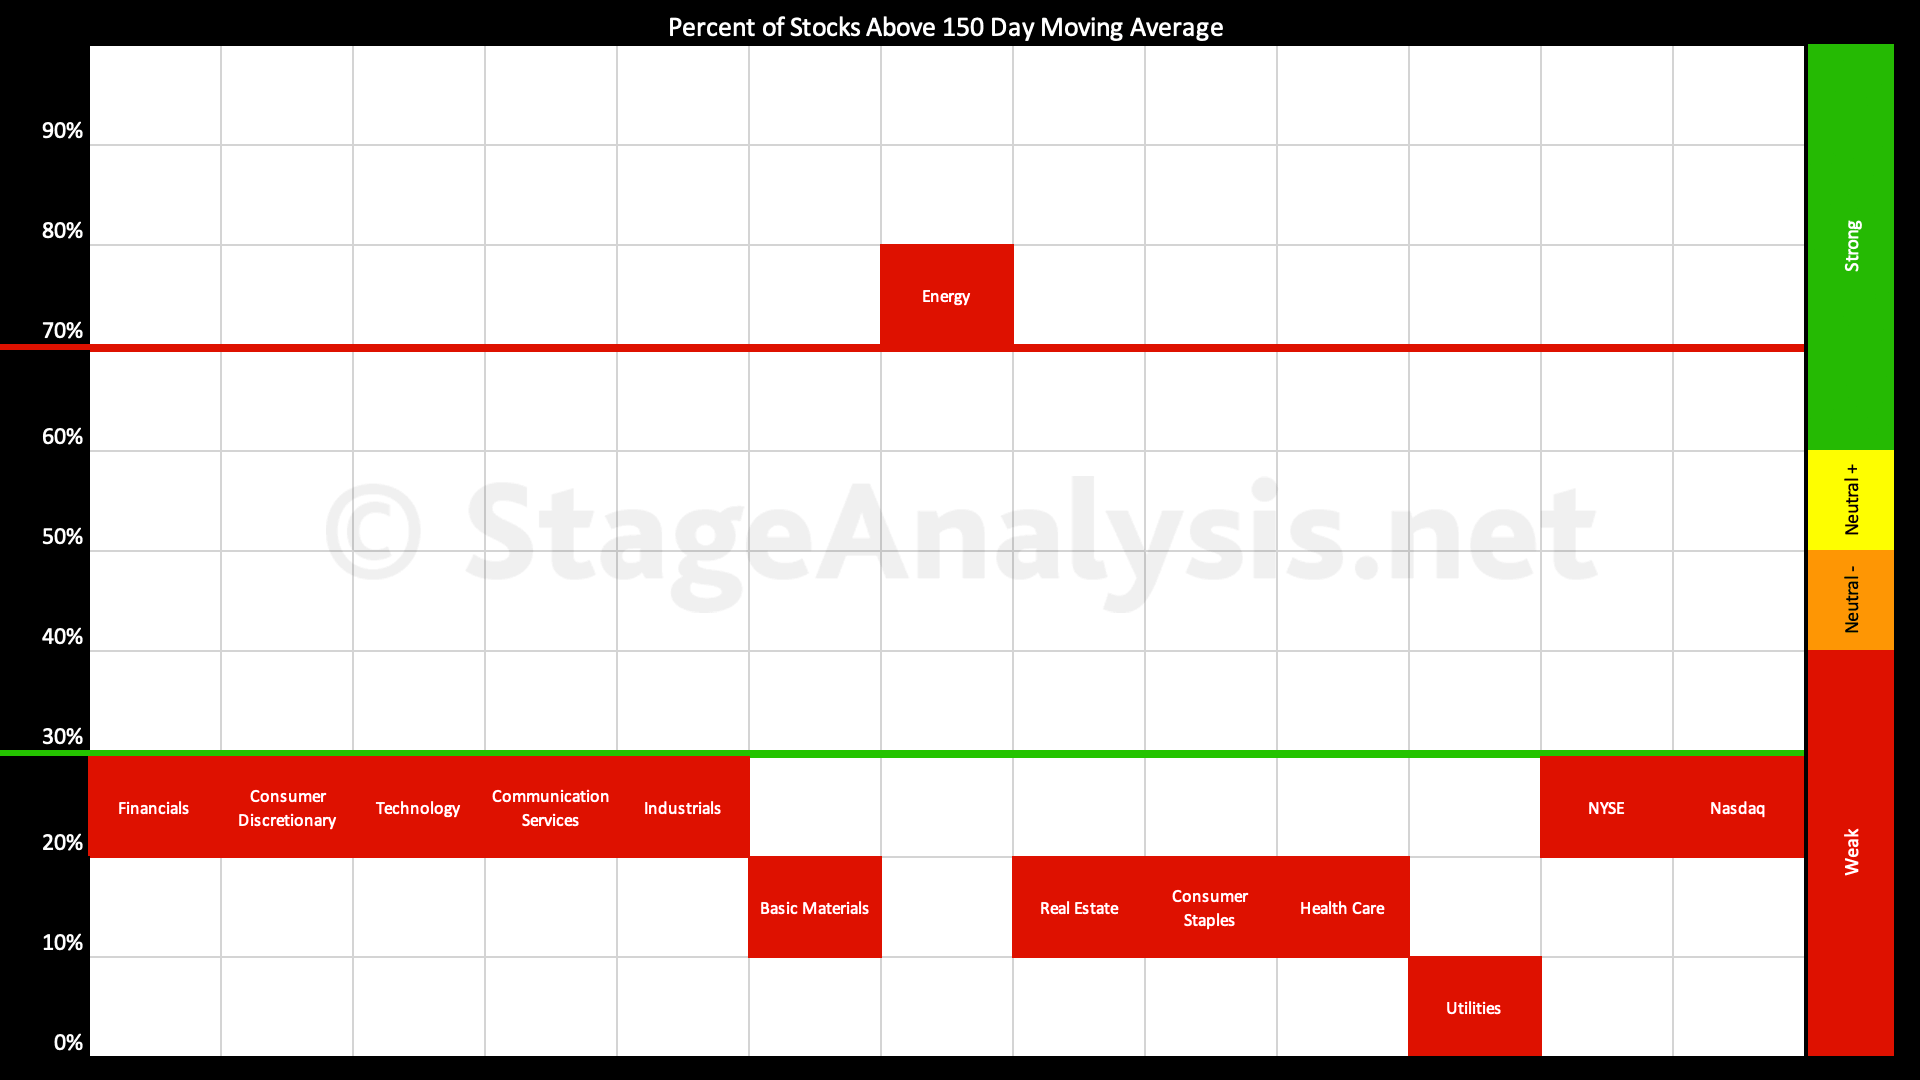
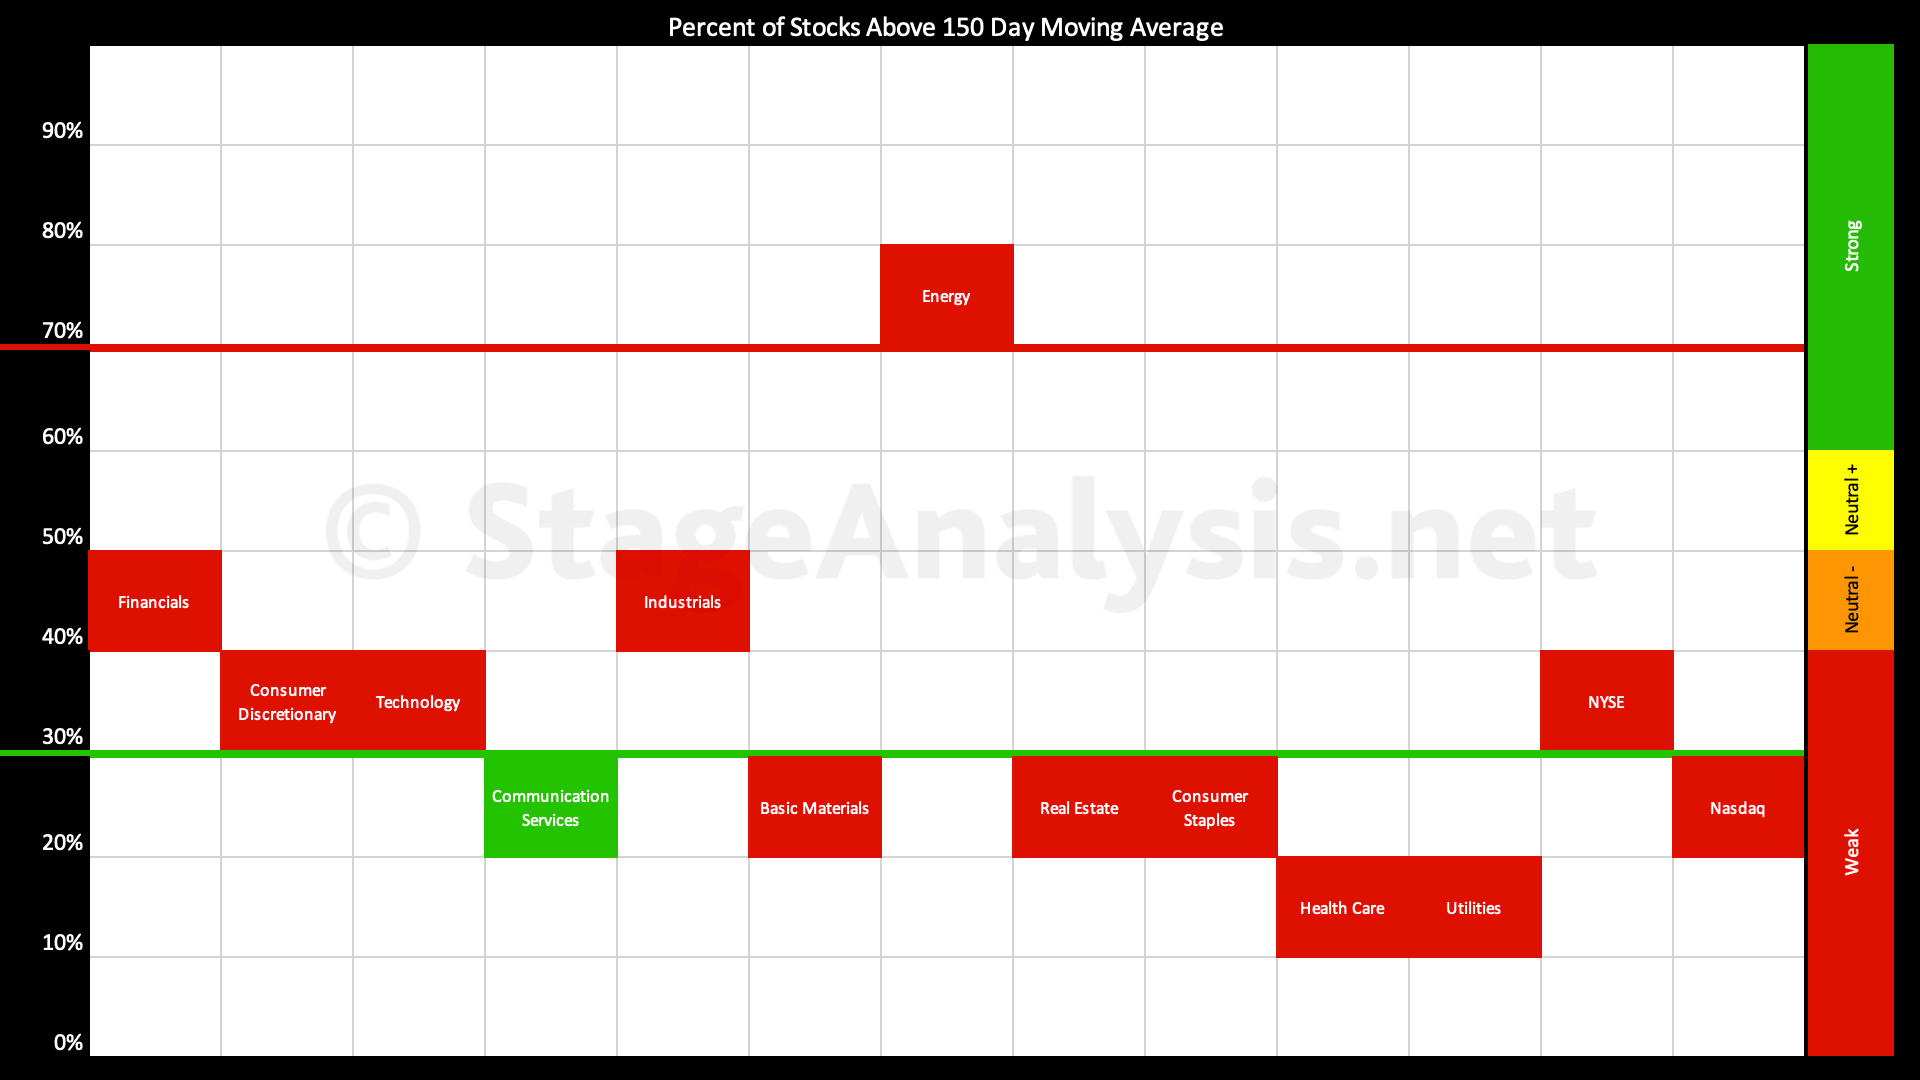
The Percentage of US Stocks Above Their 150 day Moving Averages in the 11 major sectors declined a further -7.93% since the previous post on the 9th October 2023, dropping the overall average down to 24.53%, and so it is now heavily weighted in the Weak zone in the lower third of the field.
Read More

Blog
22 October, 2023
Stage Analysis Members Video – 22 October 2023 (1hr 10mins)
Stage Analysis members weekend video discussing the Major US Indexes, the Futures Charts, Industry Groups Relative Strength (RS) Rankings, IBD Industry Group Bell Curve – Bullish Percent, Market Breadth Update to determine the Weight of Evidence. Bitcoin and Ethereum analysis, and then finally a discussion of the weekends watchlist stocks in detail on multiple timeframes.
Read More
21 October, 2023
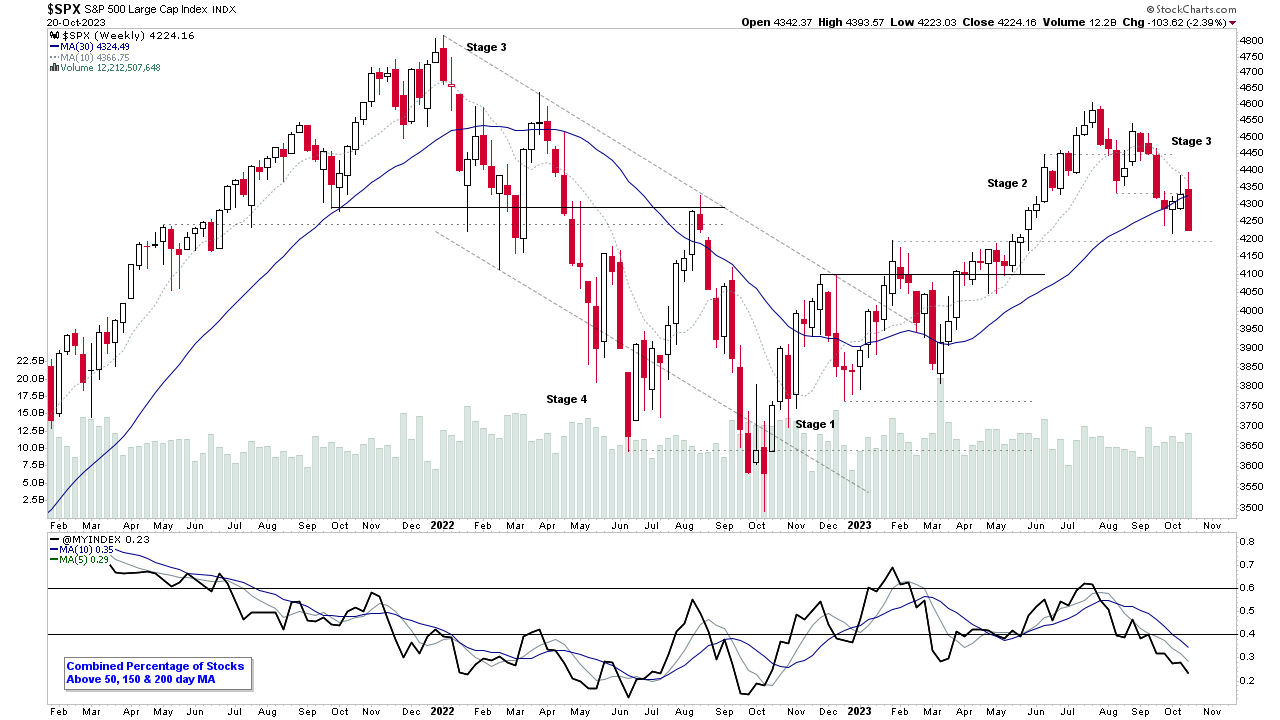
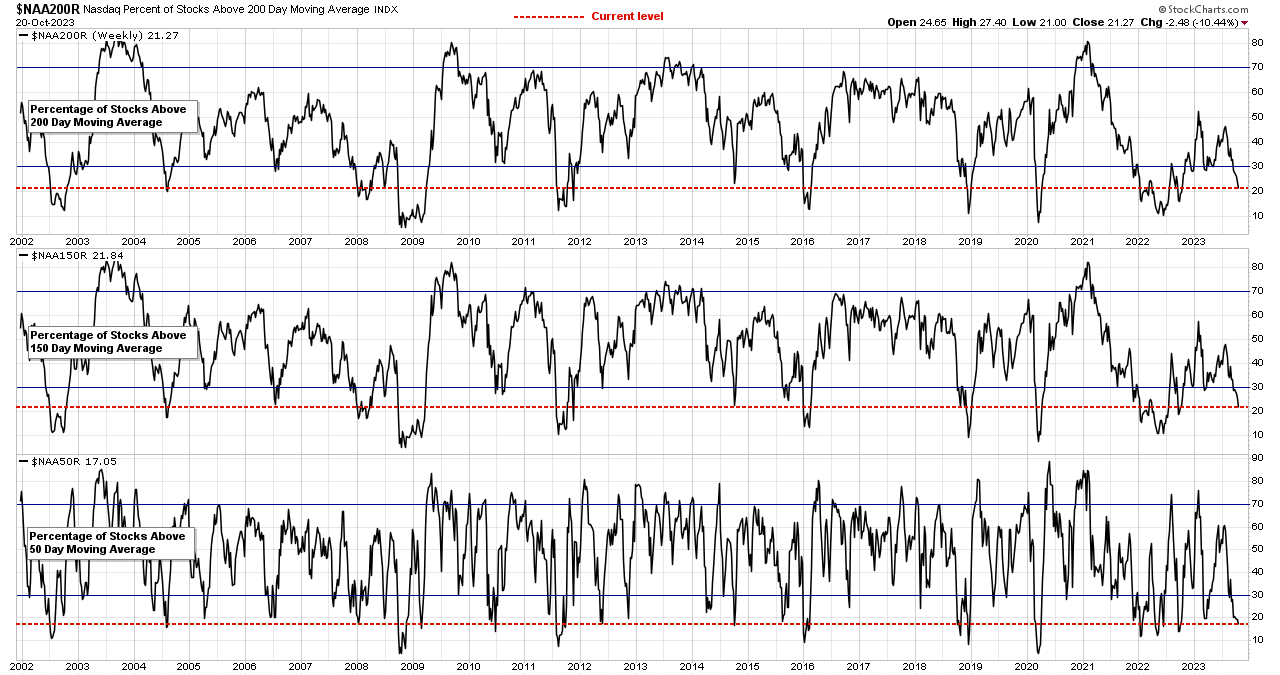
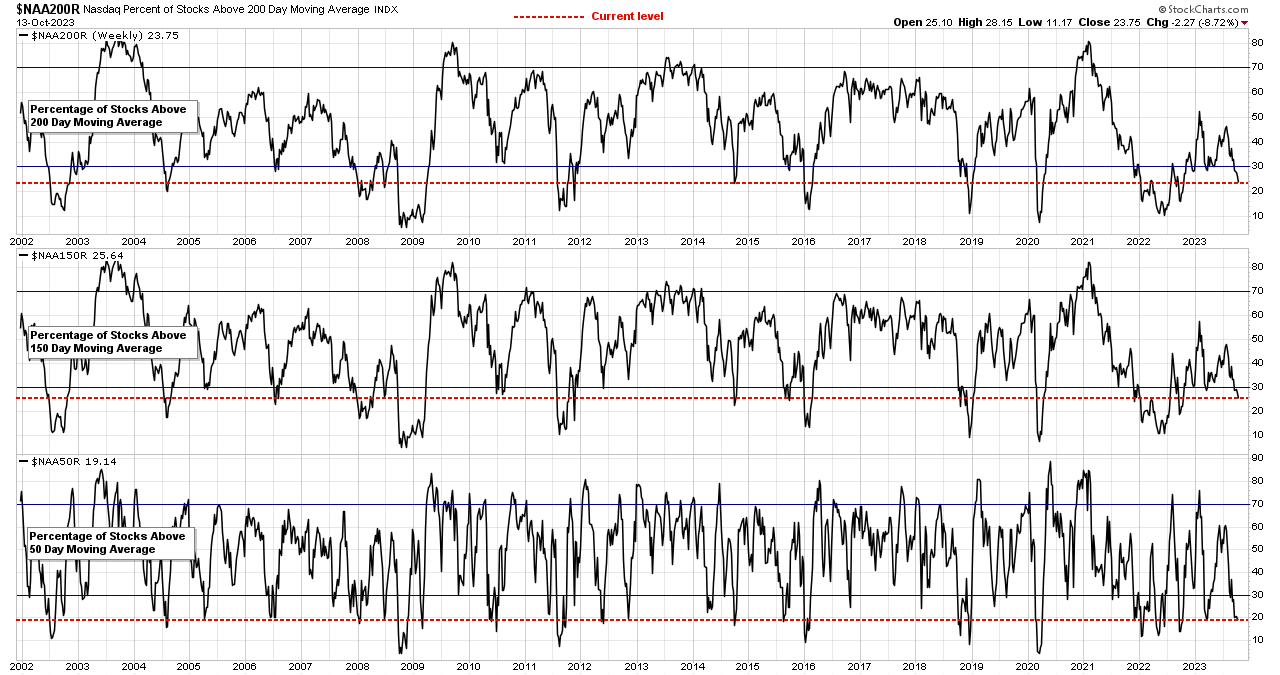
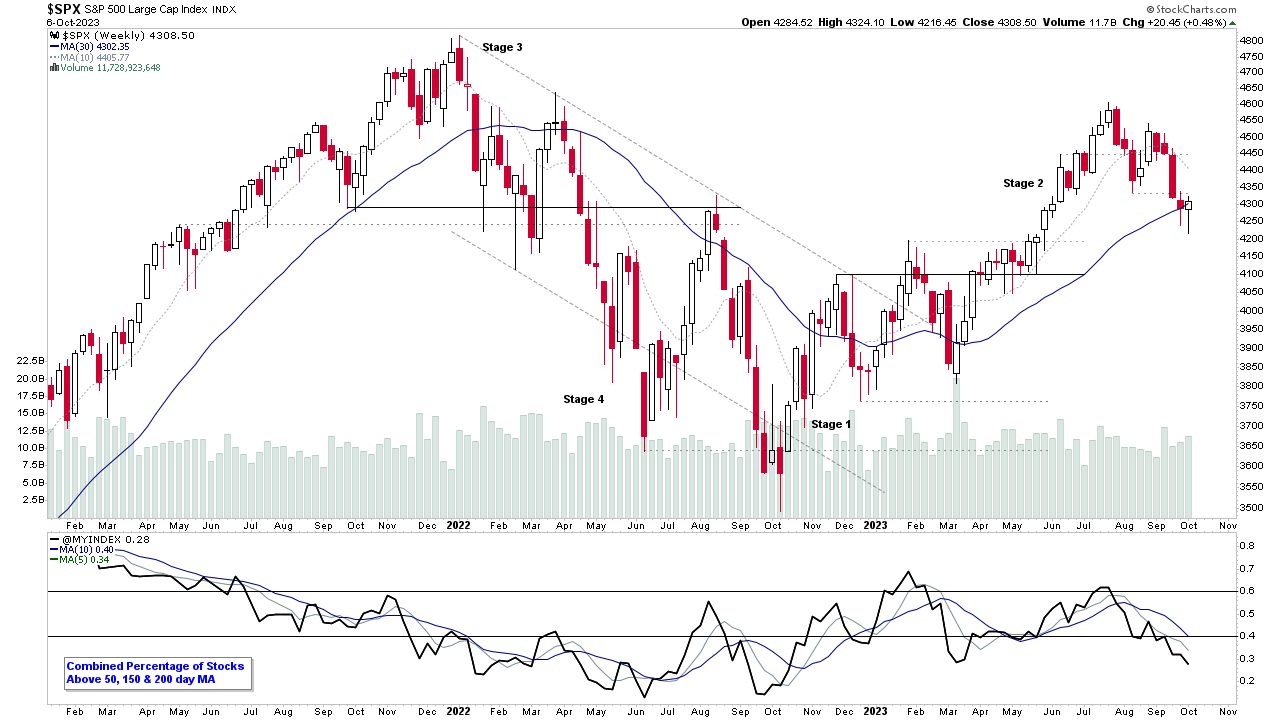
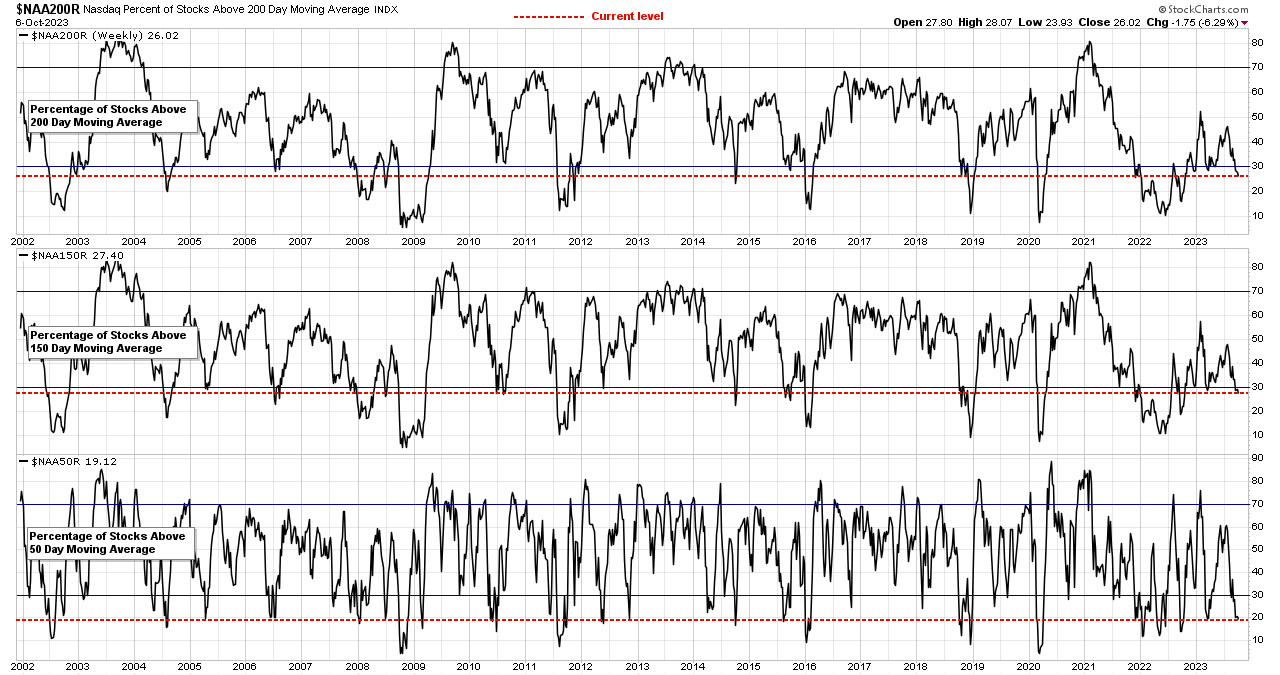
Market Breadth: Percentage of Stocks Above their 50 Day, 150 Day & 200 Day Moving Averages Combined
Custom Percentage of Stocks Above Their 50 Day, 150 Day & 200 Day Moving Averages Combined Market Breadth Charts for the Overall US Market, NYSE and Nasdaq for Market Timing and Strategy.
Read More
18 October, 2023
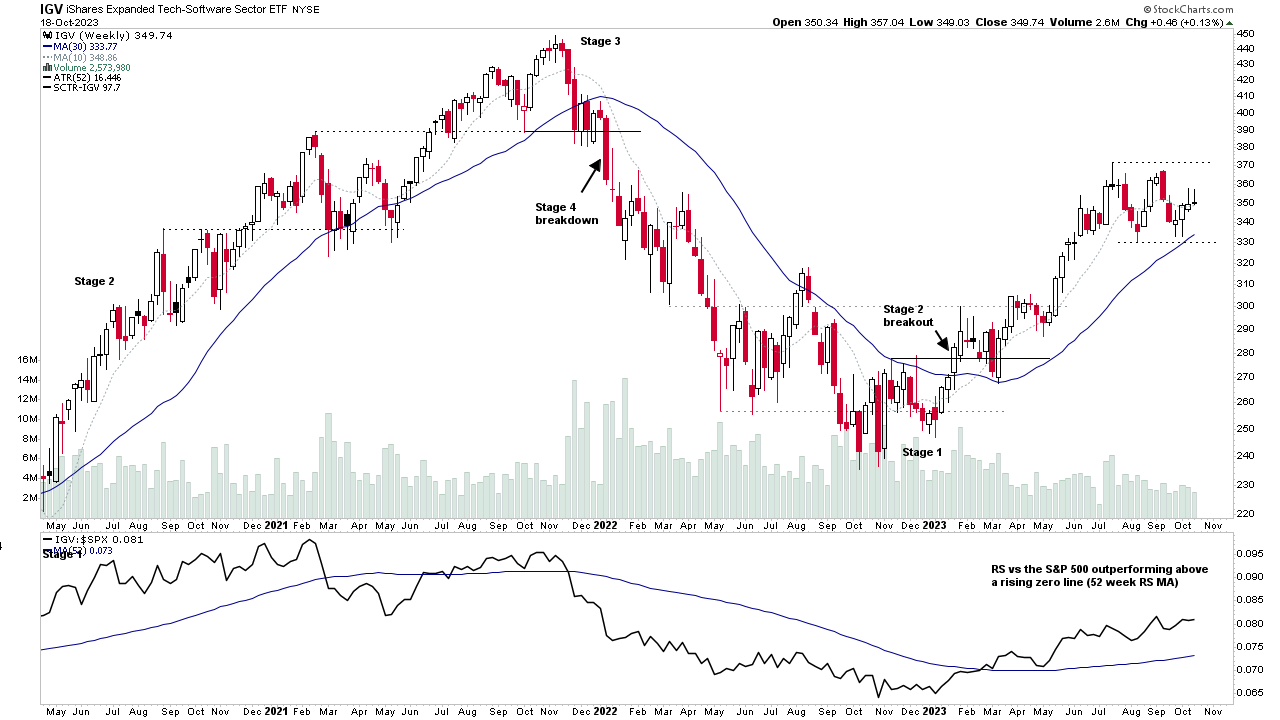
Software Group Focus Video – 18 October 2023 (55mins)
The Software group remains one of the leading industry groups year to date and has been consolidating / building a base structure in Stage 2 over the last quarter since the previous review as the broader market has also corrected. So with earnings approaching for the majority of the Software group in the coming weeks, it's an ideal time to do review the group again and how its current RS leaders are acting.
Read More
15 October, 2023
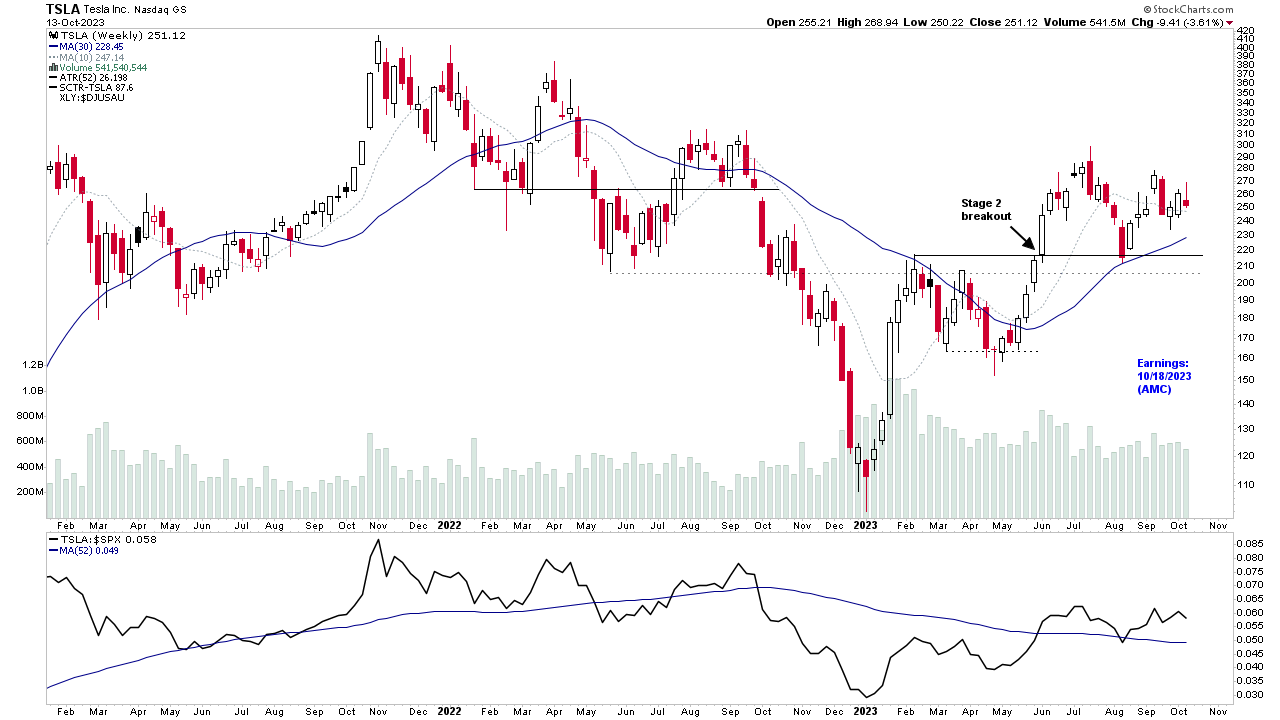
Stage Analysis Members Video – 15 October 2023 (1hr 11mins)
This weekends video begins with analysis of the TSLA and NFLX ahead of their earnings results this week, followed by the Major Indexes Update, Futures SATA Charts, Industry Groups RS Rankings, IBD Industry Group Bell Curve – Bullish Percent, Market Breadth Update to determine the Weight of Evidence, Stage 2 breakouts, and finishing with analysis of the recent watchlist stocks in detail on multiple timeframes.
Read More
14 October, 2023
Market Breadth: Percentage of Stocks Above their 50 Day, 150 Day & 200 Day Moving Averages Combined
Custom Percentage of Stocks Above Their 50 Day, 150 Day & 200 Day Moving Averages Combined Market Breadth Charts for the Overall US Market, NYSE and Nasdaq for Market Timing and Strategy.
Read More
11 October, 2023
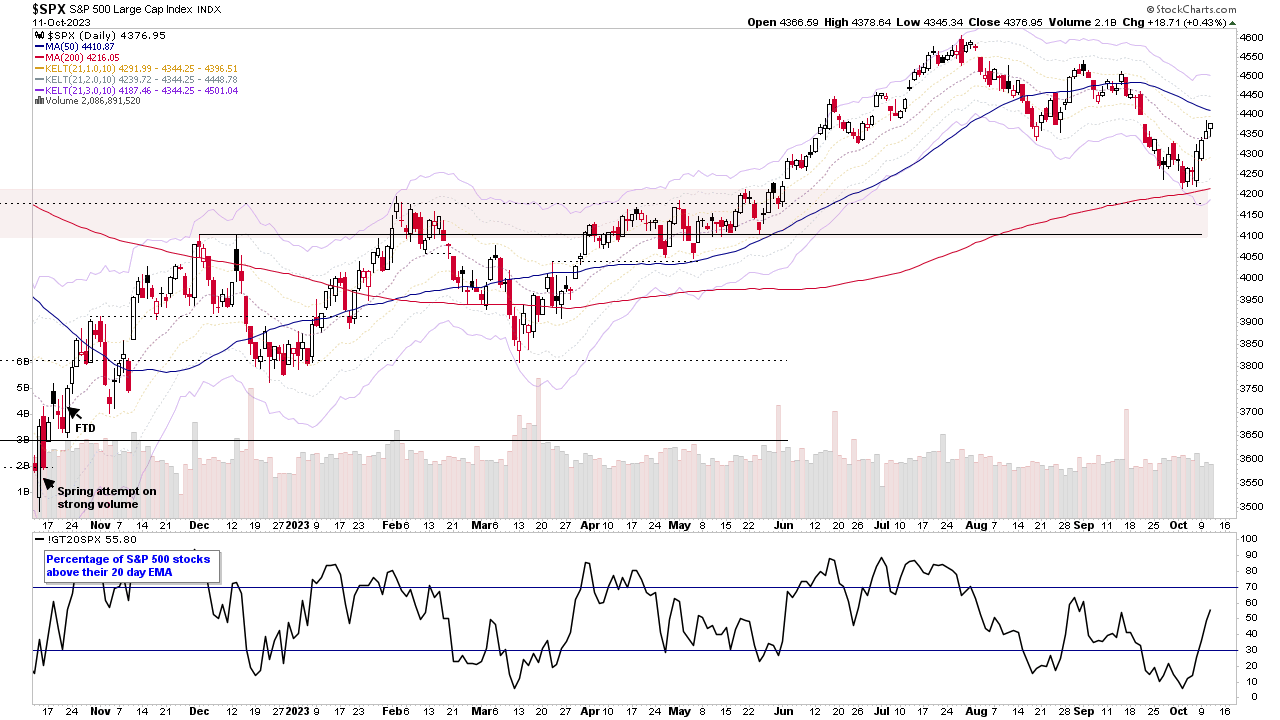
Stage Analysis Members Video – 11 October 2023 (46mins)
The Stage Analysis midweek video with a discussion of the major US stock market indexes, and short-term market breadth measures. Followed by a detailed look at the Sector Breadth charts and finishing with the recent watchlist stocks on multiple timeframes.
Read More
09 October, 2023
Sector Breadth: Percentage of US Stocks Above Their 150 day (30 Week) Moving Averages
The Percentage of US Stocks Above Their 150 day Moving Averages in the 11 major sectors declined a further -3.79% since the previous post on the 25th September 2023, taking the overall average down to 32.46%, and so has fallen further into the Weak zone in the lower third of the field...
Read More
08 October, 2023
Stage Analysis Members Video – 8 October 2023 (1hr 15mins)
Stage Analysis members video discussing the Major Indexes Update, Futures SATA Charts, Industry Groups RS Rankings, IBD Industry Group Bell Curve – Bullish Percent, Market Breadth Update to determine the Weight of Evidence, Strong Volume Stage 2 stocks and closing with analysis of the recent watchlist stocks in detail on multiple timeframes.
Read More
07 October, 2023
Market Breadth: Percentage of Stocks Above their 50 Day, 150 Day & 200 Day Moving Averages Combined
Custom Percentage of Stocks Above Their 50 Day, 150 Day & 200 Day Moving Averages Combined Market Breadth Charts for the Overall US Market, NYSE and Nasdaq for Market Timing and Strategy.
Read More