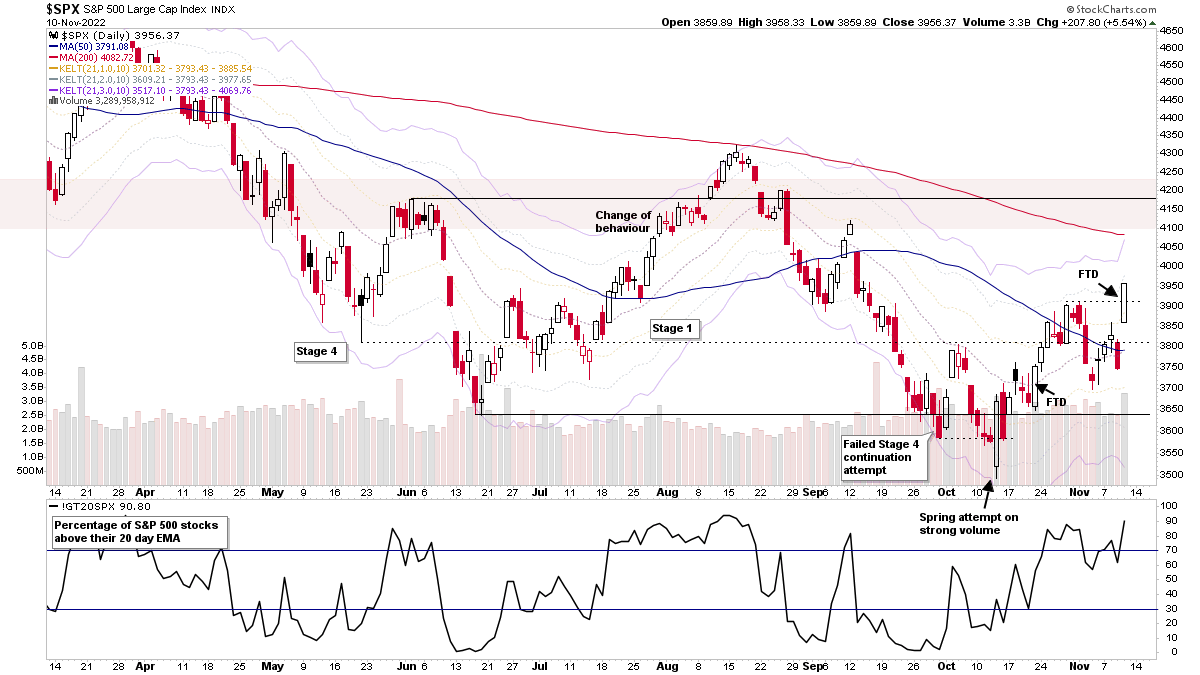
The members midweek video discussing the market, short-term market breadth and individual stocks from the watchlist in more detail following the huge moves in the stock market indexes, causing a further Follow Through Day (FTD).
Read More

Blog
09 November, 2022
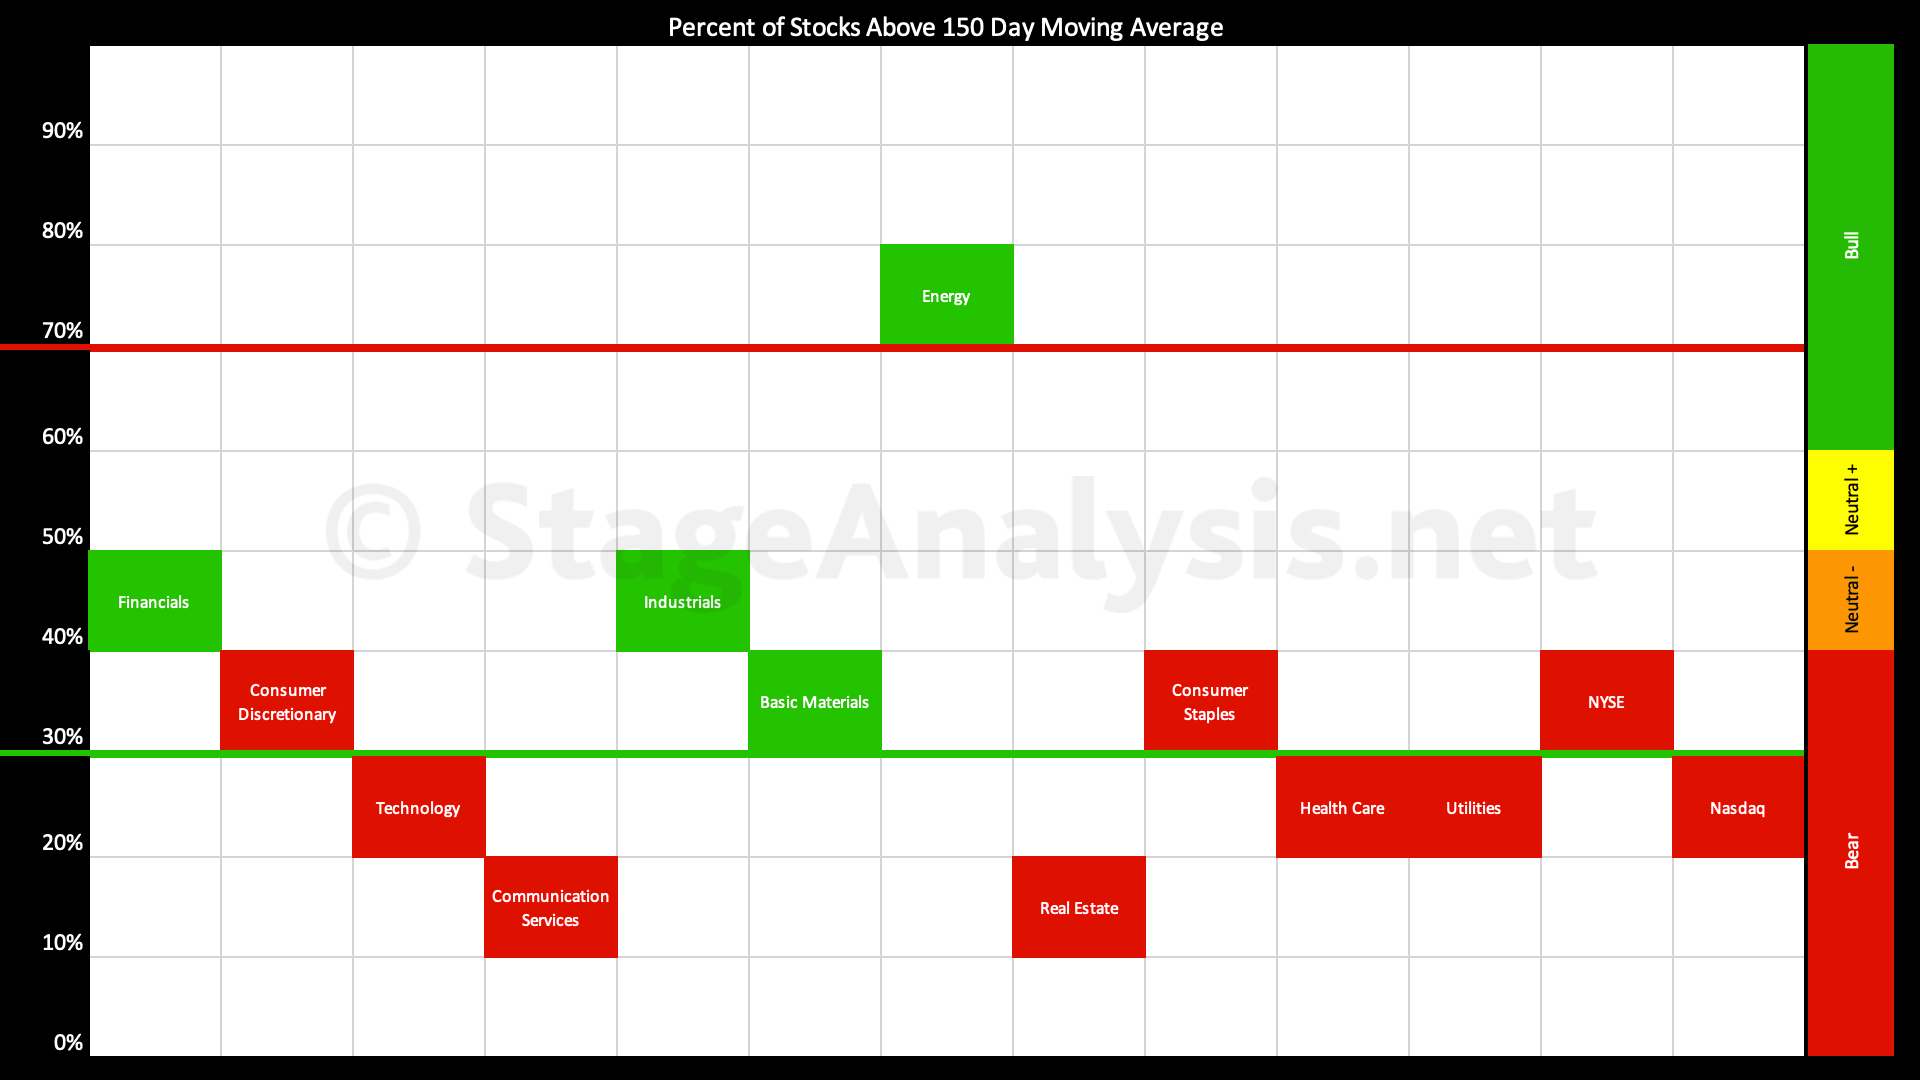
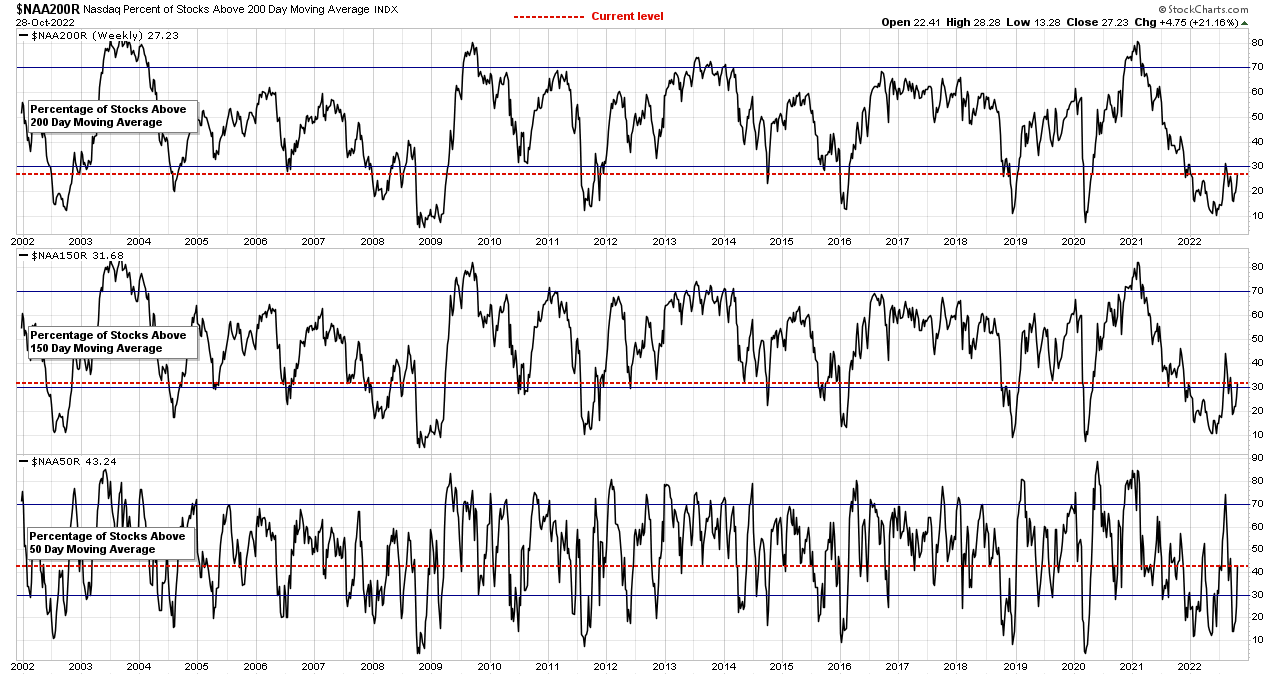
Sector Breadth: Percentage of US Stocks Above Their 150 day (30 Week) Moving Averages
The Percentage of US Stocks Above Their 150 day Moving Averages in the 11 major sectors has improved over the last month since my previous post on the 11th October when it was starting to rebound from lowest reading of the year at 14.76% on the 30th September...
Read More
06 November, 2022
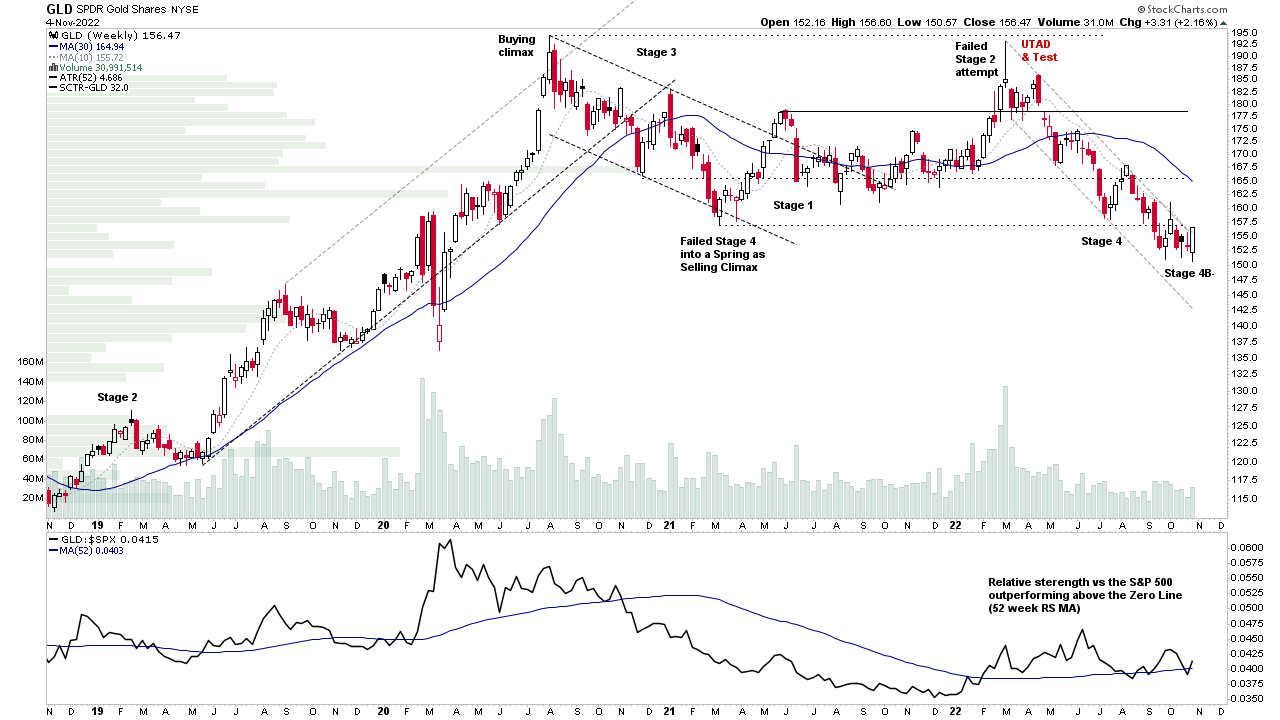
Stage Analysis Members Video Part 1 – 6 November 2022 (59mins)
Part 1 of the regular members weekend video beginning with a special focus on Gold and Silver, and the Gold Miners group. Following that we discuss the Stage Analysis of the Major Indexes, and the Industry Groups Relative Strength Rankings, with a look in more depth of some of the groups making the strongest moves. Plus a look at the IBD Industry Groups Bell Curve – Bullish Percent and finally the Market Breadth Update to help to determine the current Weight of Evidence.
Read More
05 November, 2022
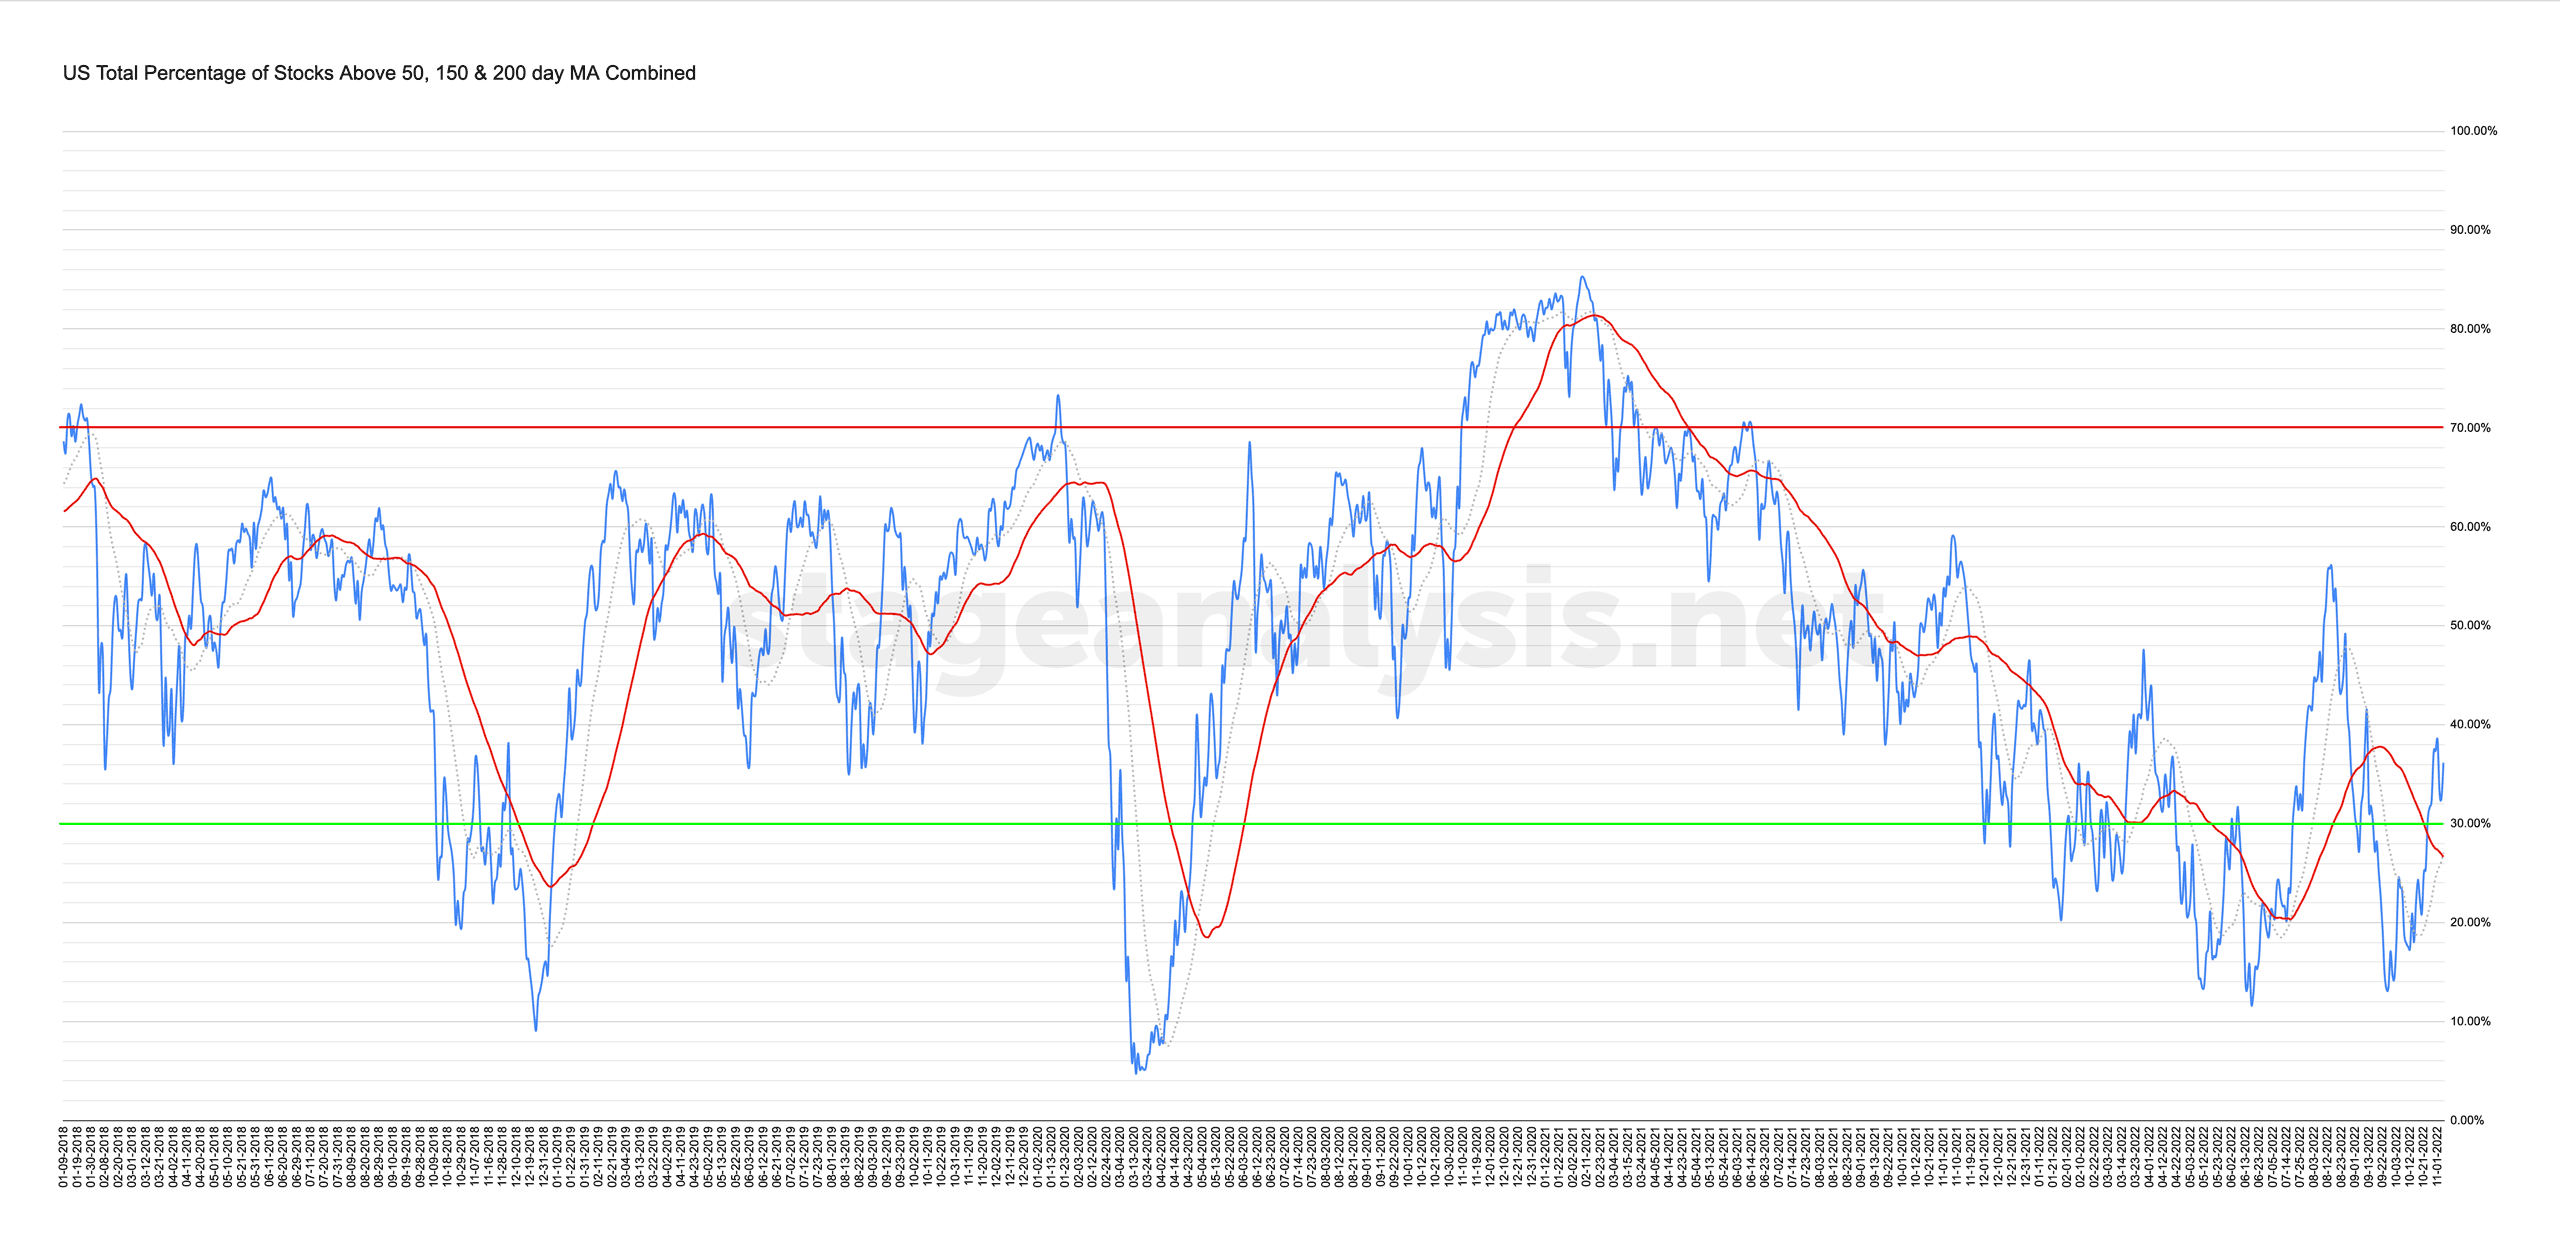
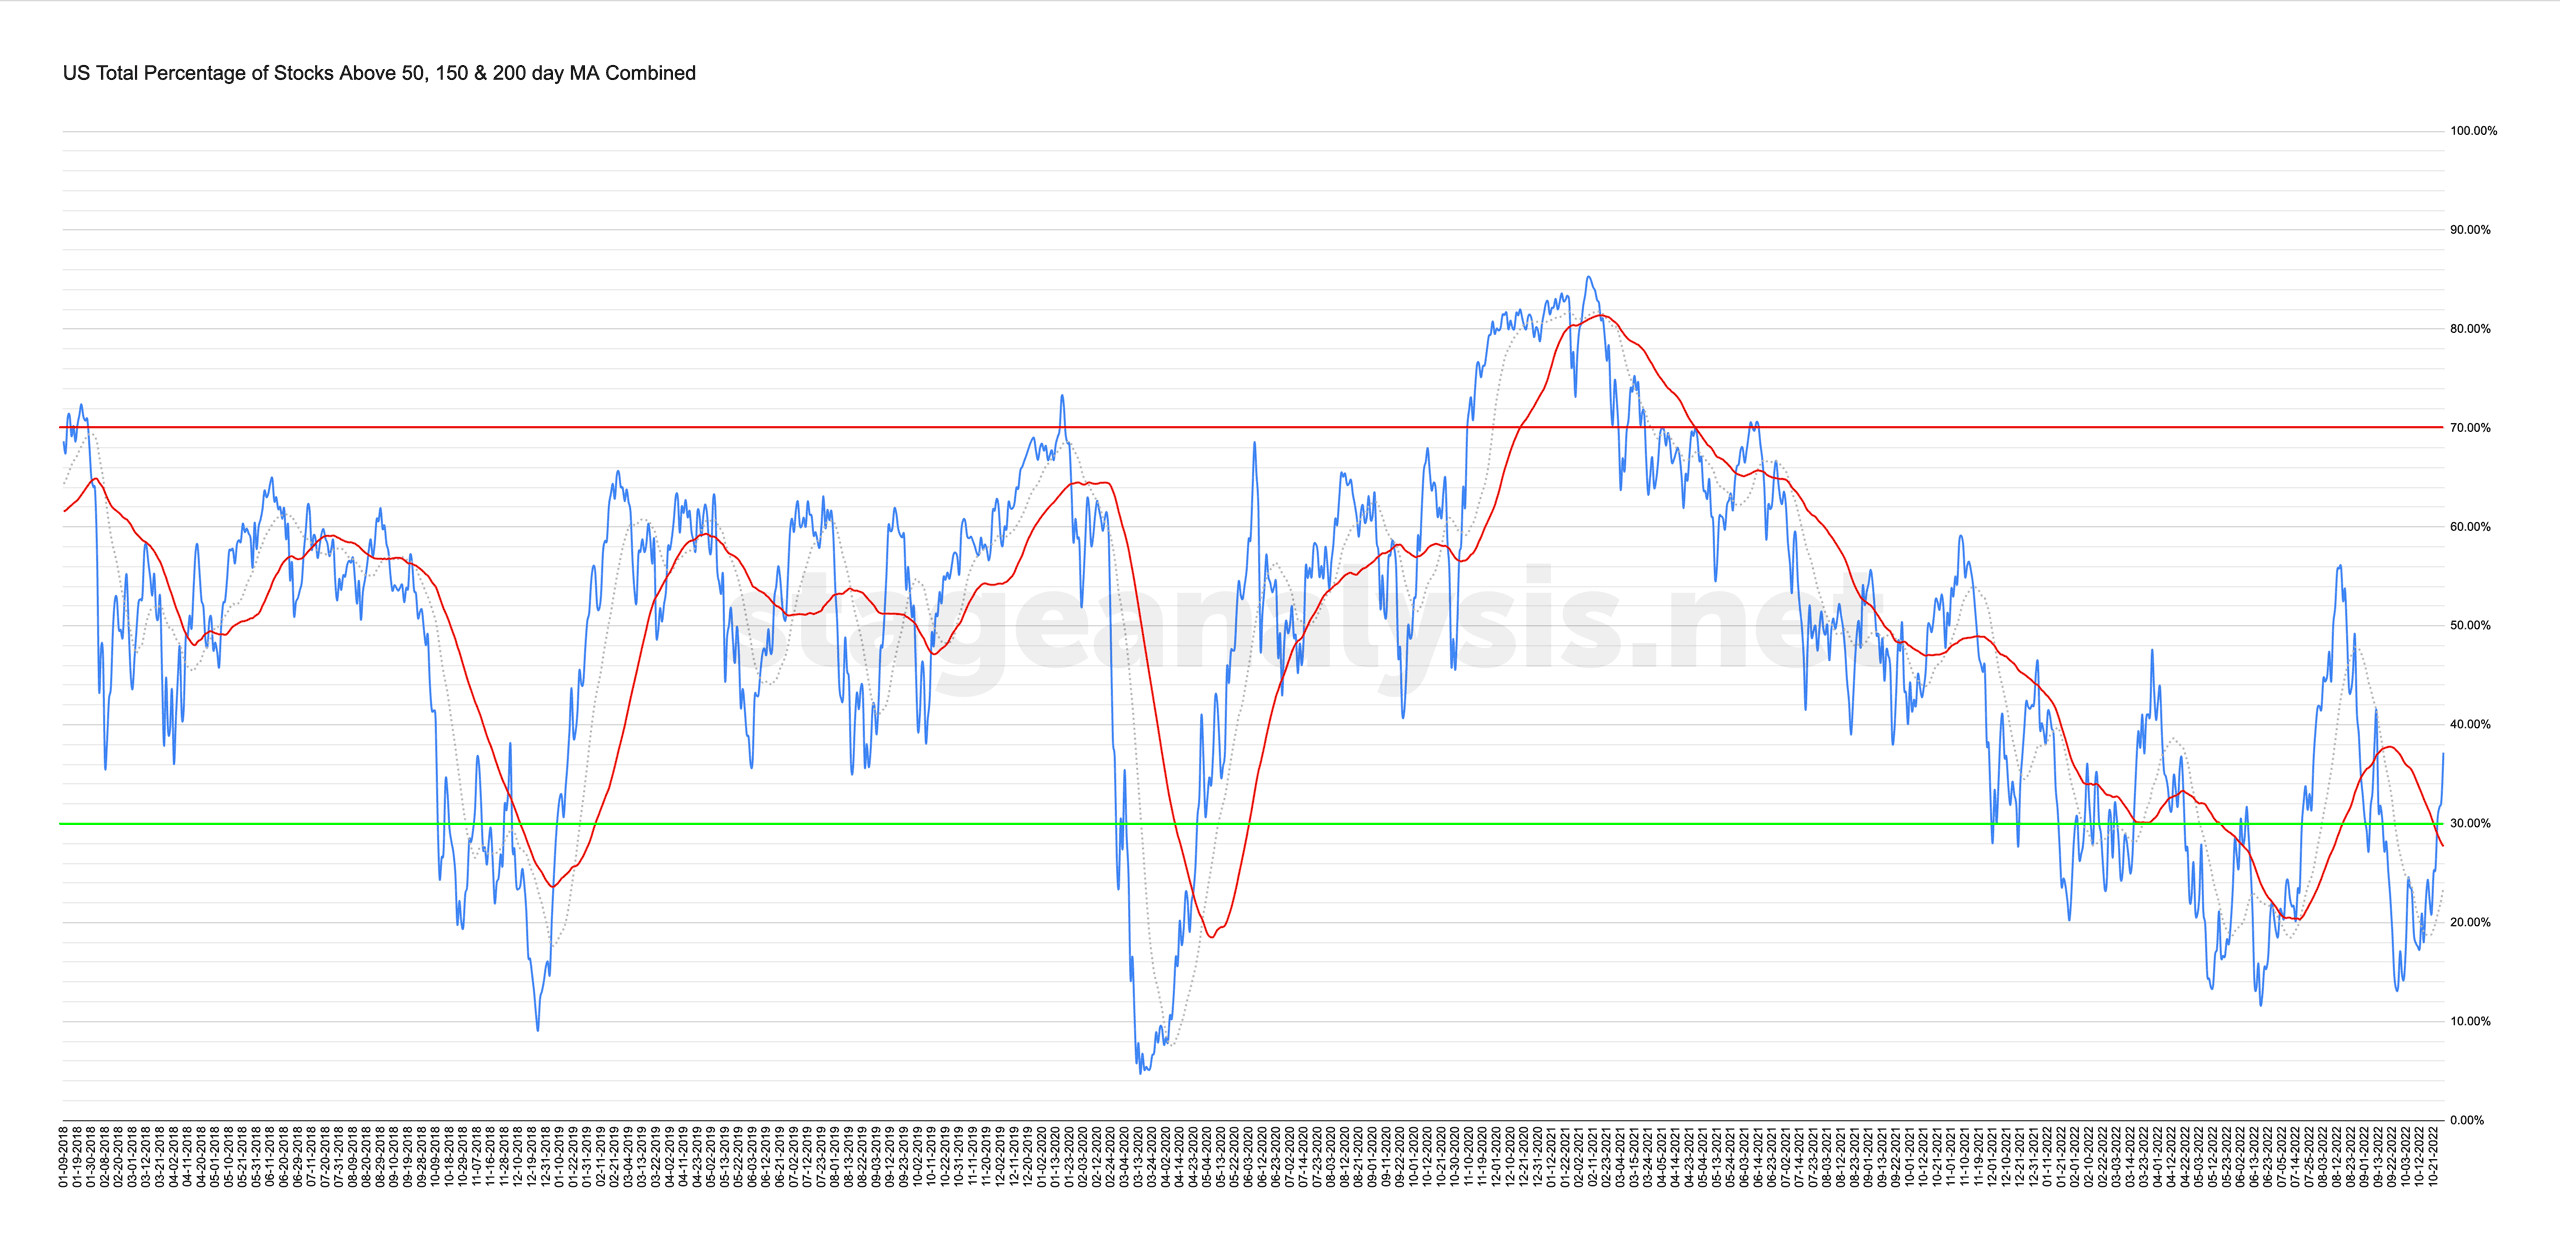
Market Breadth: Percentage of Stocks Above their 50 Day, 150 Day & 200 Day Moving Averages Combined
Custom Percentage of Stocks Above Their 50 Day, 150 Day & 200 Day Moving Averages Combined Market Breadth Charts for the Overall US Market, NYSE and Nasdaq for Market Timing and Strategy.
Read More
03 November, 2022
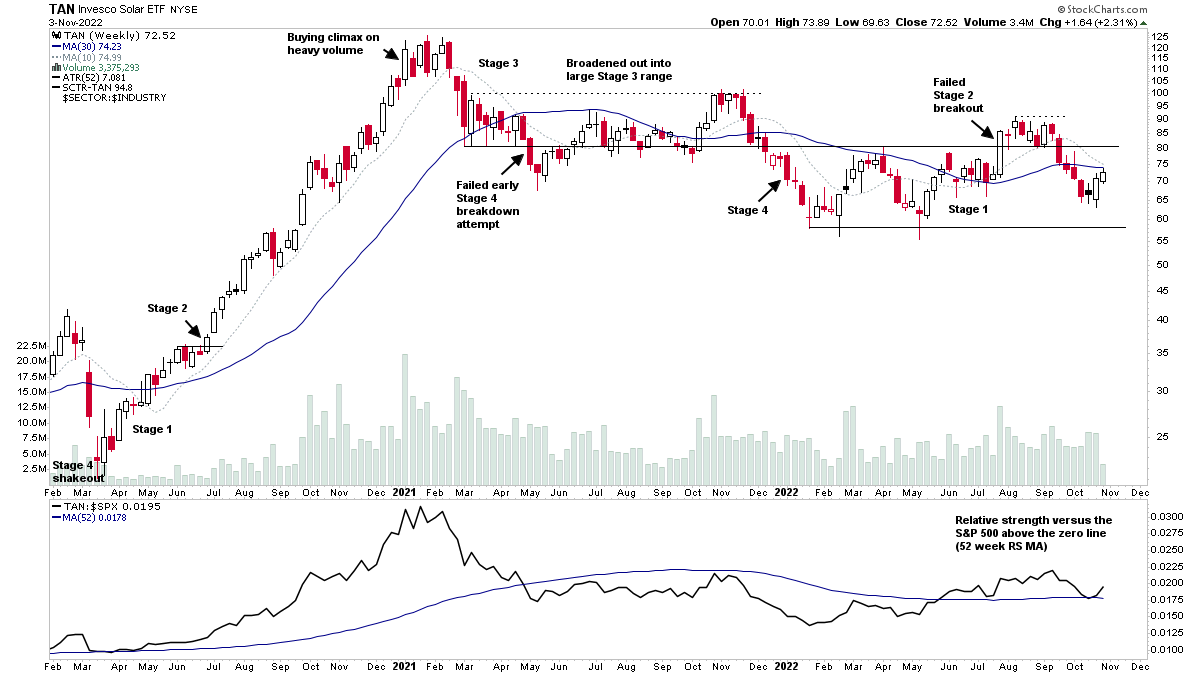
Stage Analysis Members Video – 03 November 2022 (1hr 2mins)
The members midweek video begins today with a group focus on the leading group Renewable Energy Equipment which made a Stage 2 continuation attempt today. Followed by analysis of the S&P 500 and VIX and the short-term Market Breadth charts...
Read More
30 October, 2022
Stage Analysis Members Video Part 3 – Market Breadth – 30 October 2022 (18 mins)
Part 3 of the regular members weekend video discussing the market breadth to determine the weight of evidence.
Read More
30 October, 2022
Stage Analysis Members Video Part 2 – US Market Review – 30 October 2022 (28 mins)
Part 2 of the regular members weekend video discussing the market, industry groups and market breadth to determine the weight of evidence.
Read More
29 October, 2022
Market Breadth: Percentage of Stocks Above their 50 Day, 150 Day & 200 Day Moving Averages Combined
Custom Percentage of Stocks Above Their 50 Day, 150 Day & 200 Day Moving Averages Combined Market Breadth Charts for the Overall US Market, NYSE and Nasdaq for Market Timing and Strategy.
Read More
26 October, 2022
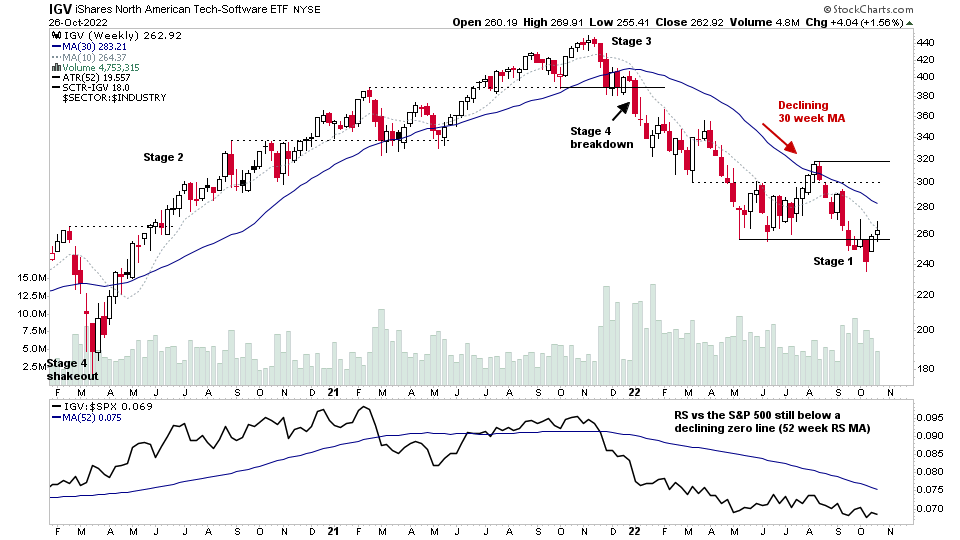
Stage Analysis Members Midweek Video | Group Focus: Software – 26 October 2022
The members midweek video this week begins with a special group focus on the Software group, which I've talked about in the Stage Analysis videos a number of times over the summer months, as the stocks in the group have gradually moved towards Stage 1 type behaviour...
Read More
23 October, 2022
Stage Analysis Members Video Part 2 – 23 October 2022 (58 mins)
Part 2 of the regular members weekend video discussing the market, commodities, industry groups and market breadth to determine the weight of evidence.
Read More