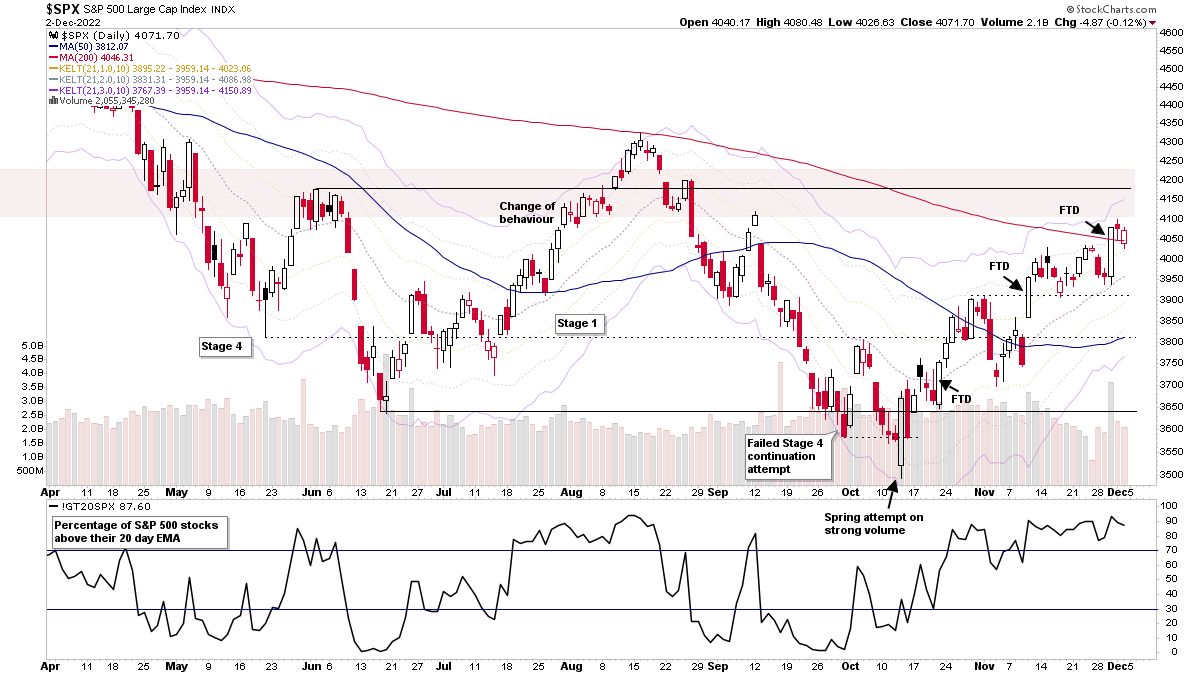
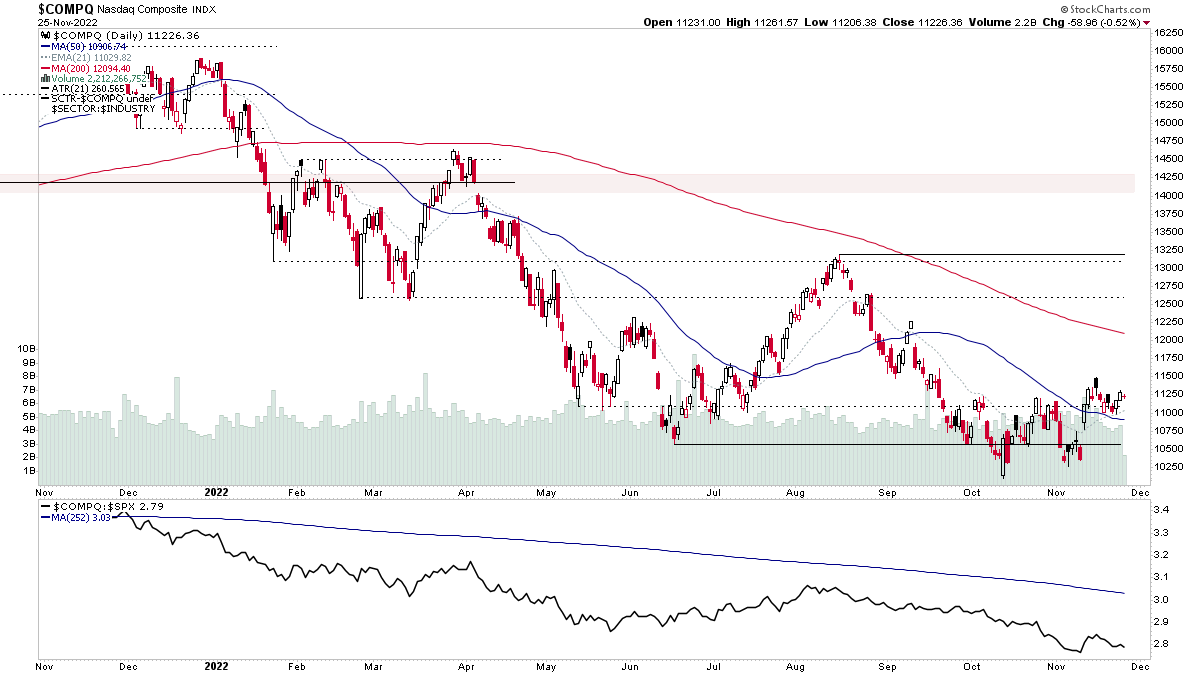
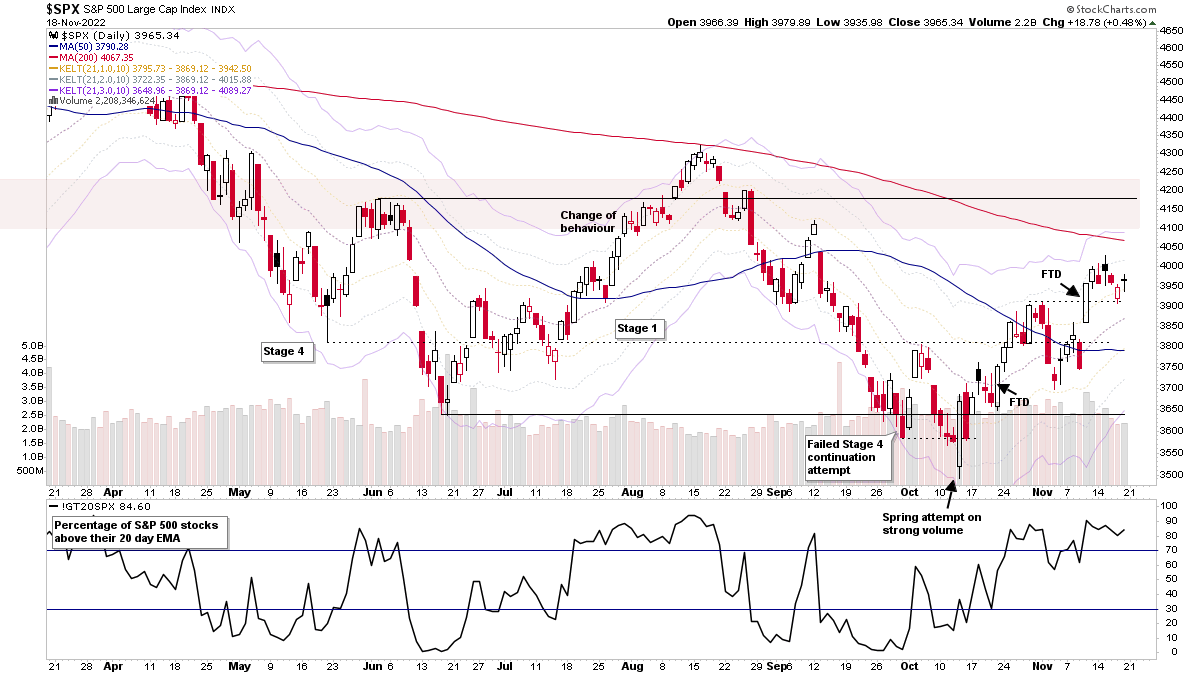
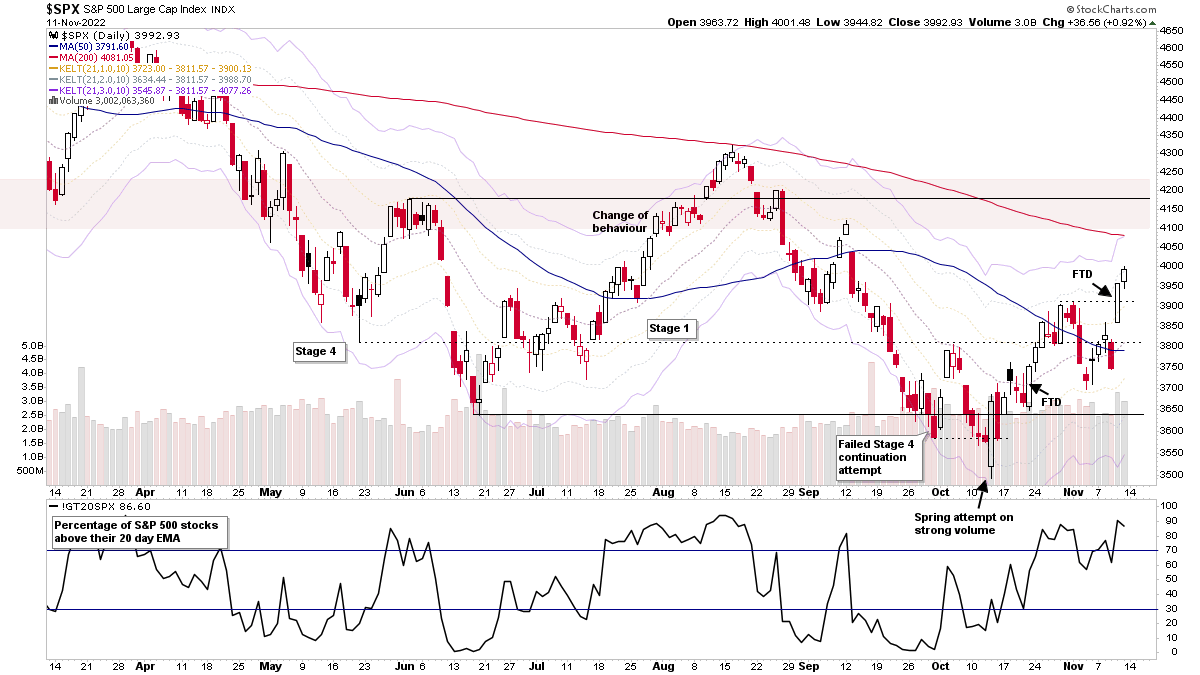
The Stage Analysis members weekend video discussing the market indexes, Dollar index, commodities, industry groups relative strength, IBD industry group bell curve – bullish percent, market breadth charts to determine the weight of evidence, Stage 2 breakout attempts and the US watchlist stocks in detail on multiple timeframes.
Read More
Blog
04 December, 2022
Stage Analysis Members Video – 4 December 2022 (1hr 27mins)
04 December, 2022
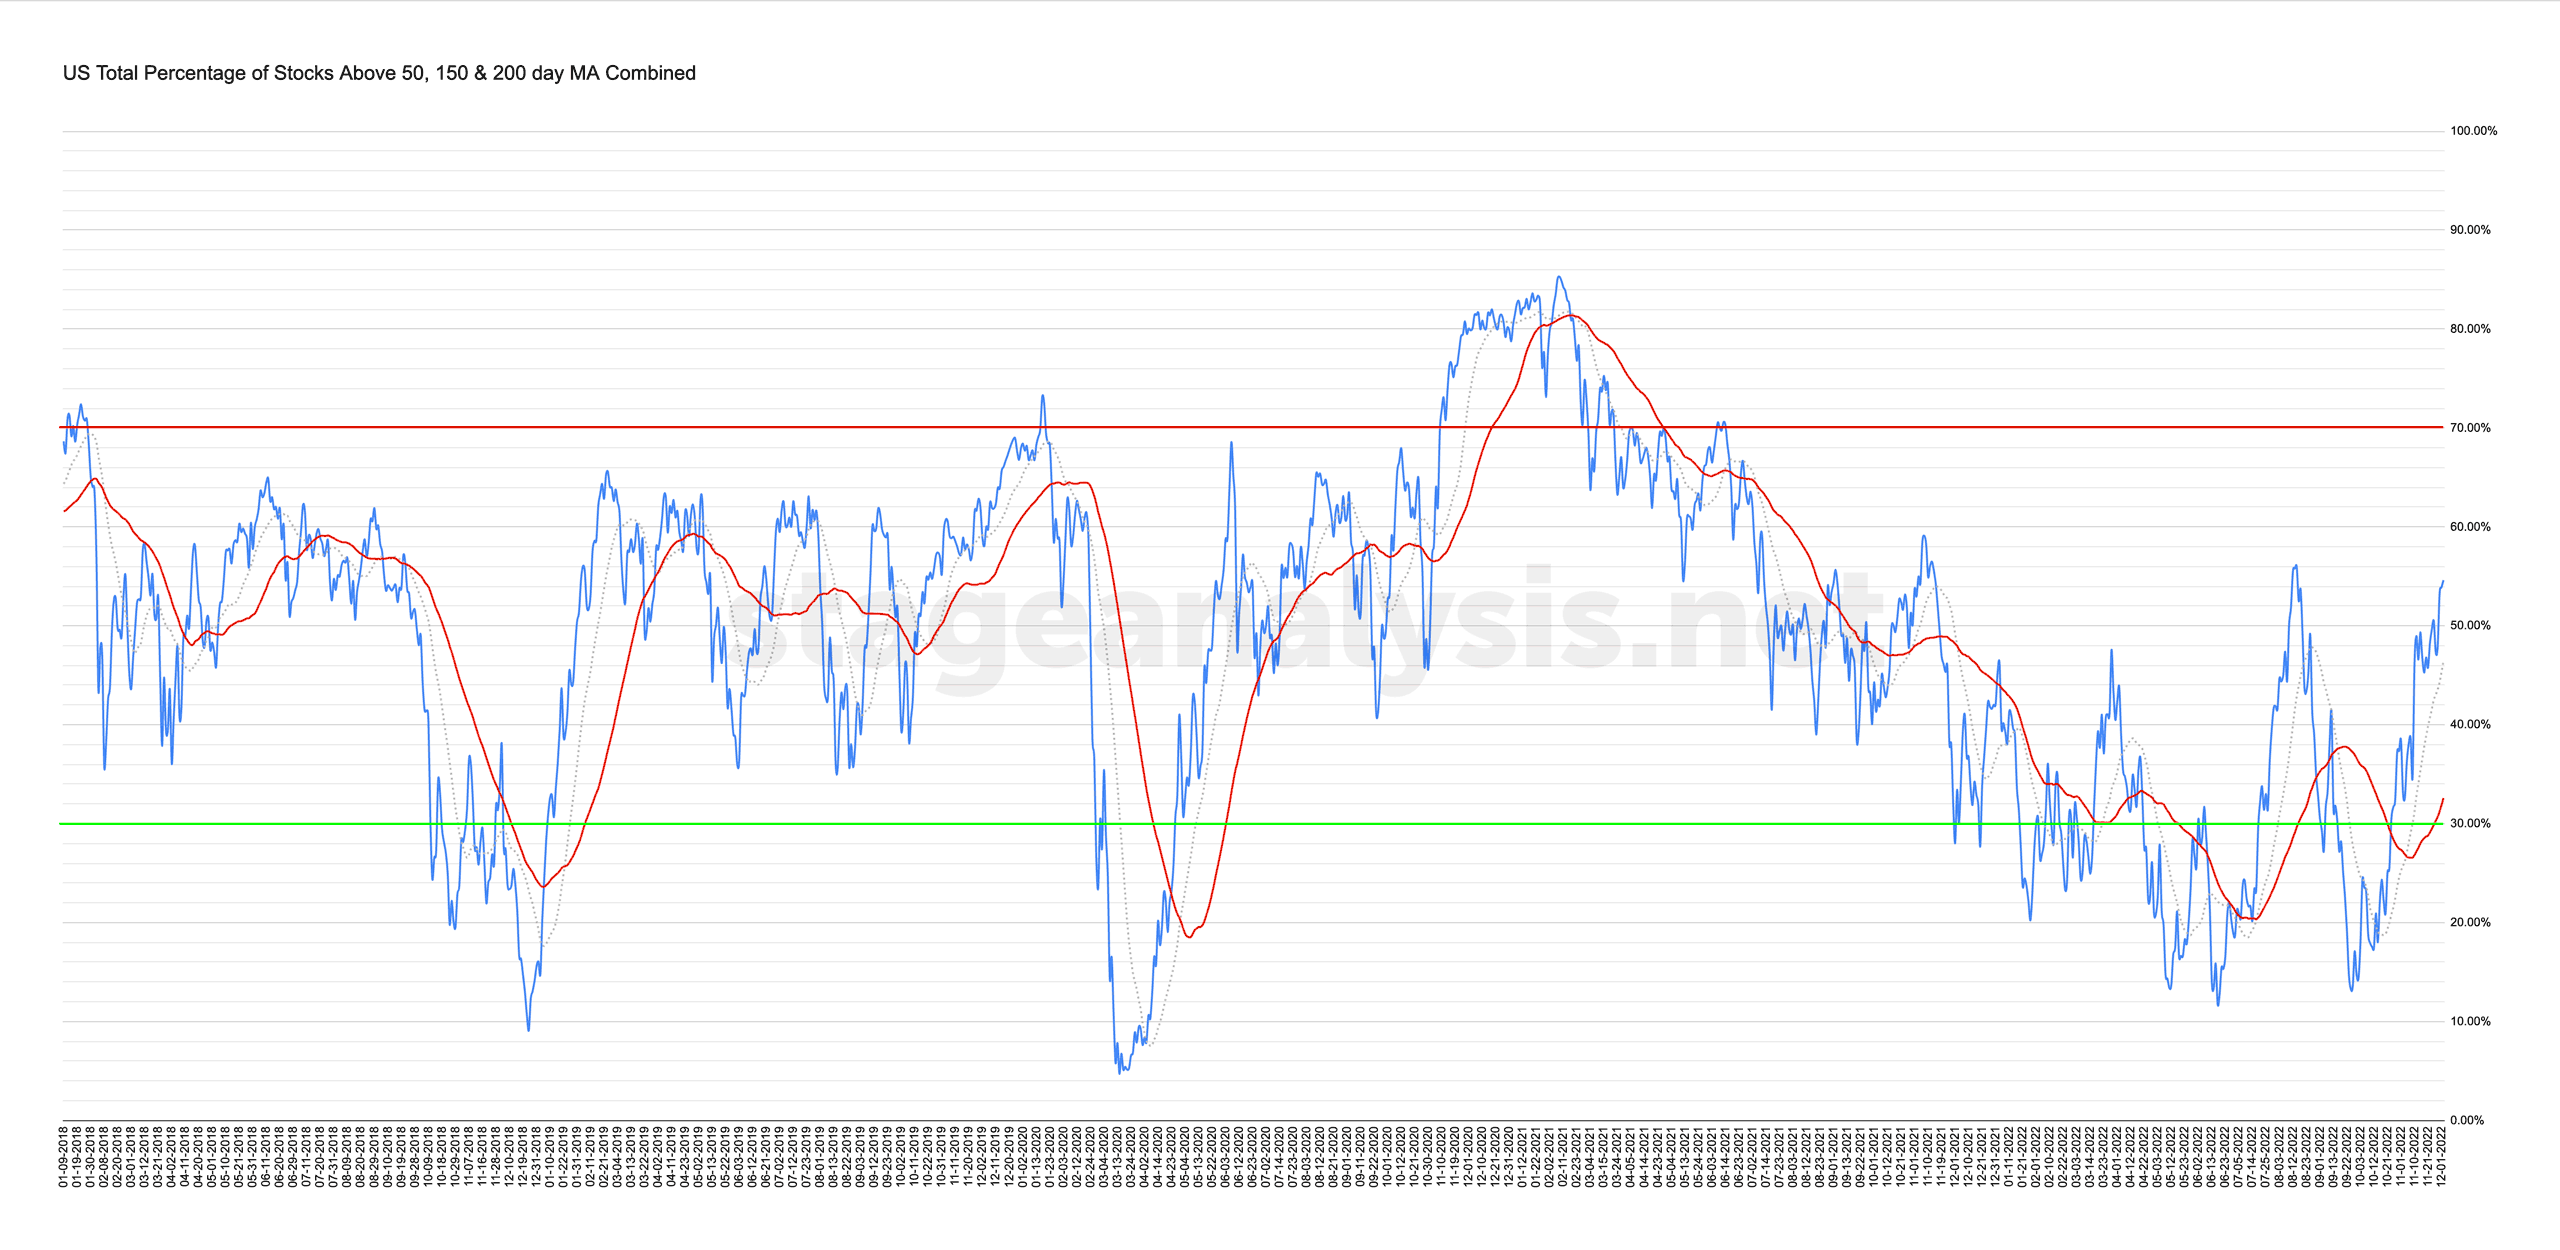
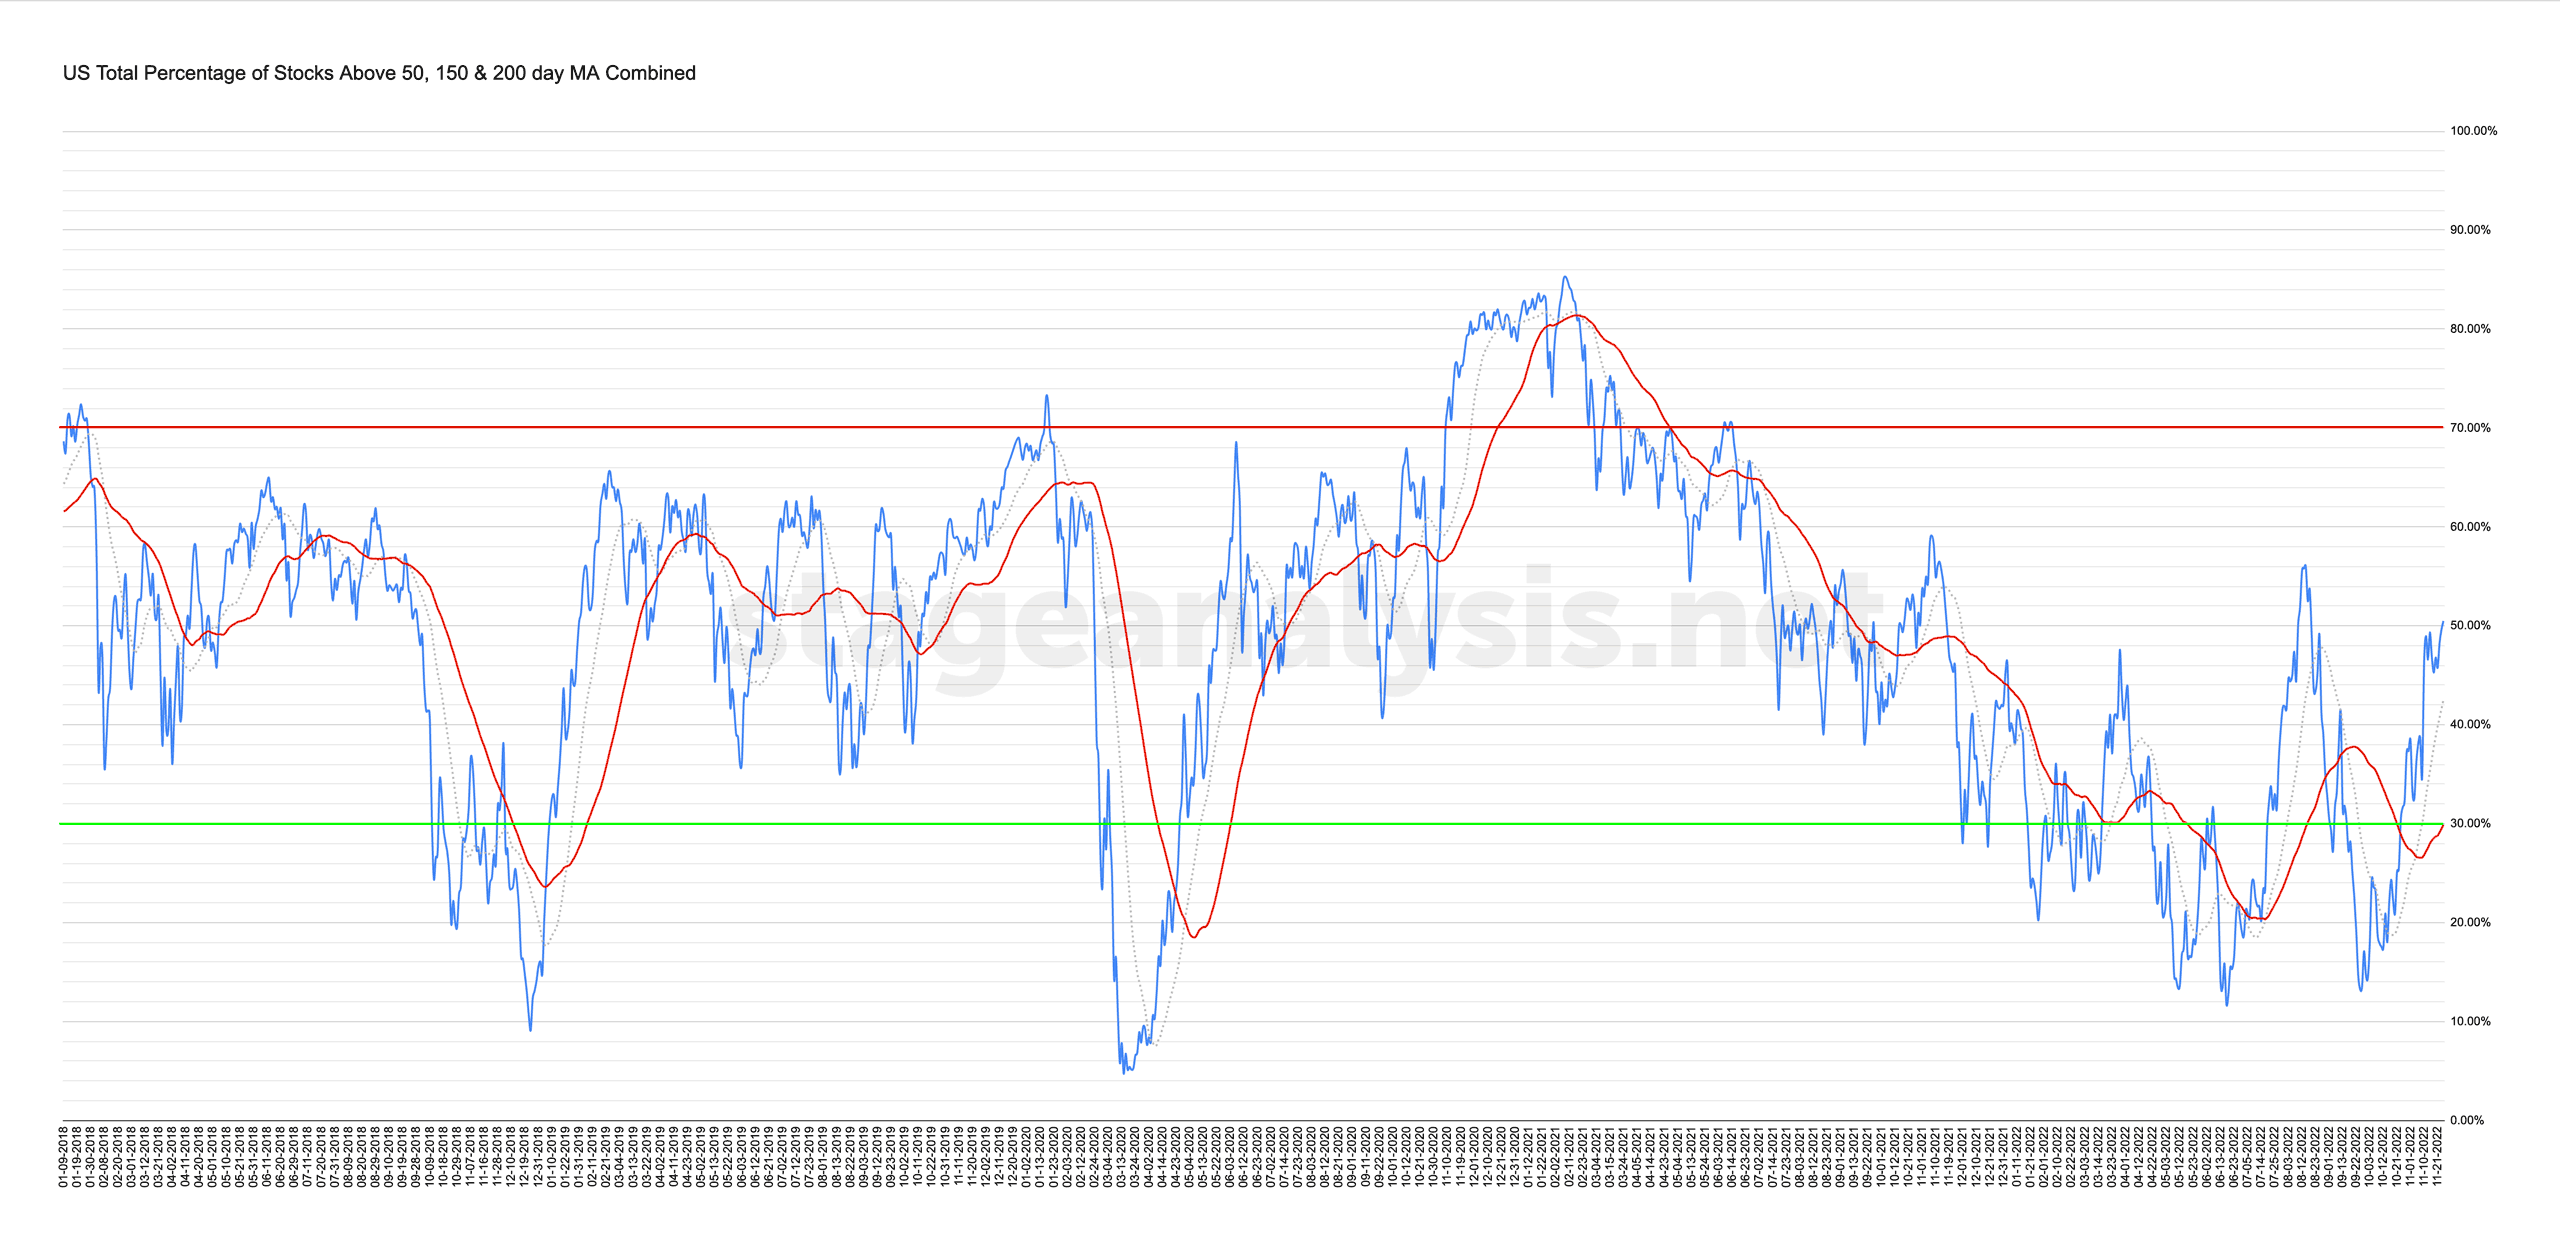
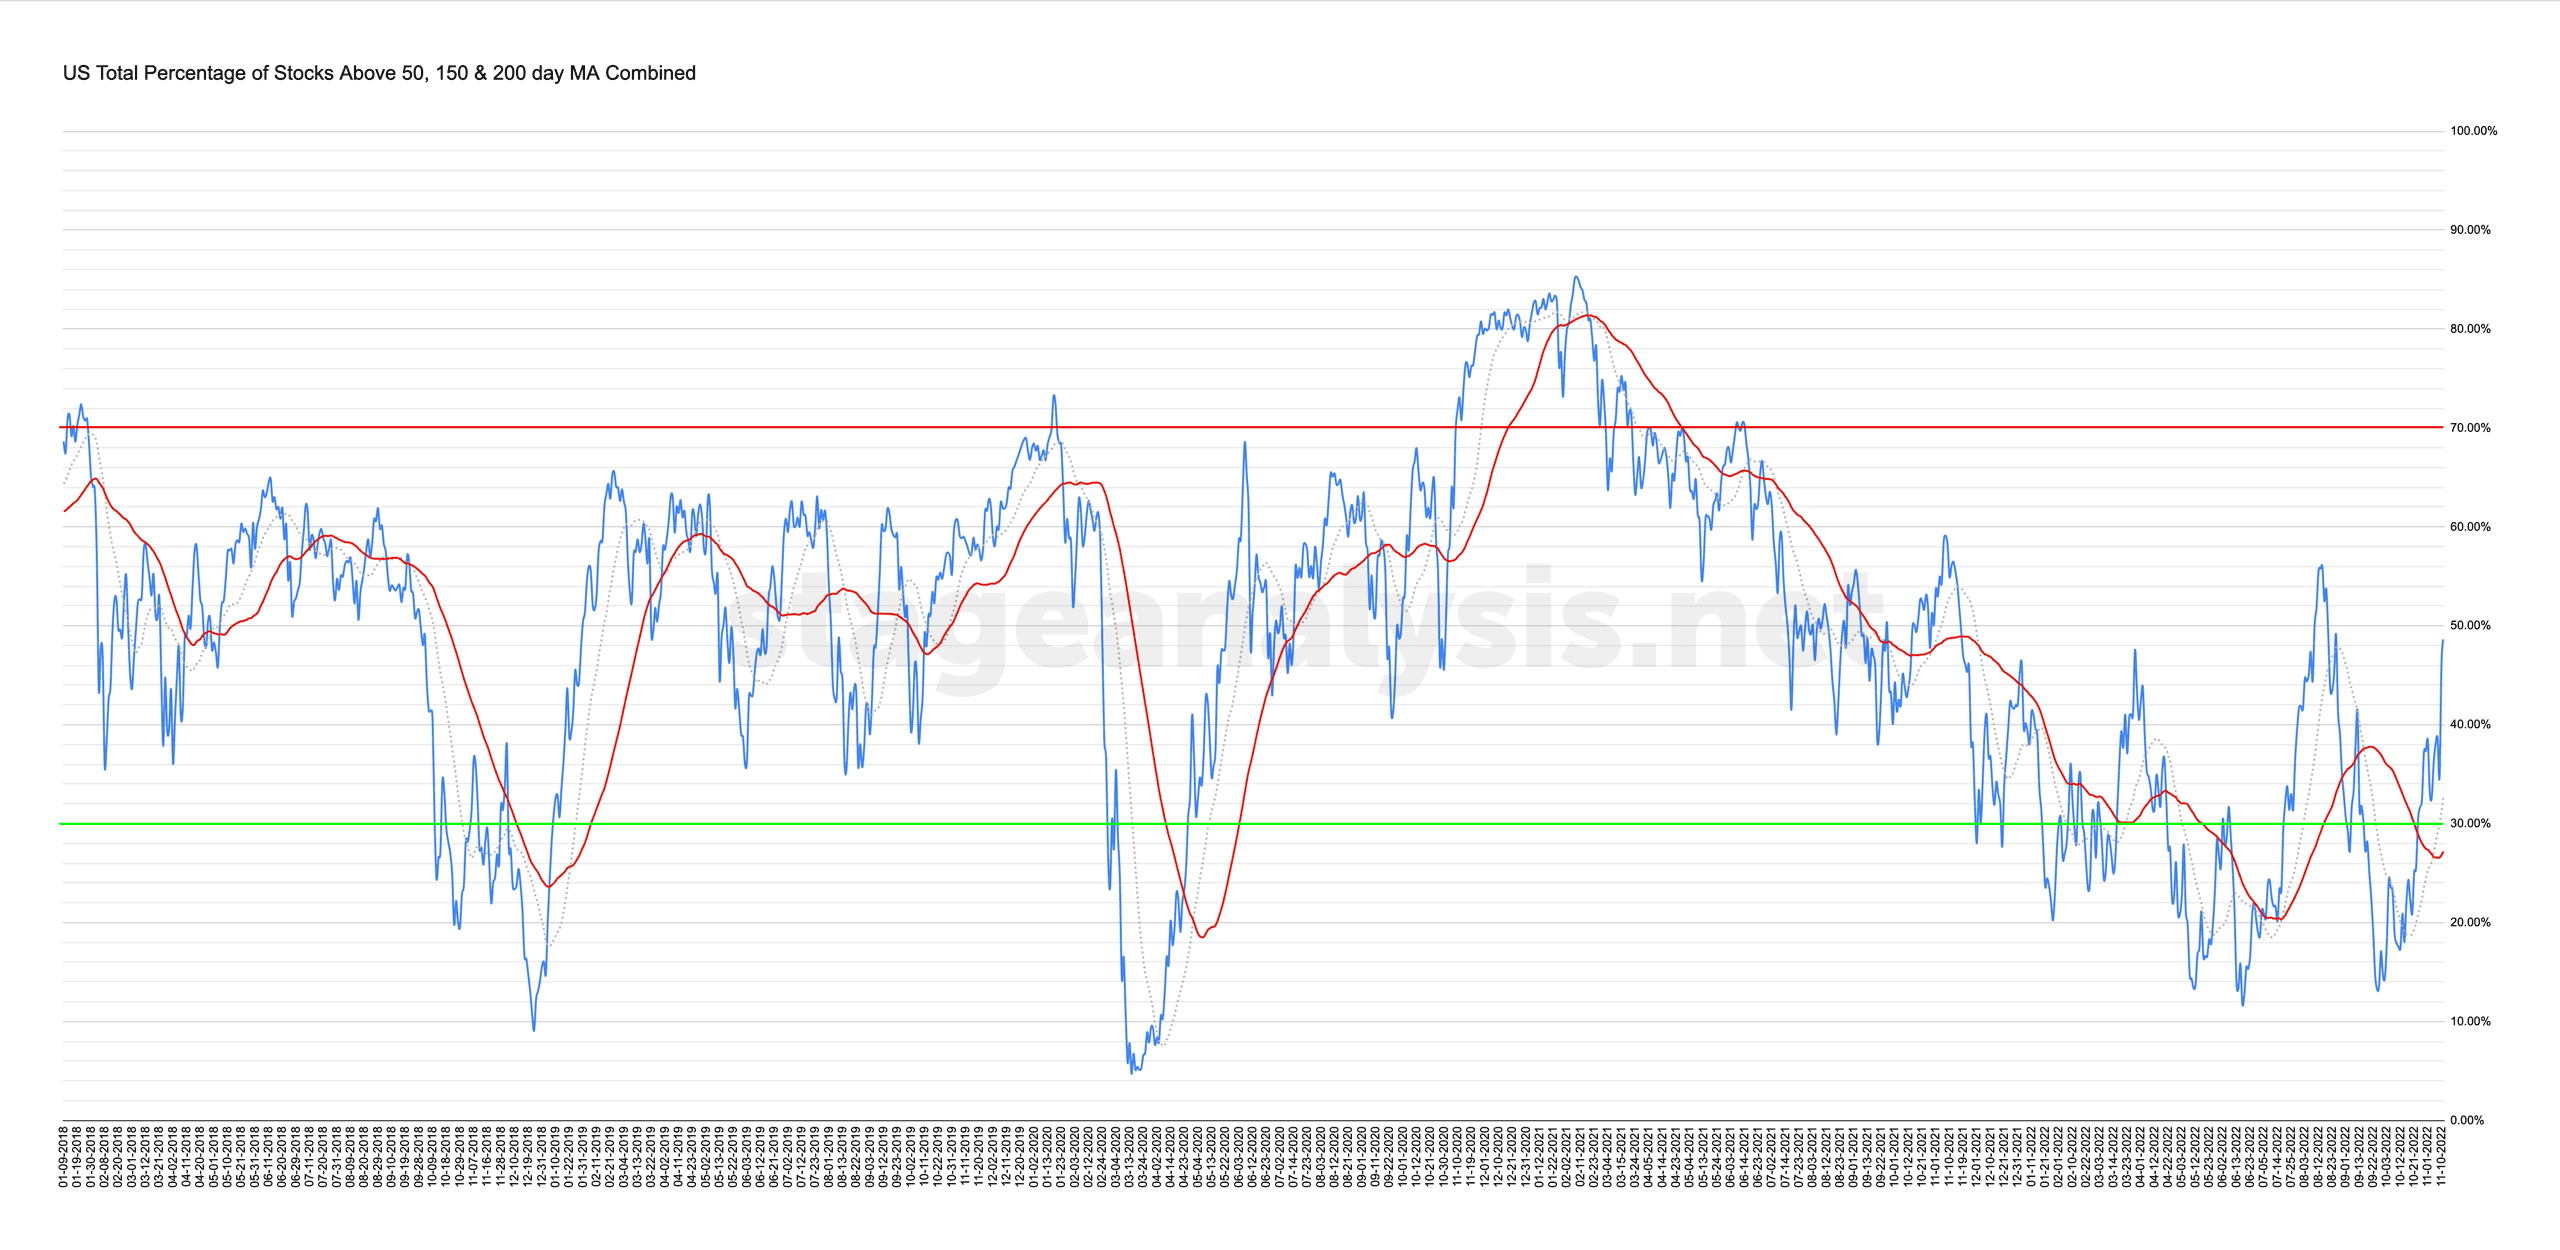
Market Breadth: Percentage of Stocks Above their 50 Day, 150 Day & 200 Day Moving Averages Combined
Custom Percentage of Stocks Above Their 50 Day, 150 Day & 200 Day Moving Averages Combined Market Breadth Charts for the Overall US Market, NYSE and Nasdaq for Market Timing and Strategy.
Read More
30 November, 2022
Stage Analysis Members Video – 30 November 2022 (56 mins)
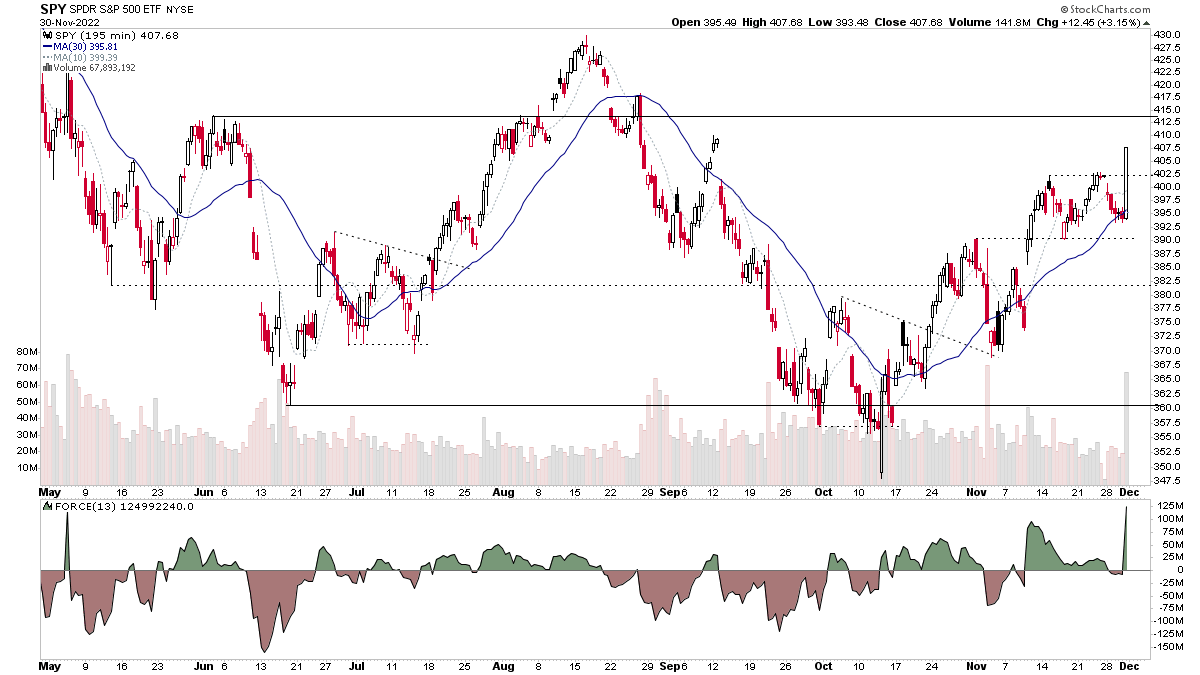
The Stage Analysis members midweek video discussing the market indexes, sector breadth, short-term market breadth and the US watchlist stocks in more detail with live markups.
Read More
28 November, 2022
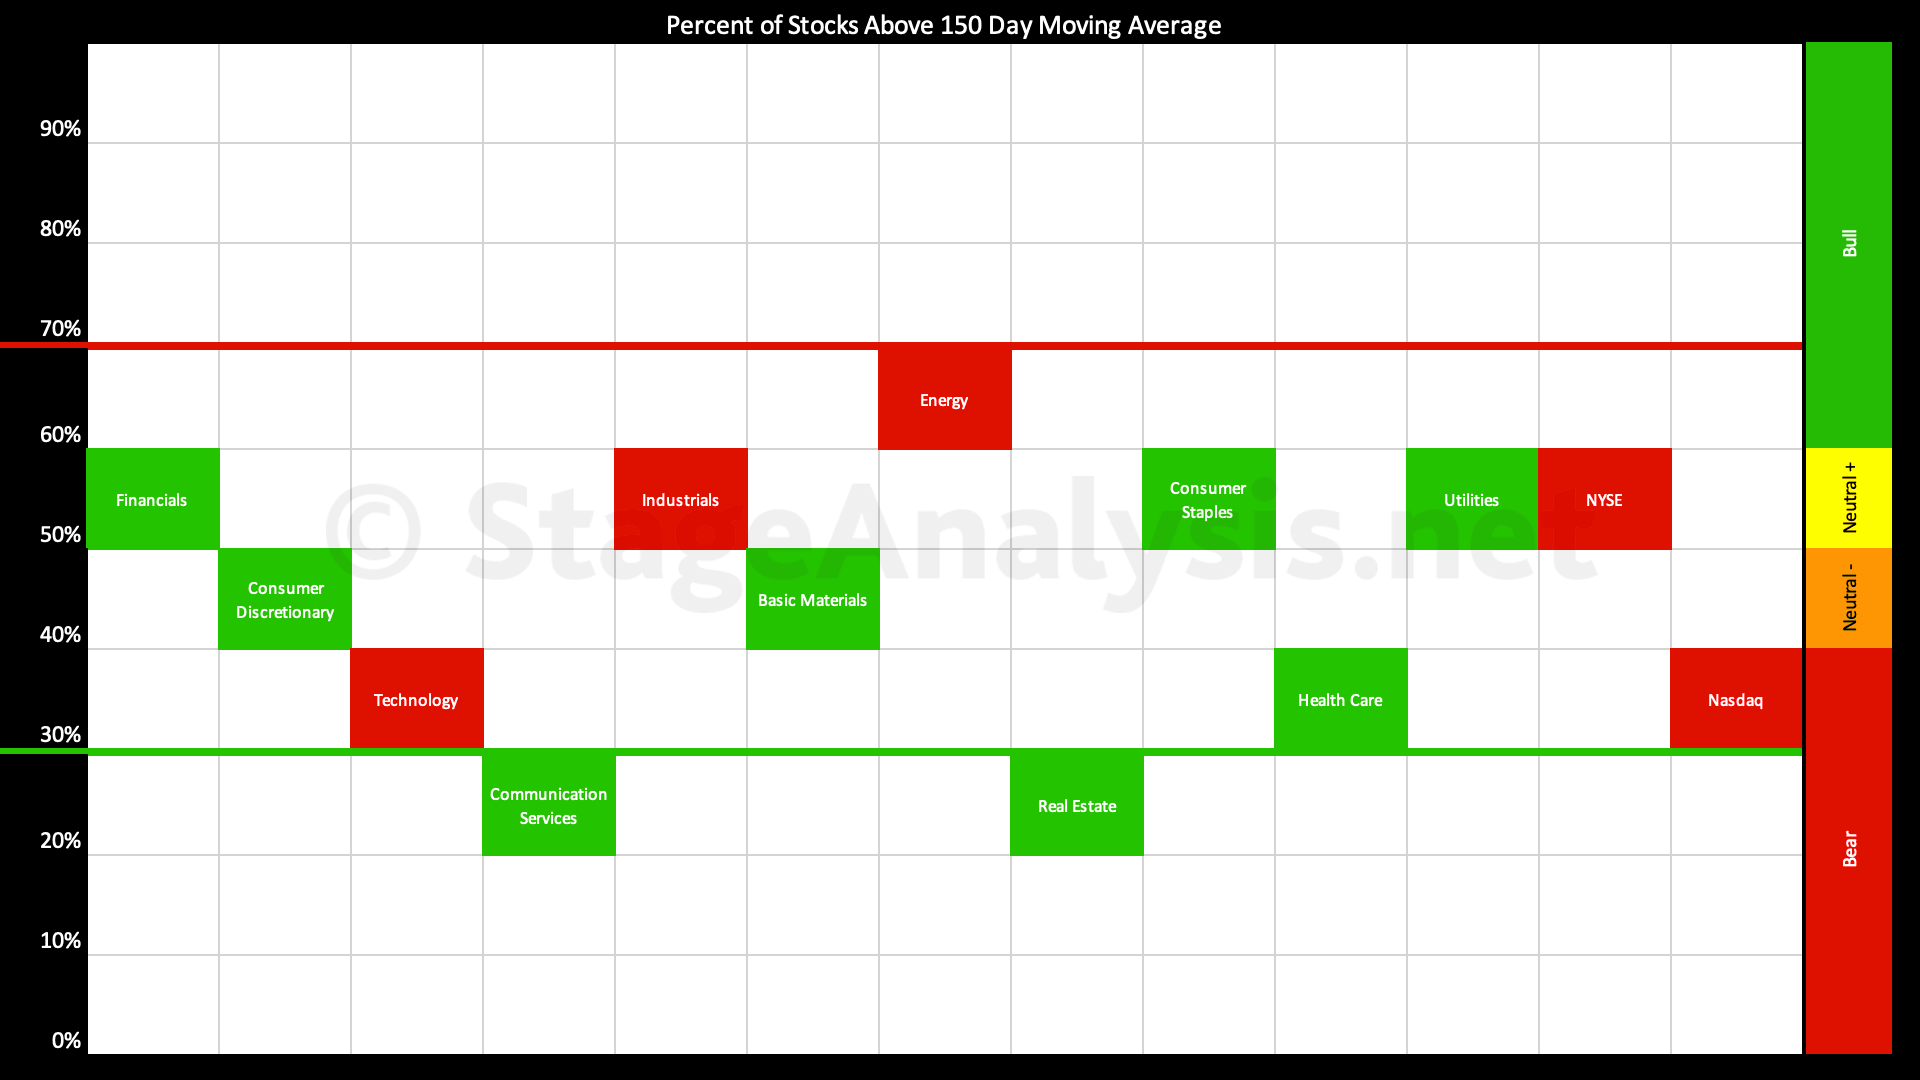
Sector Breadth: Percentage of US Stocks Above Their 150 day (30 Week) Moving Averages
The Percentage of US Stocks Above Their 150 day Moving Averages in the 11 major sectors has continued to improve since my previous post on the 9th November, which was the day before the secondary Follow Through Day (FTD) in multiple of the major US stock market indexes.
Read More
27 November, 2022
Stage Analysis Members Video – 27 November 2022 (1hr 24mins)
The Stage Analysis members weekend video discussing the market indexes, Dollar index, commodities, industry groups relative strength, IBD industry group bell curve – bullish percent, market breadth charts to determine the weight of evidence, this weeks Stage 2 breakout attempts and the US watchlist stocks in detail on multiple timeframes.
Read More
26 November, 2022
Market Breadth: Percentage of Stocks Above their 50 Day, 150 Day & 200 Day Moving Averages Combined
Custom Percentage of Stocks Above Their 50 Day, 150 Day & 200 Day Moving Averages Combined Market Breadth Charts for the Overall US Market, NYSE and Nasdaq for Market Timing and Strategy.
Read More
20 November, 2022
Stage Analysis Members Video – 20 November 2022 (1hr 32mins)
The members weekend video discussing the market indexes, industry groups relative strength, IBD industry group bell curve – bullish percent, market breadth charts to determine the weight of evidence, Stage 2 breakout attempts in multiple stocks and the US watchlist stocks in more detail.
Read More
19 November, 2022
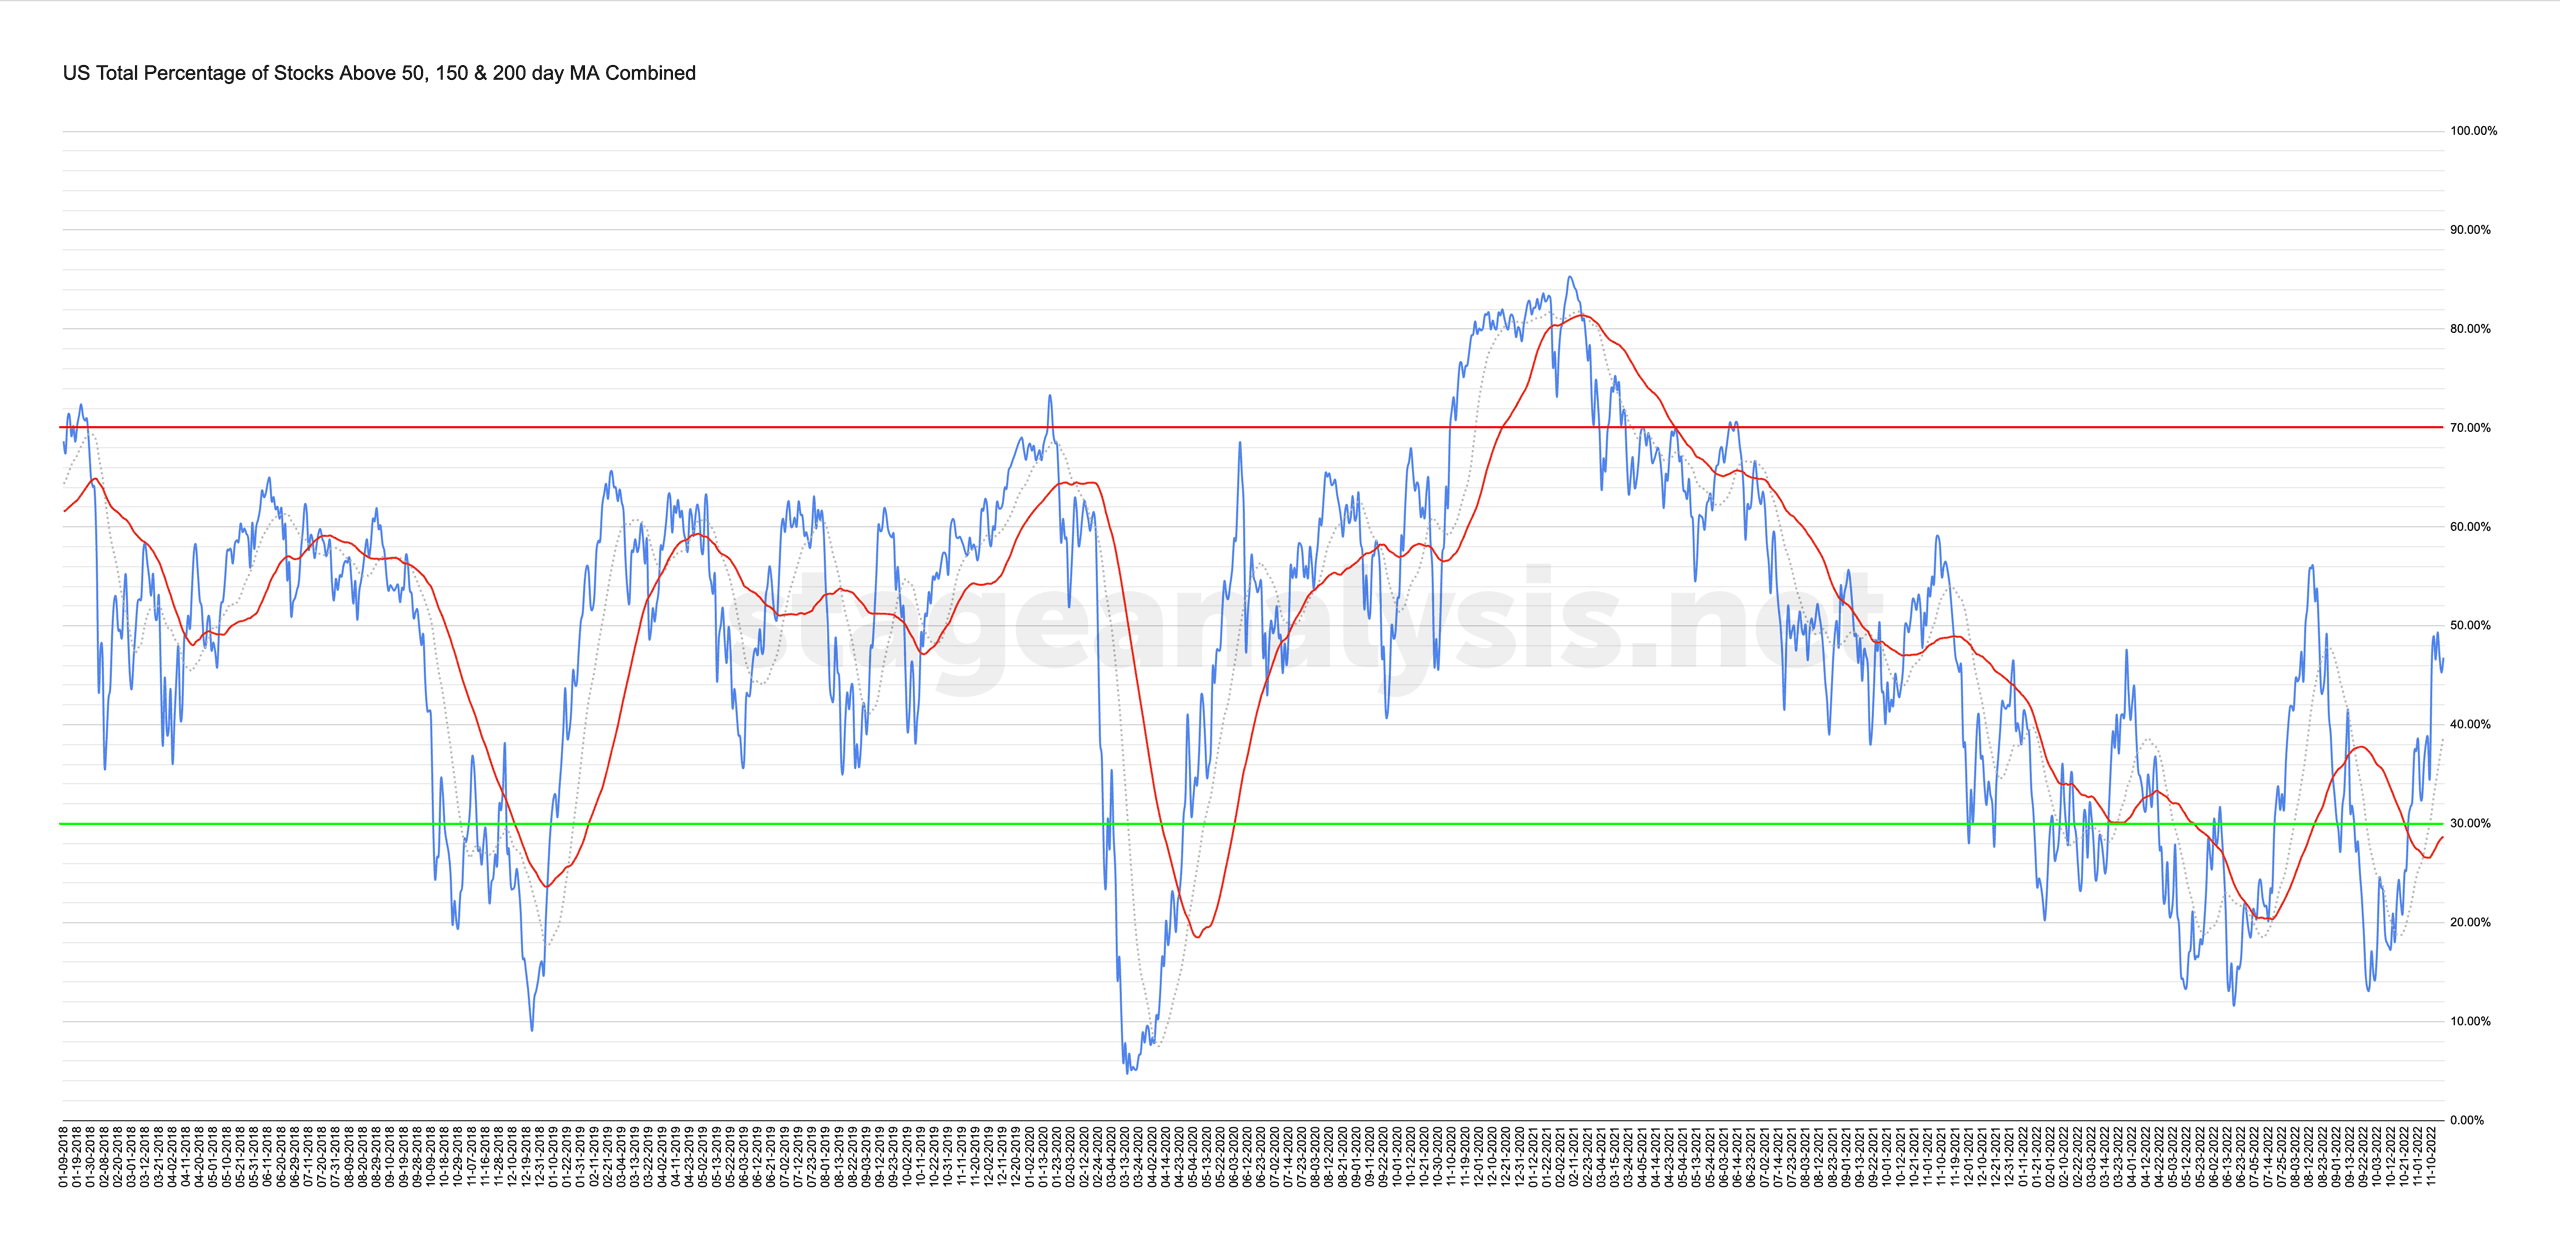
Market Breadth: Percentage of Stocks Above their 50 Day, 150 Day & 200 Day Moving Averages Combined
Custom Percentage of Stocks Above Their 50 Day, 150 Day & 200 Day Moving Averages Combined Market Breadth Charts for the Overall US Market, NYSE and Nasdaq for Market Timing and Strategy.
Read More
13 November, 2022
Stage Analysis Members Video – 13 November 2022 (1hr 21mins)
The Stage Analysis members weekend video, this week discussing the significant bar in the US Dollar Index and price and volume action in the major stock market indexes. Plus Stage Analysis of the individual sectors and the Industry Groups Relative Strength Rankings, with a look in more depth of some of the groups making the strongest moves. Also discussion of the strong shift in the IBD Industry Groups Bell Curve – Bullish Percent data, and the Market Breadth Update to help to determine the current Weight of Evidence. And finishing with live markups of the weekends US Stocks Watchlist.
Read More
12 November, 2022
Market Breadth: Percentage of Stocks Above their 50 Day, 150 Day & 200 Day Moving Averages Combined
Custom Percentage of Stocks Above Their 50 Day, 150 Day & 200 Day Moving Averages Combined Market Breadth Charts for the Overall US Market, NYSE and Nasdaq for Market Timing and Strategy.
Read More

