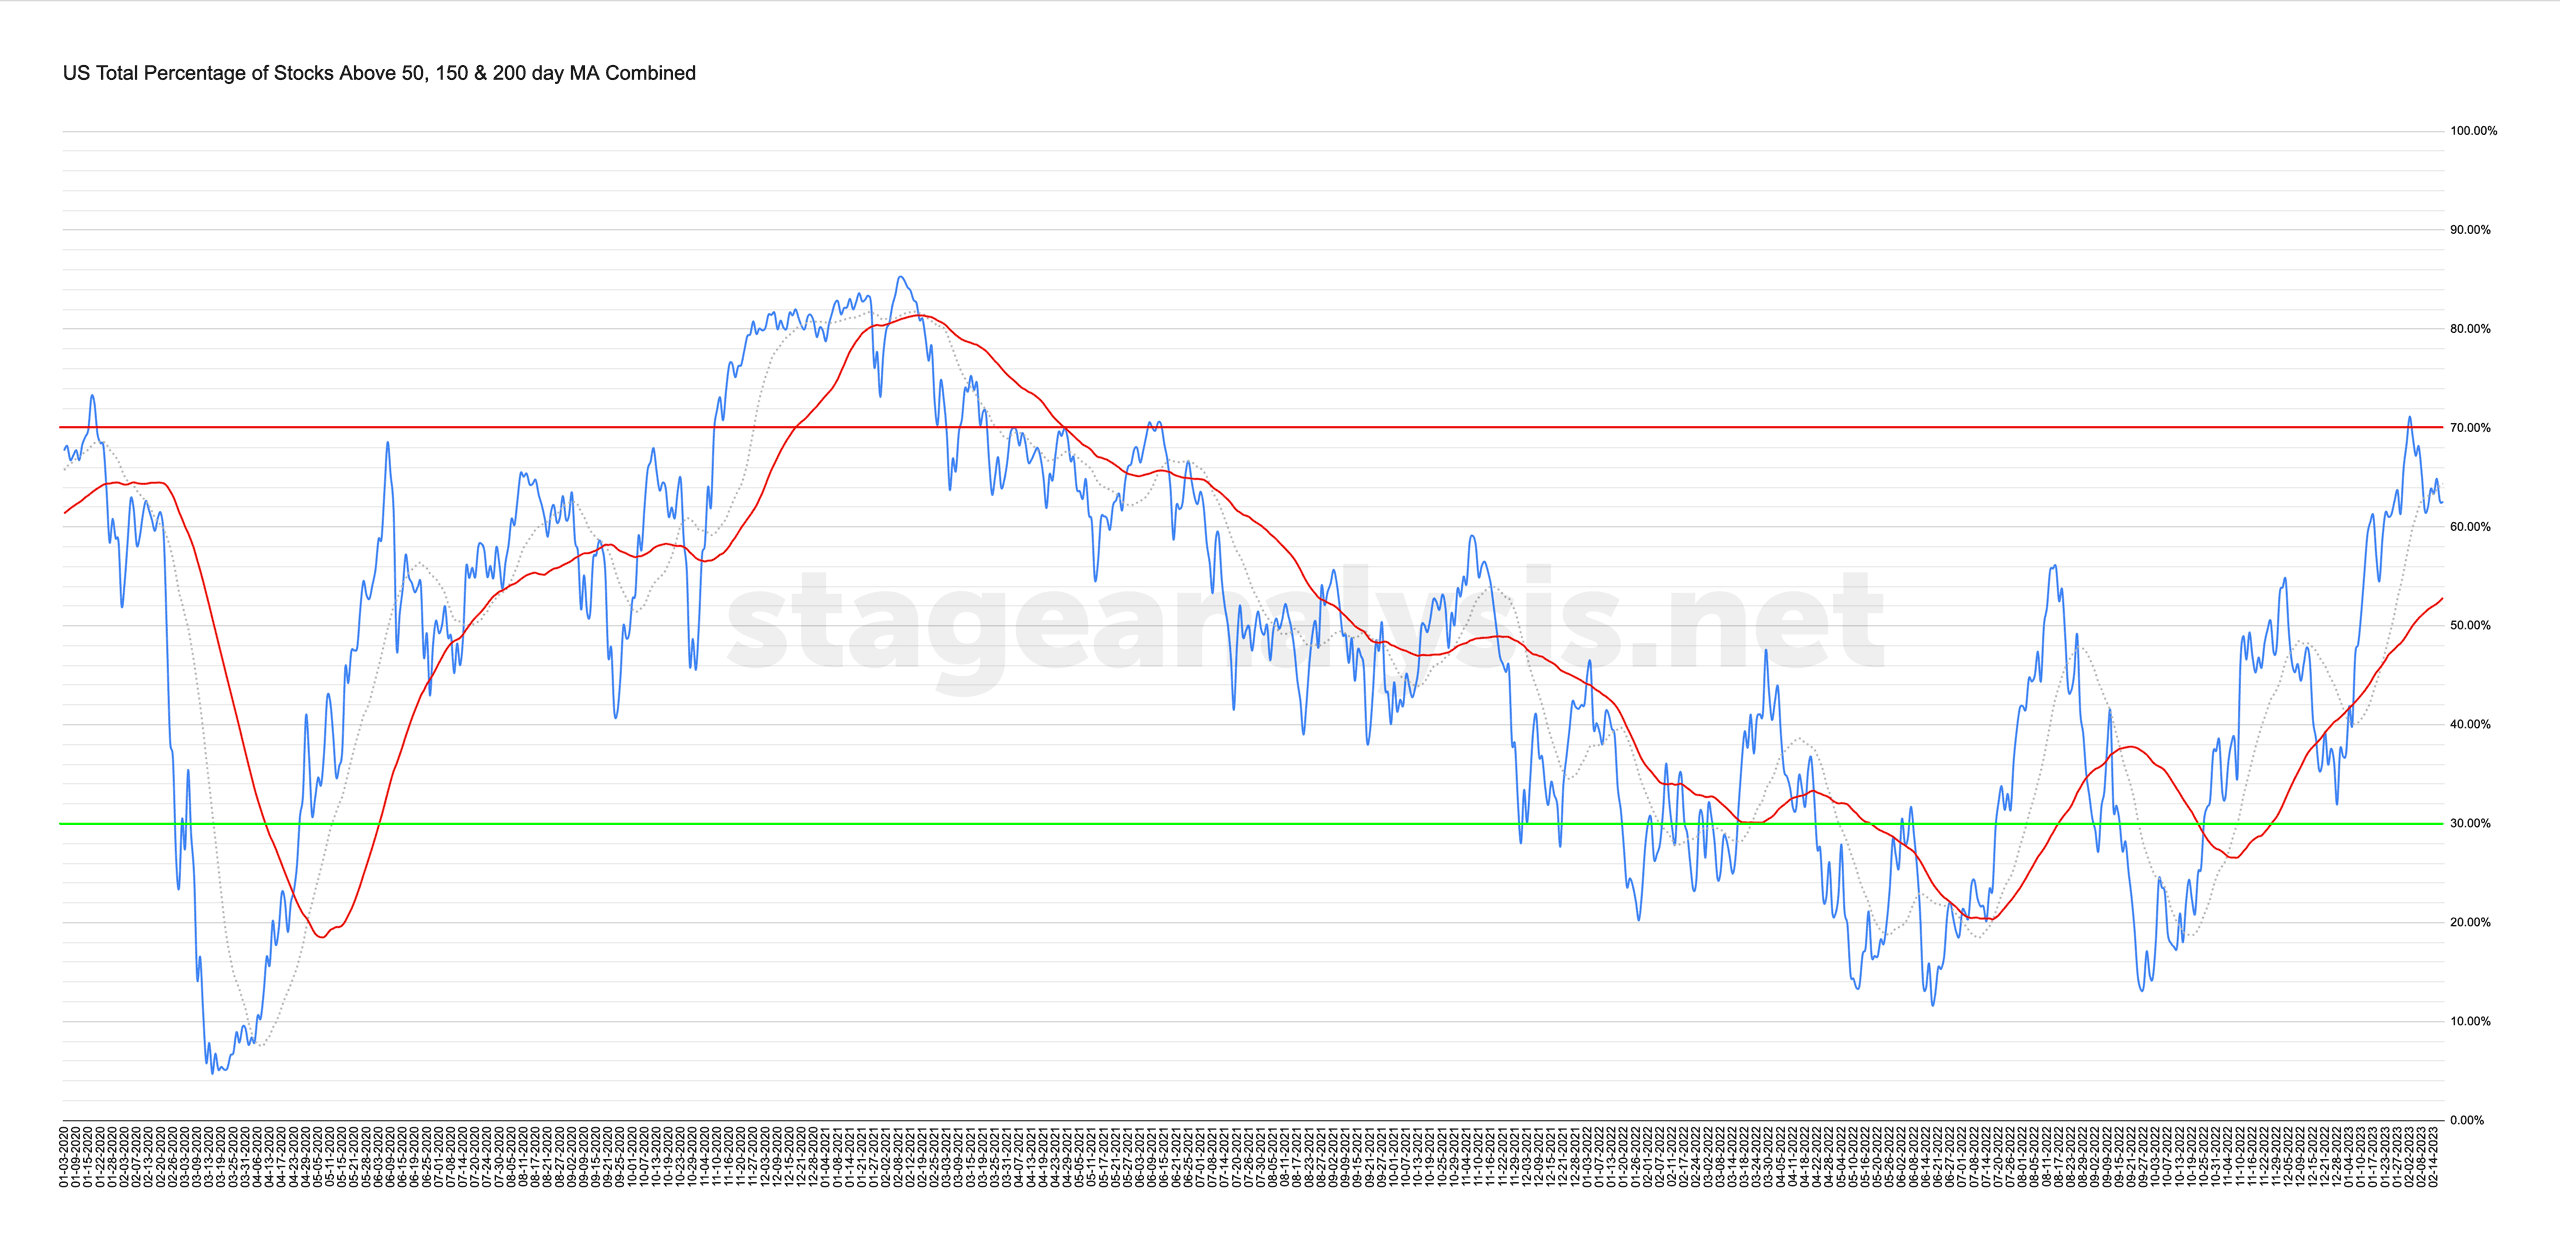
Custom Percentage of Stocks Above Their 50 Day, 150 Day & 200 Day Moving Averages Combined Market Breadth Charts for the Overall US Market, NYSE and Nasdaq for Market Timing and Strategy.
Read More

Blog
26 February, 2023
Stage Analysis Members Video – 26 February 2023 (1hr 22mins)
The Stage Analysis members weekend video featuring early Stage 2 and developing Stage 1 stocks, watchlist stocks in focus with upcoming earnings in the coming week. Plus the regular content with the major US Indexes, the futures charts, US Industry Groups RS Rankings, IBD Industry Groups Bell Curve - Bullish Percent, the Market Breadth Update to help to determine the Weight of Evidence.
Read More
25 February, 2023
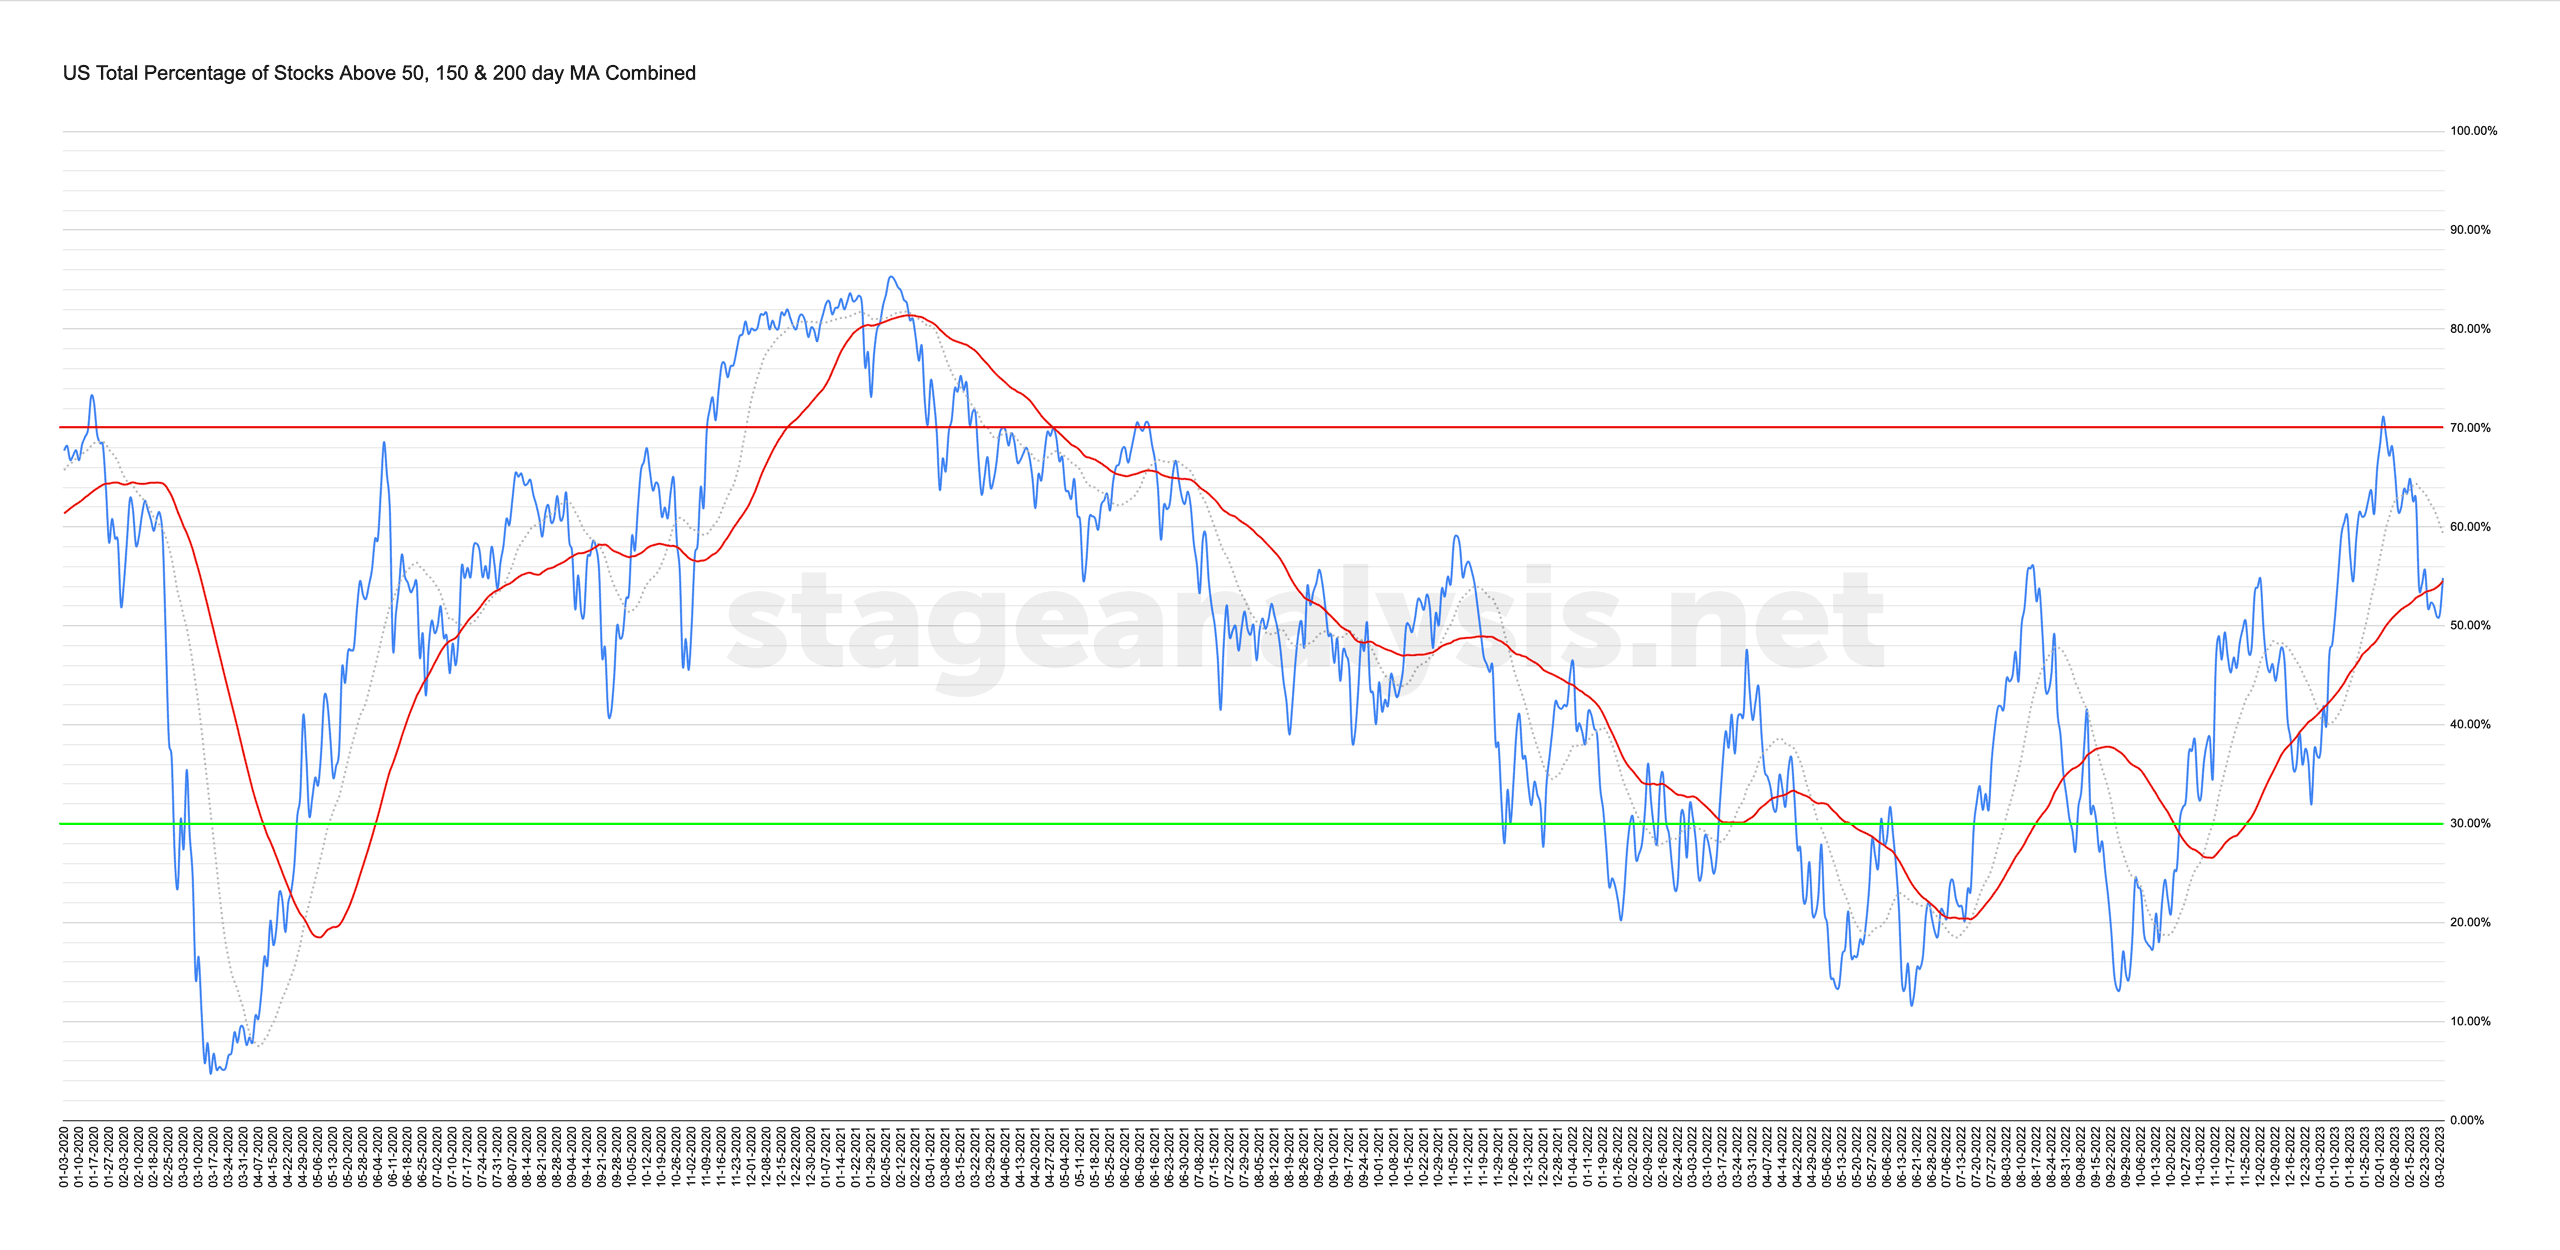
Market Breadth: Percentage of Stocks Above their 50 Day, 150 Day & 200 Day Moving Averages Combined
Custom Percentage of Stocks Above Their 50 Day, 150 Day & 200 Day Moving Averages Combined Market Breadth Charts for the Overall US Market, NYSE and Nasdaq for Market Timing and Strategy.
Read More
23 February, 2023
Stage Analysis Members Video – 23 February 2023 (51 mins)
The Stage Analysis members midweek video discussing the US Watchlist Stocks from today and yesterdays post in more detail with live markups on multiple timeframes, plus a brief look at the S&P 500 and short-term market breadth indicators too...
Read More
20 February, 2023
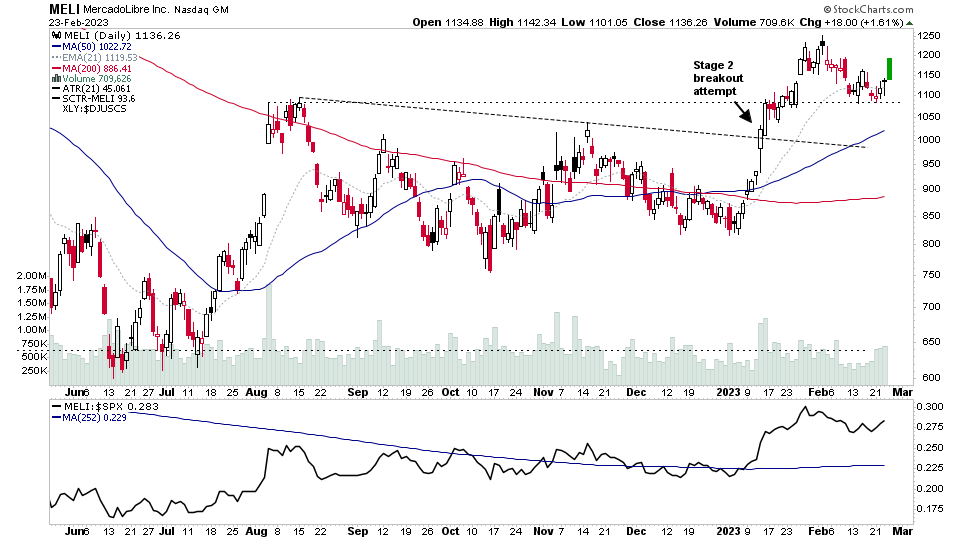
Stage Analysis Members Video – 20 February 2023 (1hr 34mins)
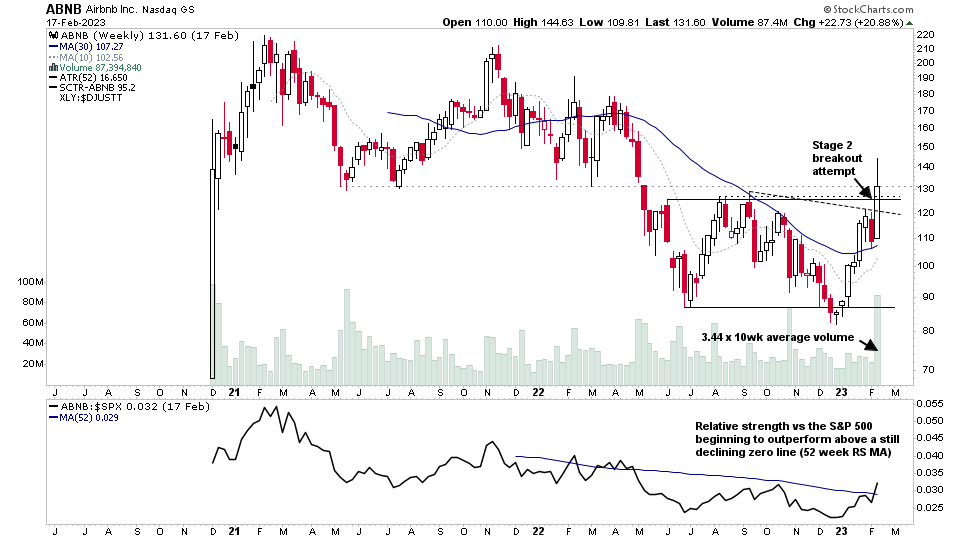
The Stage Analysis members weekend video featuring recent Stage 2 breakout attempts, the major US Indexes, the futures charts, US Industry Groups RS Rankings, IBD Industry Groups Bell Curve - Bullish Percent, the Market Breadth Update to help to determine the Weight of Evidence, the US Stocks Watchlist in detail on multiple timeframes and finishing with a look at the Stage Analysis of some of the major crypto coins, as a few attempt to move into early Stage 2 once more after huge Stage 4 declines in 2022.
Read More
17 February, 2023
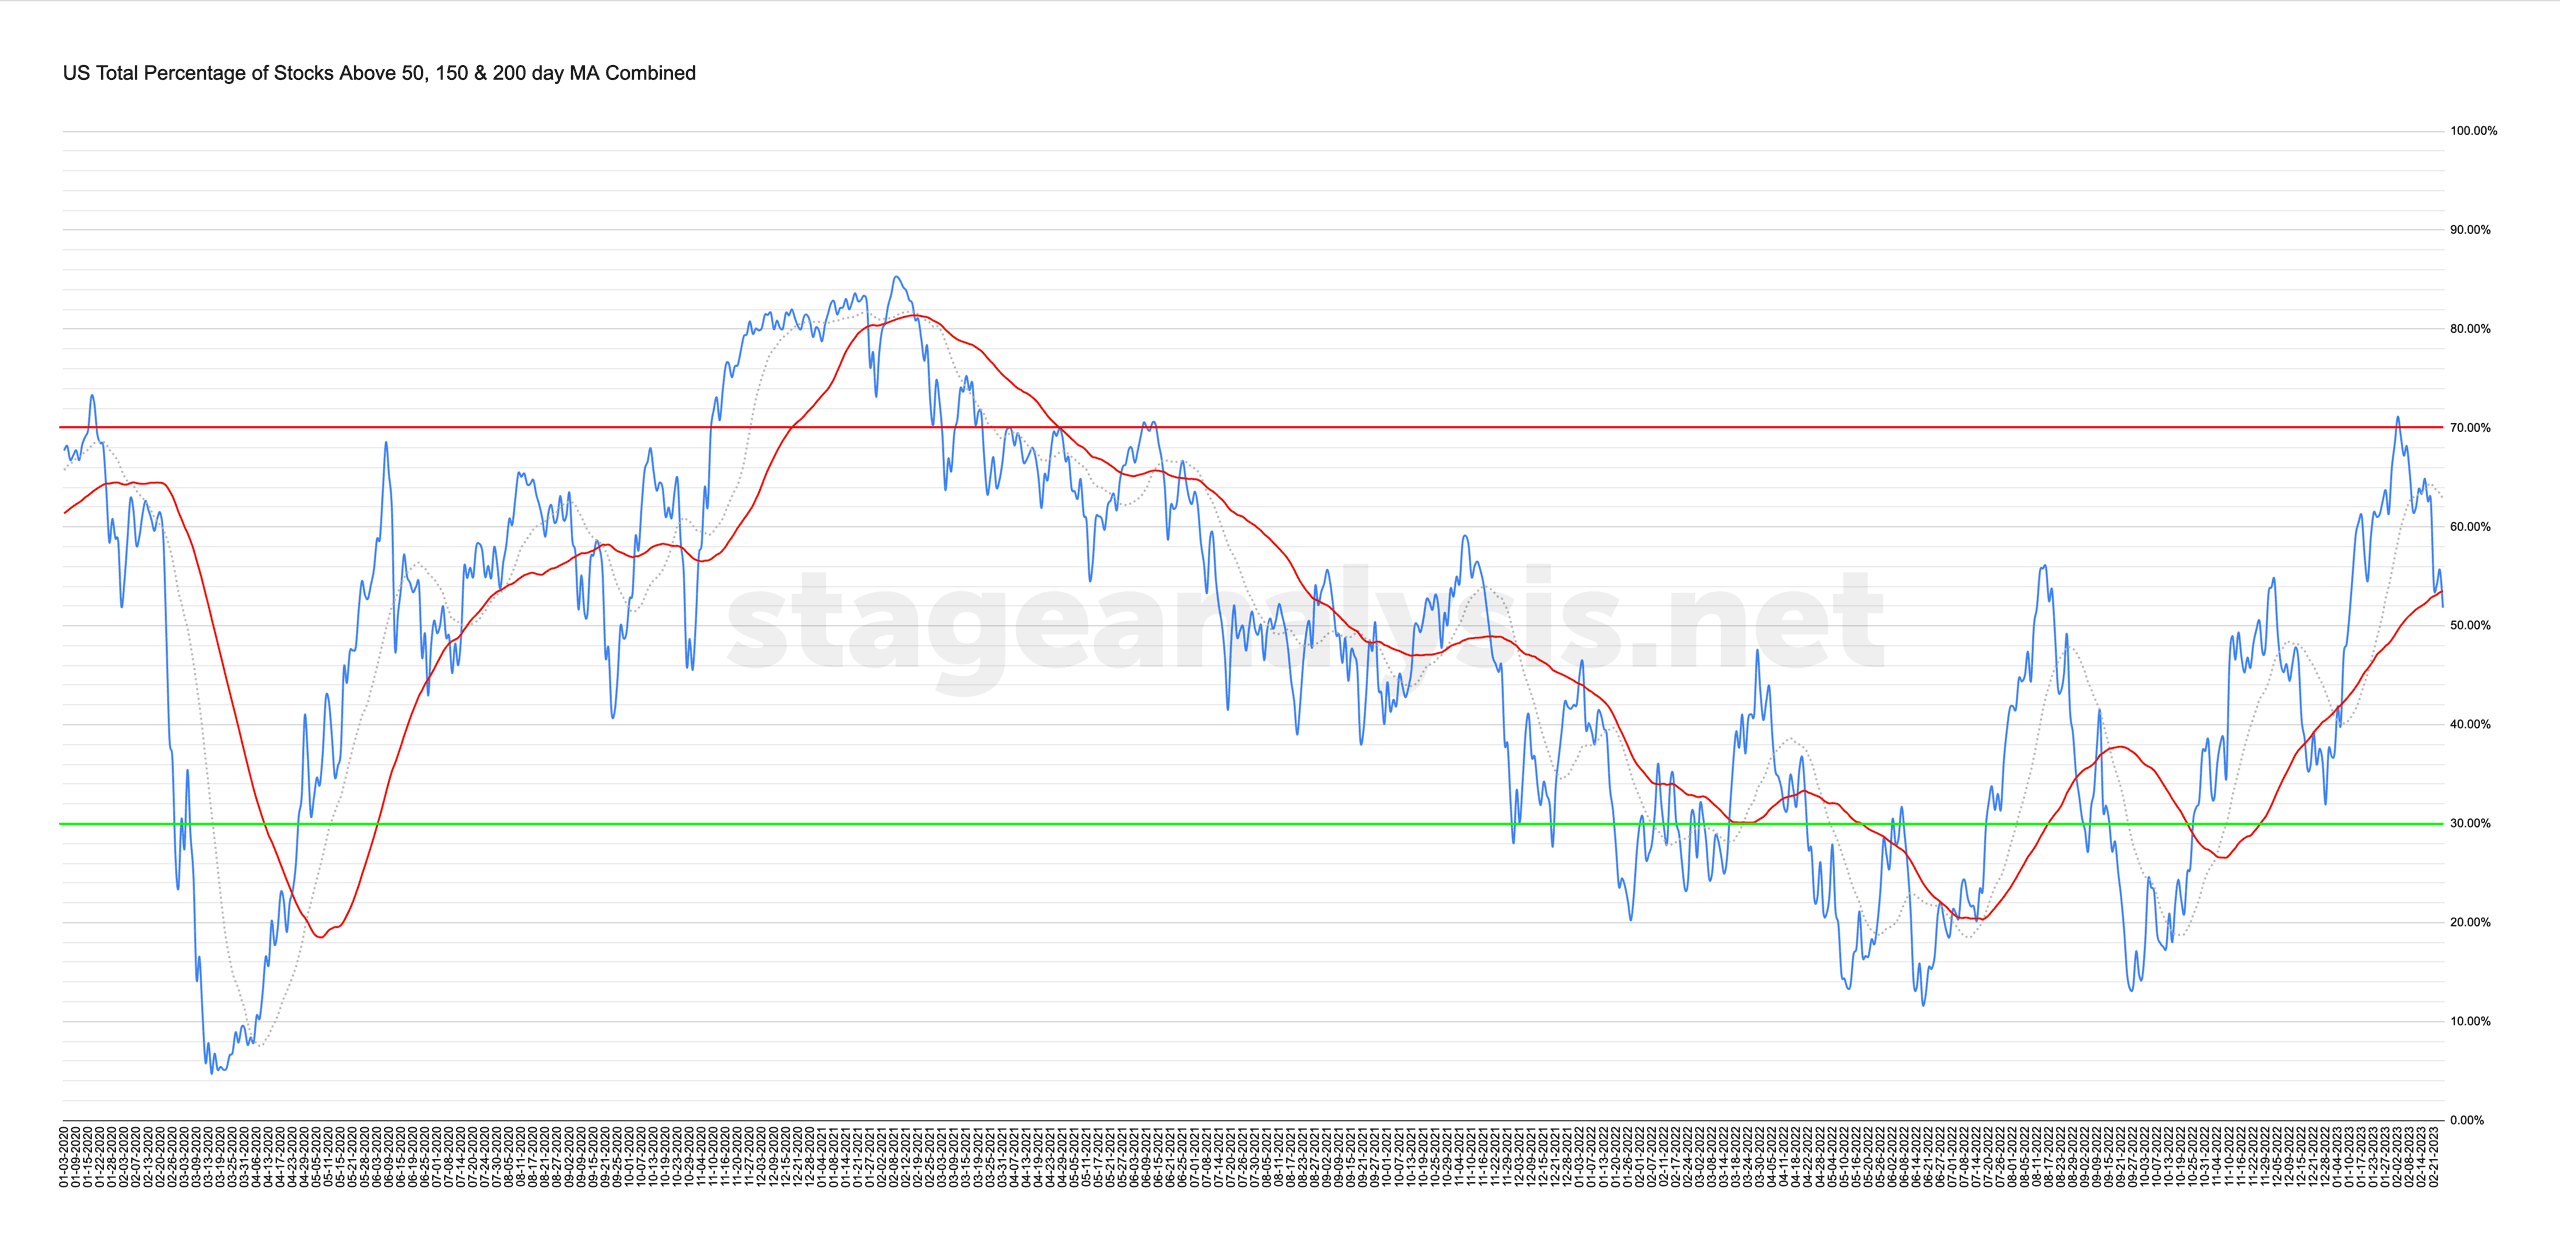
Market Breadth: Percentage of Stocks Above their 50 Day, 150 Day & 200 Day Moving Averages Combined
Custom Percentage of Stocks Above Their 50 Day, 150 Day & 200 Day Moving Averages Combined Market Breadth Charts for the Overall US Market, NYSE and Nasdaq for Market Timing and Strategy.
Read More
13 February, 2023
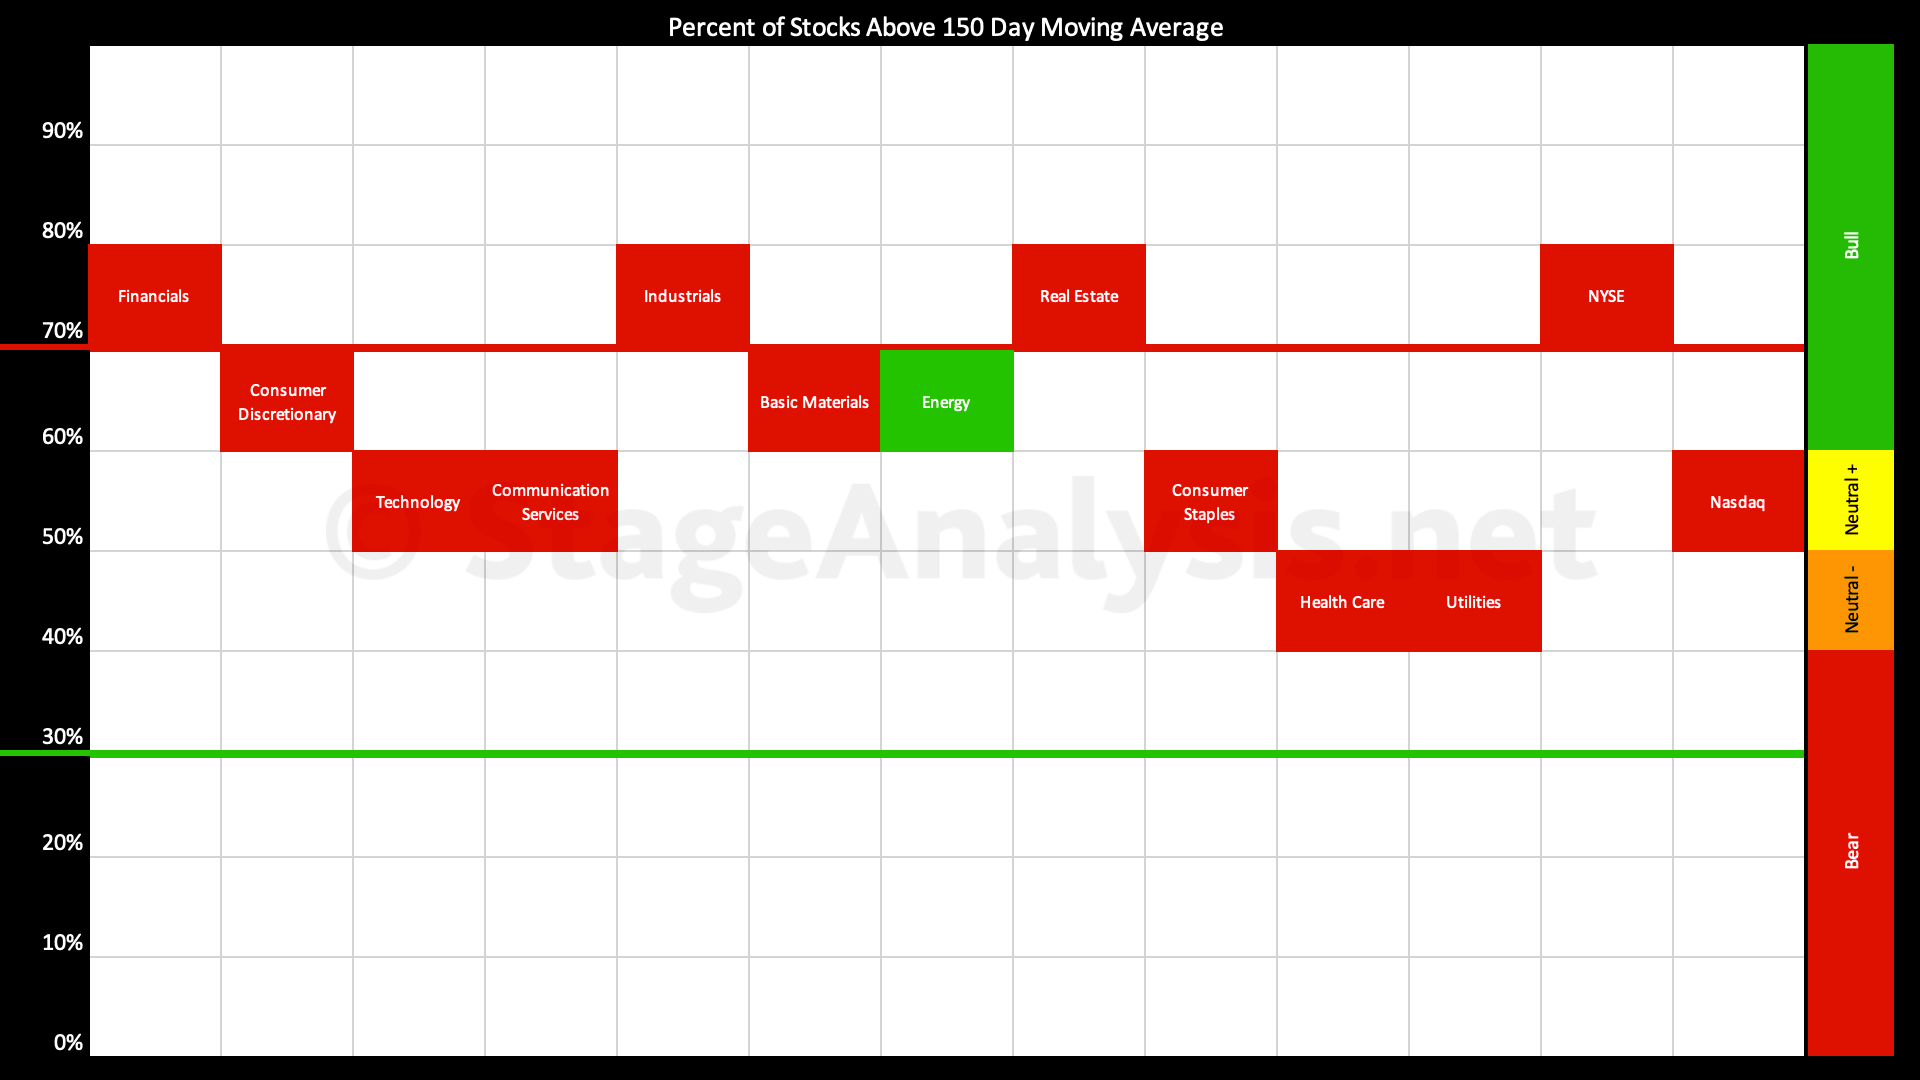
Sector Breadth: Percentage of US Stocks Above Their 150 day (30 Week) Moving Averages
The Percentage of US Stocks Above Their 150 day Moving Averages in the 11 major sectors edge higher over the last three weeks since the previous post of the 23rd January 2023, increasing by a further +1.94% to 60.41% overall, which puts it just in the Stage 2 zone, but very tentatively so...
Read More
12 February, 2023
Stage Analysis Members Video – 12 February 2023 (1hr)
The Stage Analysis members weekend video featuring the regular content with the major US Indexes, the futures charts, US Industry Groups RS Rankings, IBD Industry Groups Bell Curve - Bullish Percent, the Market Breadth Update to help to determine the Weight of Evidence and finishing with the US Stocks Watchlist in detail on multiple timeframes.
Read More

10 February, 2023
Market Breadth: Percentage of Stocks Above their 50 Day, 150 Day & 200 Day Moving Averages Combined
Custom Percentage of Stocks Above Their 50 Day, 150 Day & 200 Day Moving Averages Combined Market Breadth Charts for the Overall US Market, NYSE and Nasdaq for Market Timing and Strategy.
Read More
05 February, 2023
Stage Analysis Members Video – 5 February 2023 (1hr 31mins)
The Stage Analysis members weekend video featuring the regular content with the major US Indexes, the futures charts, US Industry Groups RS Rankings, IBD Industry Groups Bell Curve - Bullish Percent, the Market Breadth Update to help to determine the Weight of Evidence and finishing with the US Stocks Watchlist in detail on multiple timeframes.
Read More