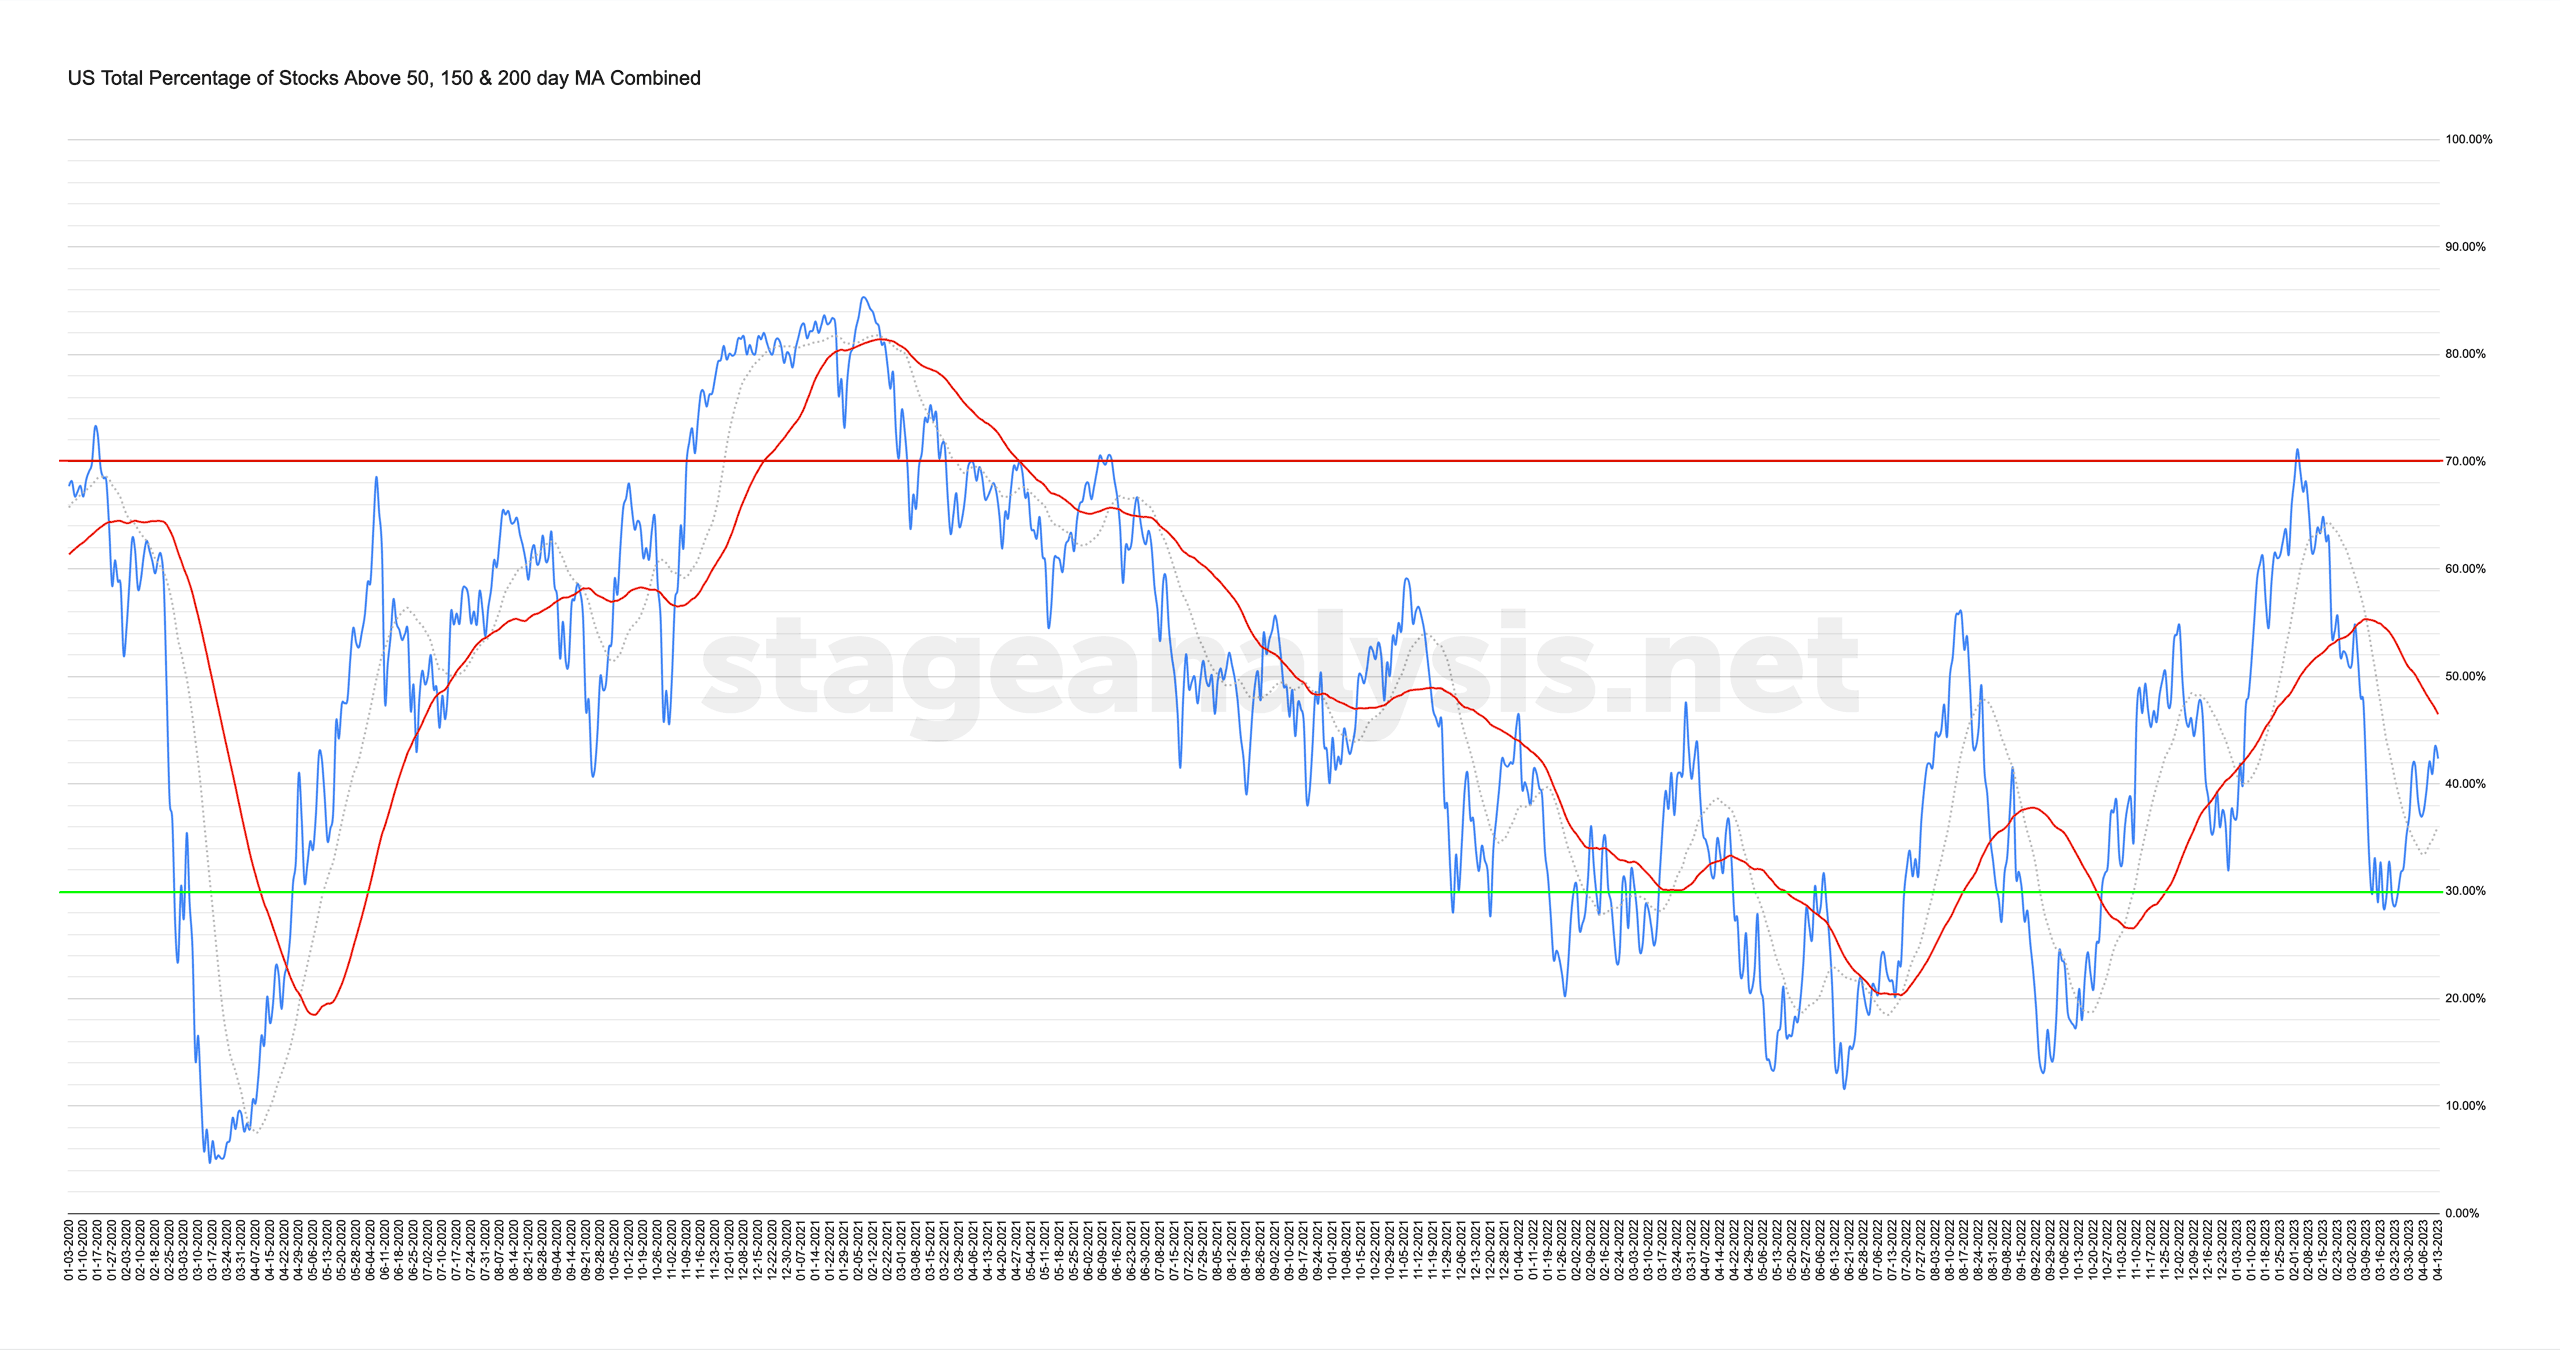
Custom Percentage of Stocks Above Their 50 Day, 150 Day & 200 Day Moving Averages Combined Market Breadth Charts for the Overall US Market, NYSE and Nasdaq for Market Timing and Strategy.
Read More

Blog
26 April, 2023
Stage Analysis Midweek Video – 26 April 2023
A brief midweek video today covering the major US indexes and short-term breadth measures...
Read More
23 April, 2023
Stage Analysis Members Video – 23 April 2023 (1hr 23mins)
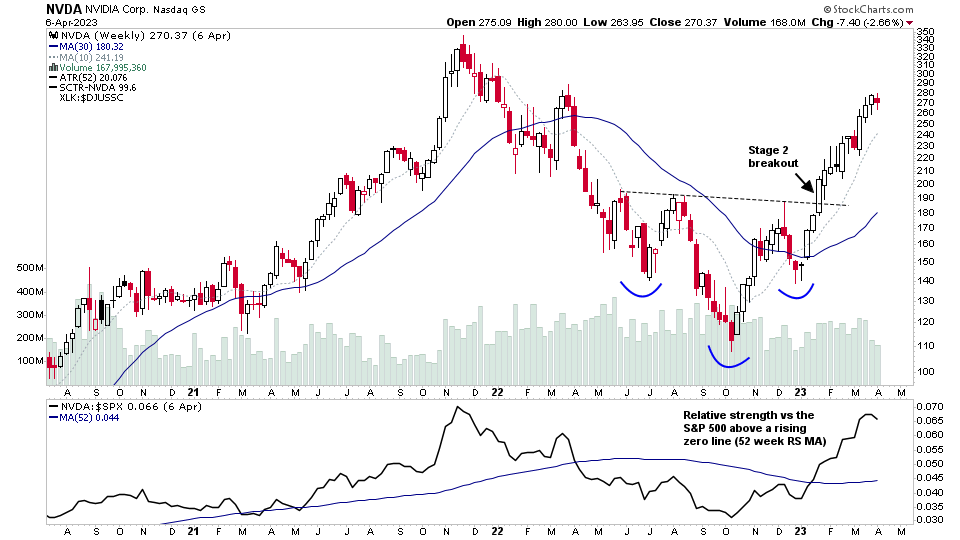
Stage Analysis members weekend video featuring Stage Analysis of the mega cap stocks reporting earnings in the coming week, plus the members only content covering the Major Indexes Update, Futures, Industry Group RS Rankings, IBD Industry Groups Bell Curve – Bullish Percent, Market Breadth, Stage 2 Continuation Breakouts and the US Watchlist Stocks detailed discussion...
Read More
22 April, 2023
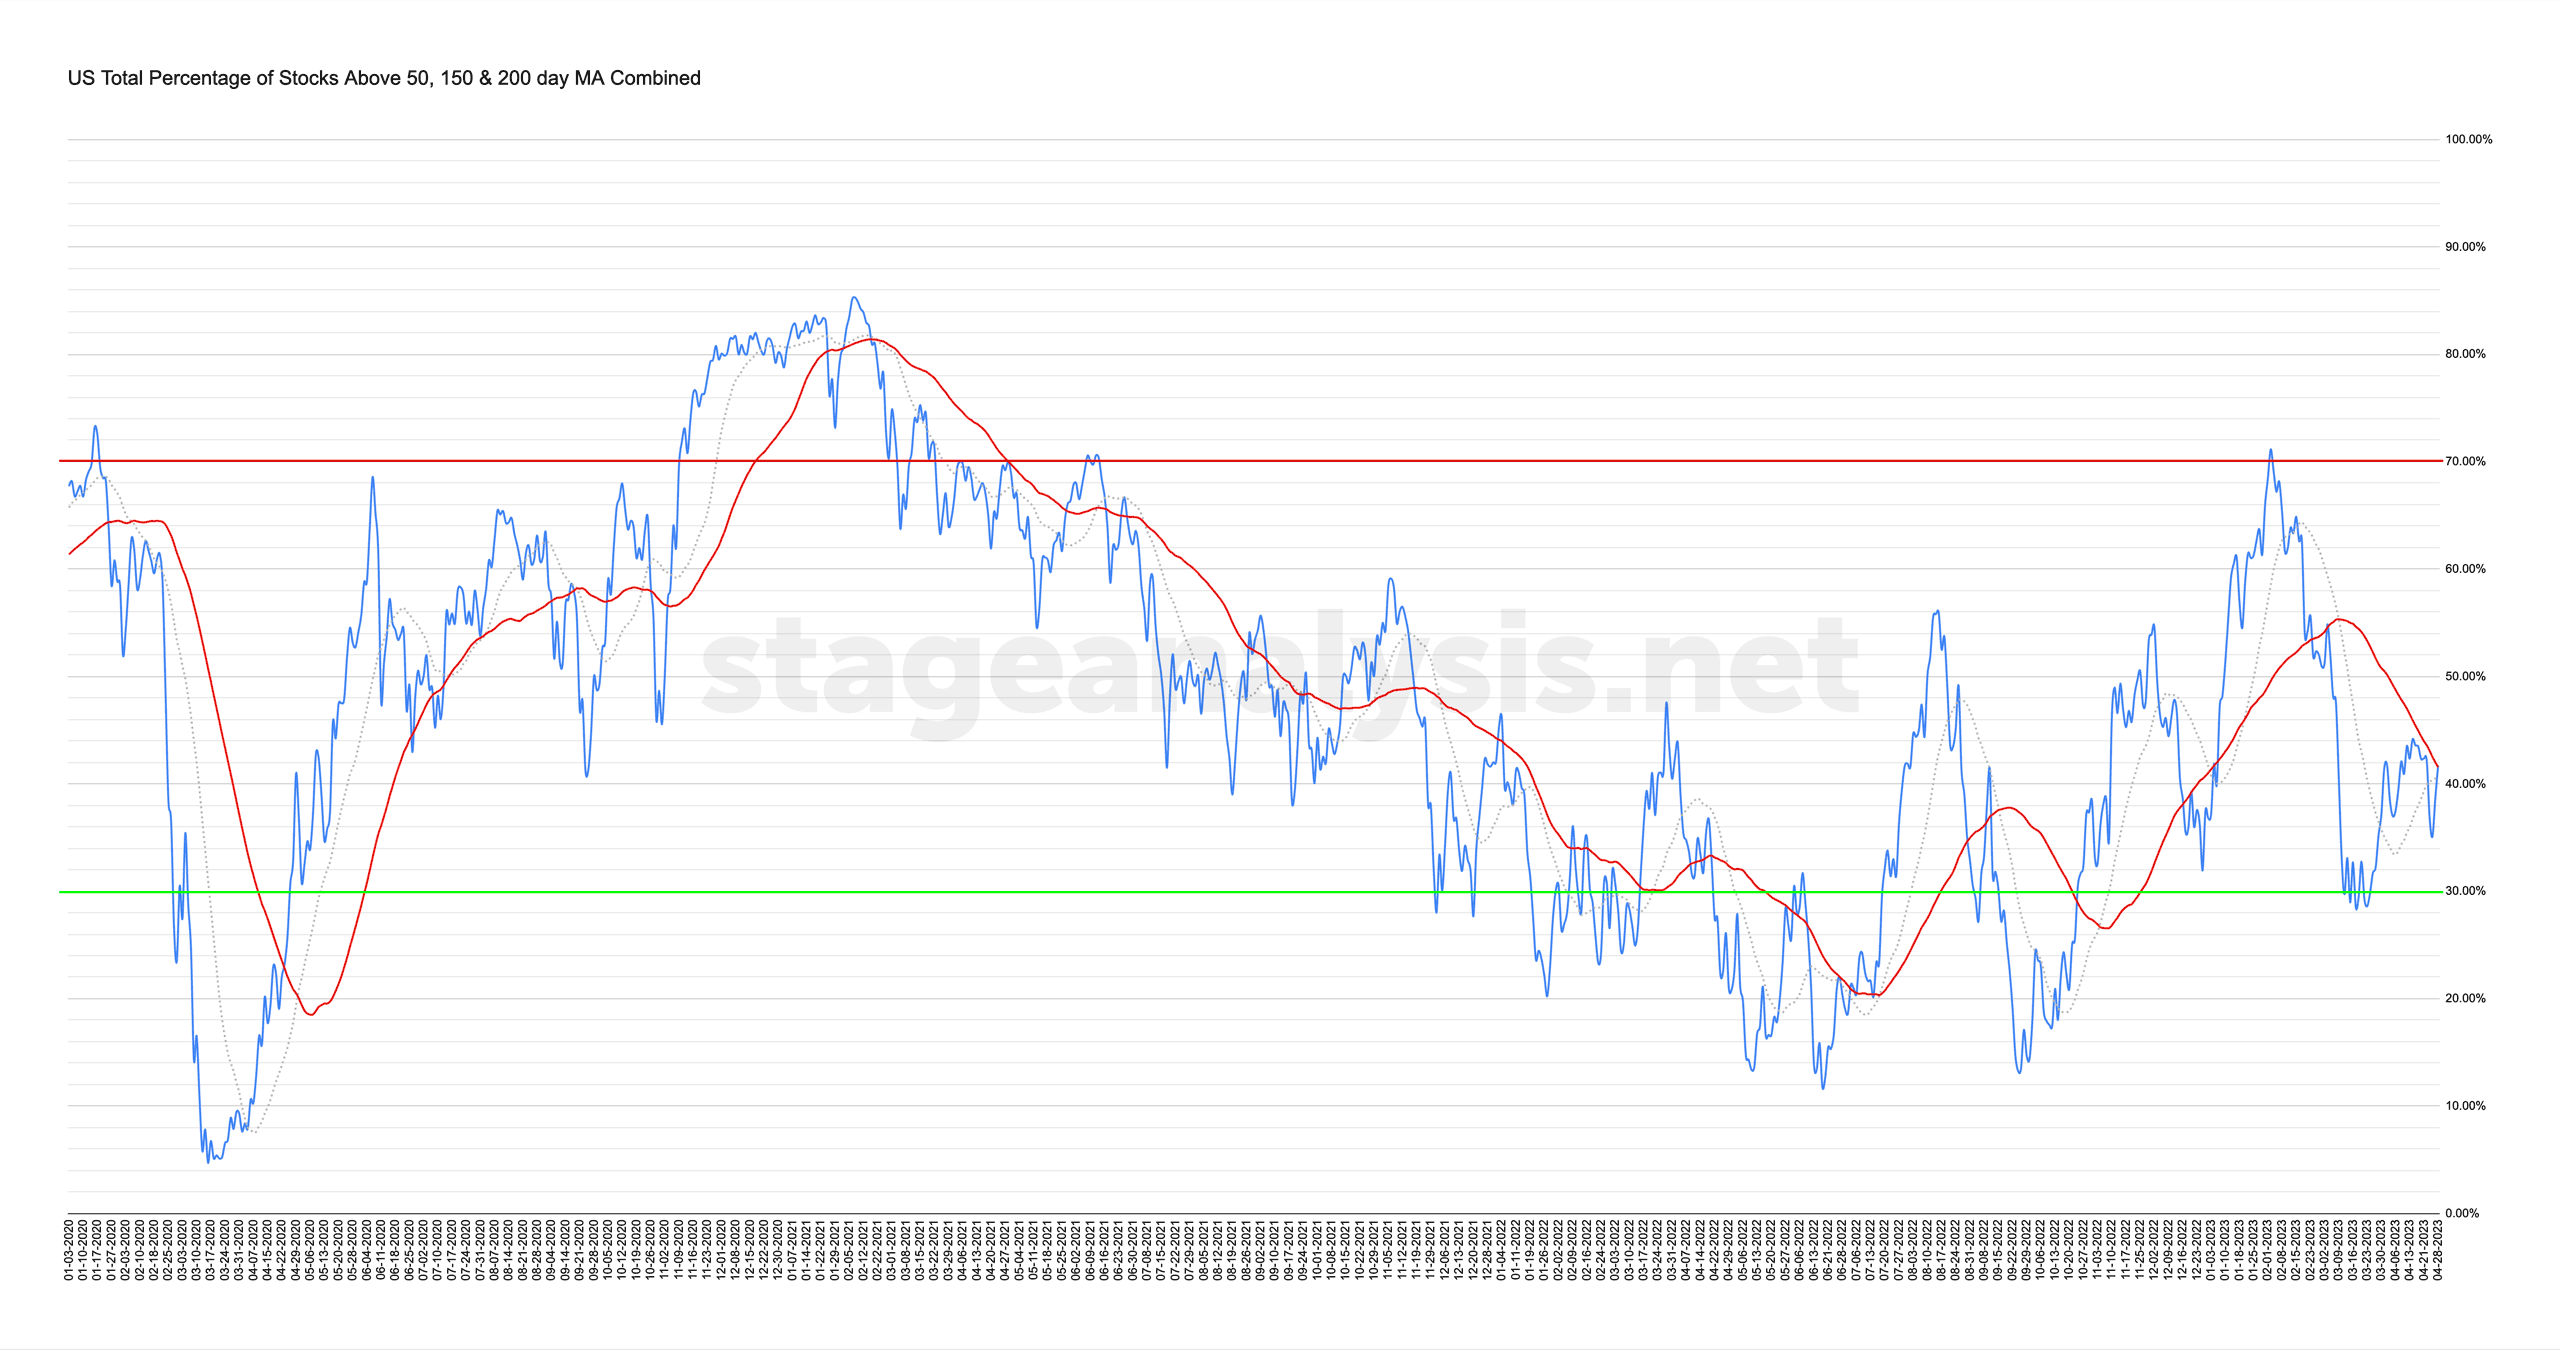
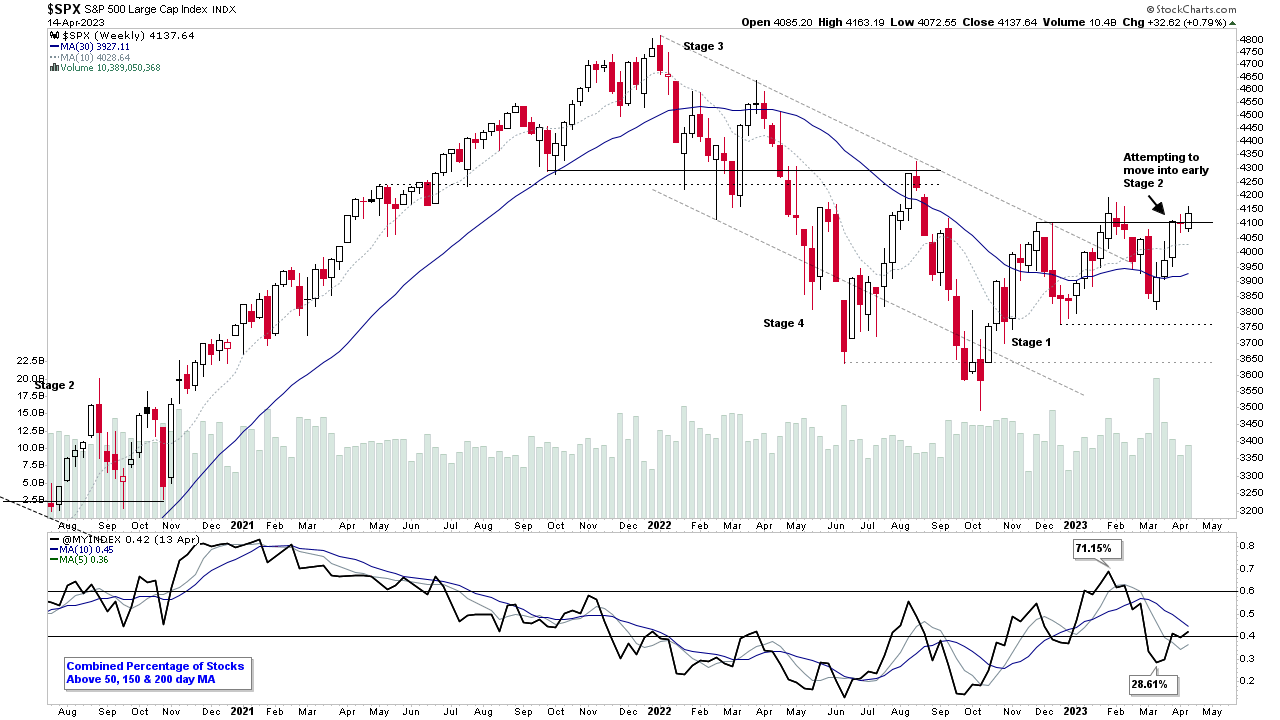
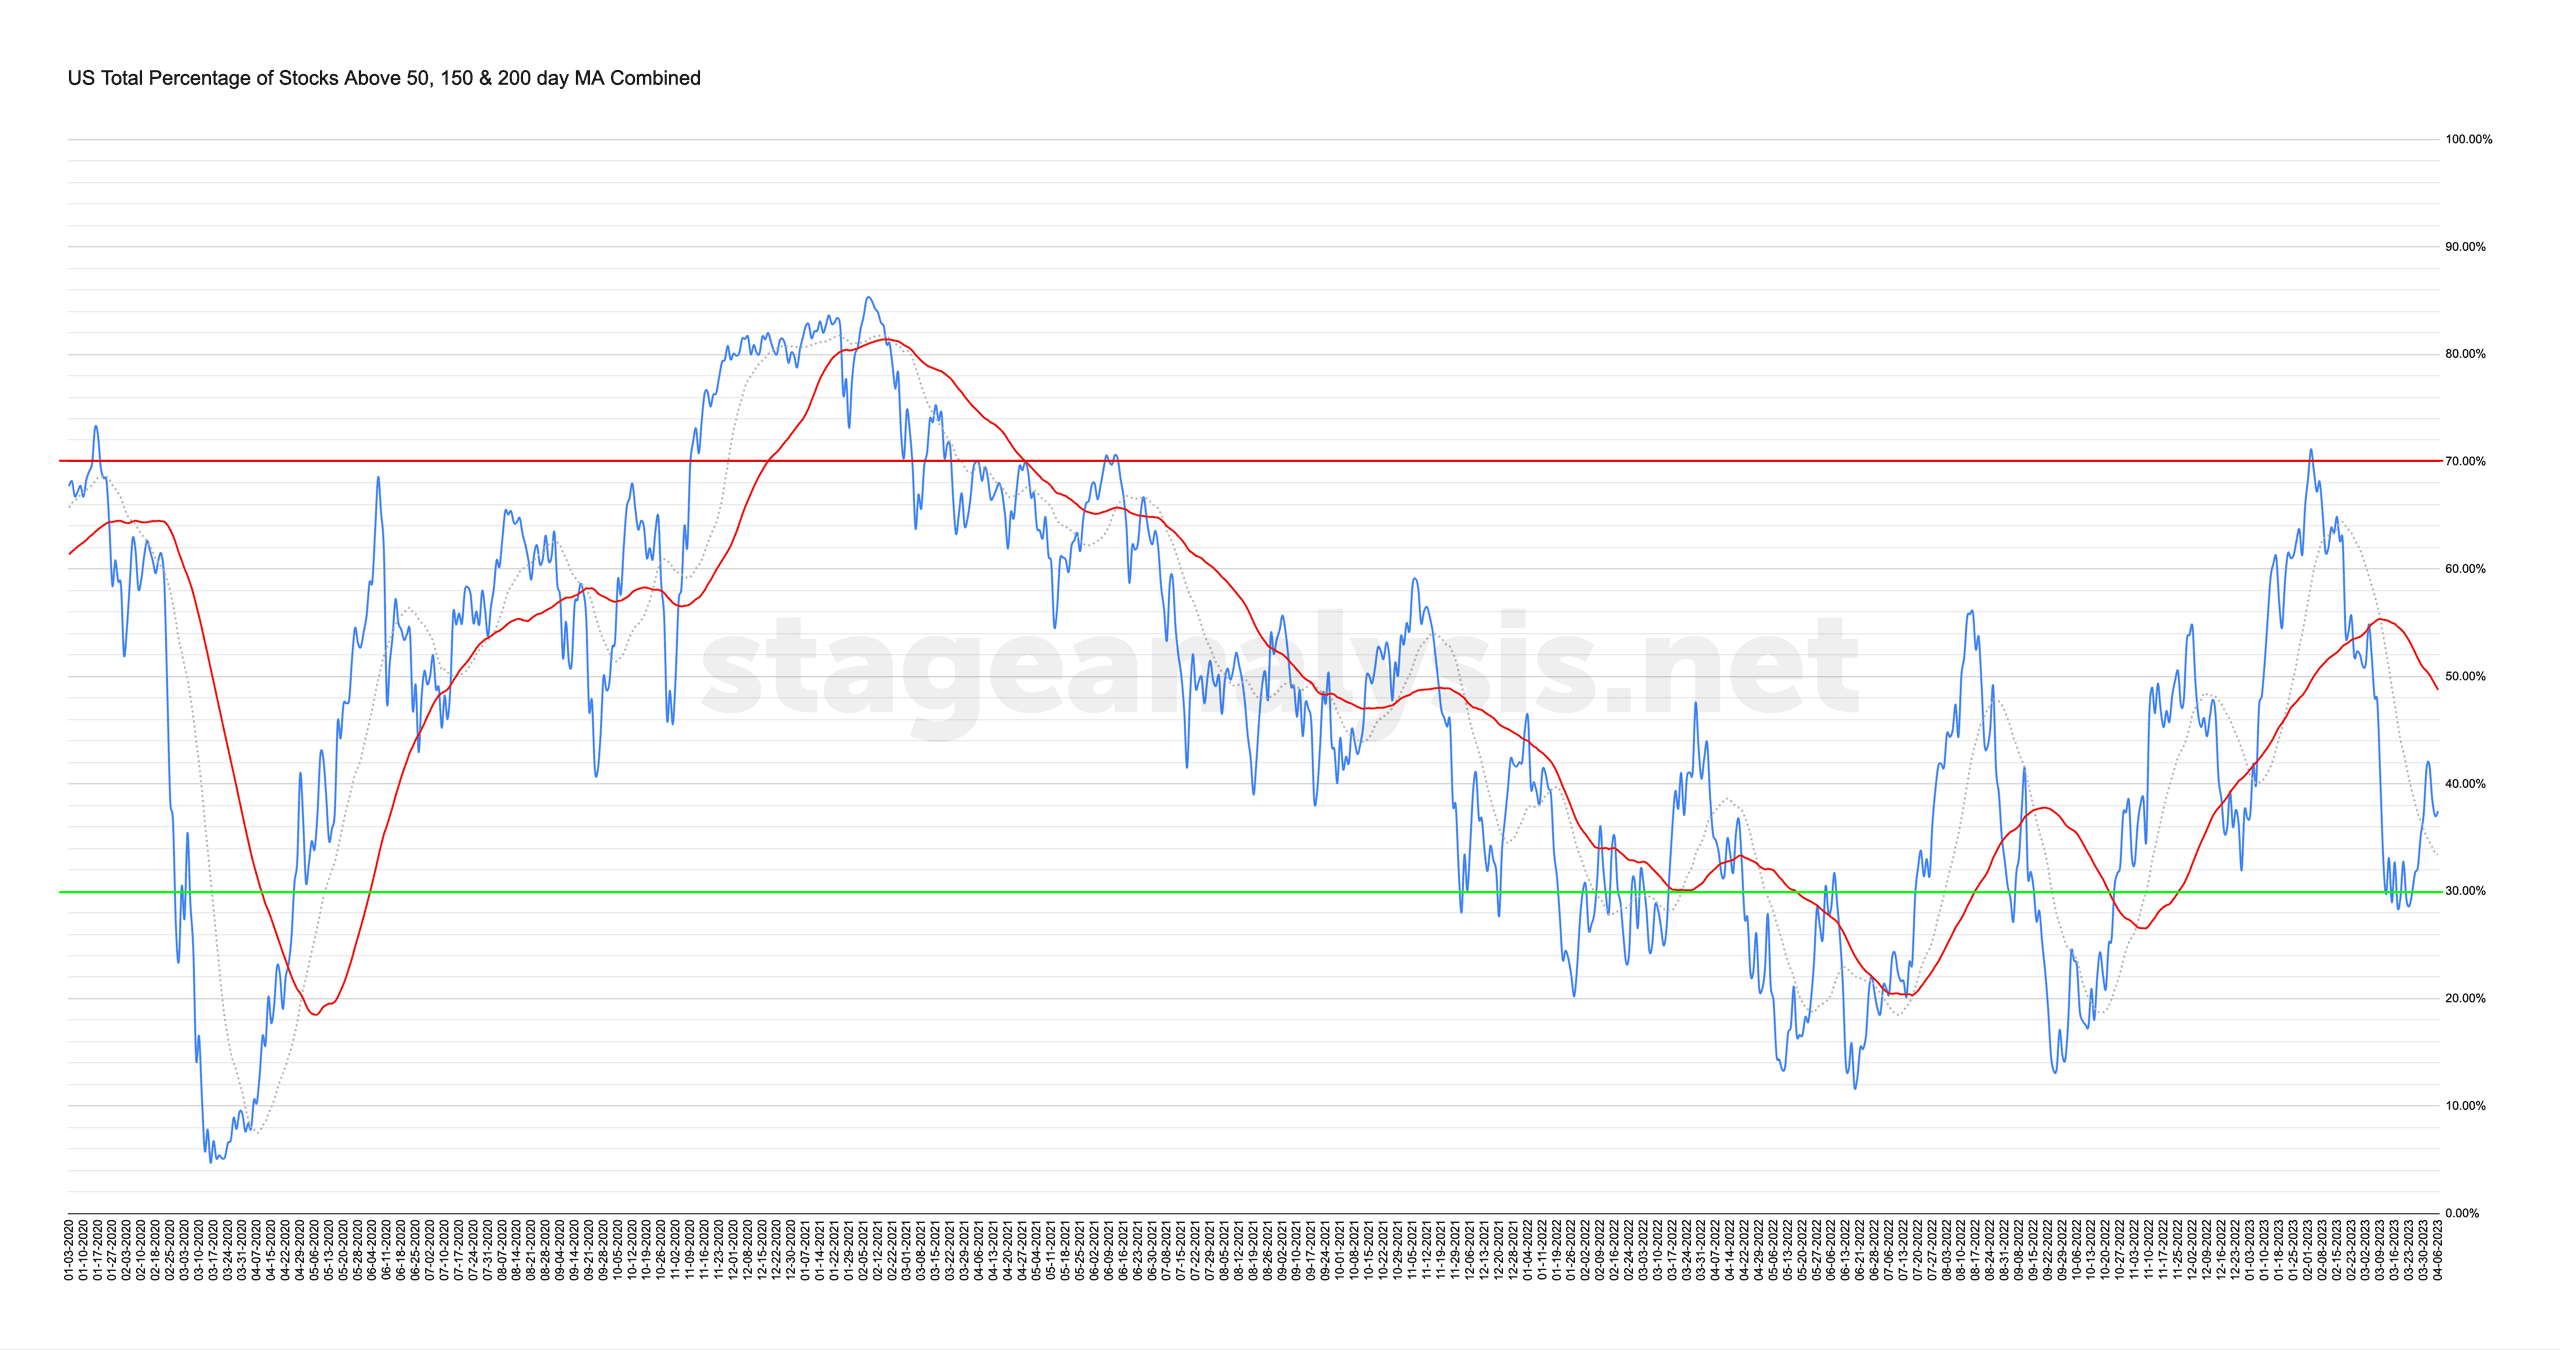
Market Breadth: Percentage of Stocks Above their 50 Day, 150 Day & 200 Day Moving Averages Combined
Custom Percentage of Stocks Above Their 50 Day, 150 Day & 200 Day Moving Averages Combined Market Breadth Charts for the Overall US Market, NYSE and Nasdaq for Market Timing and Strategy.
Read More
17 April, 2023
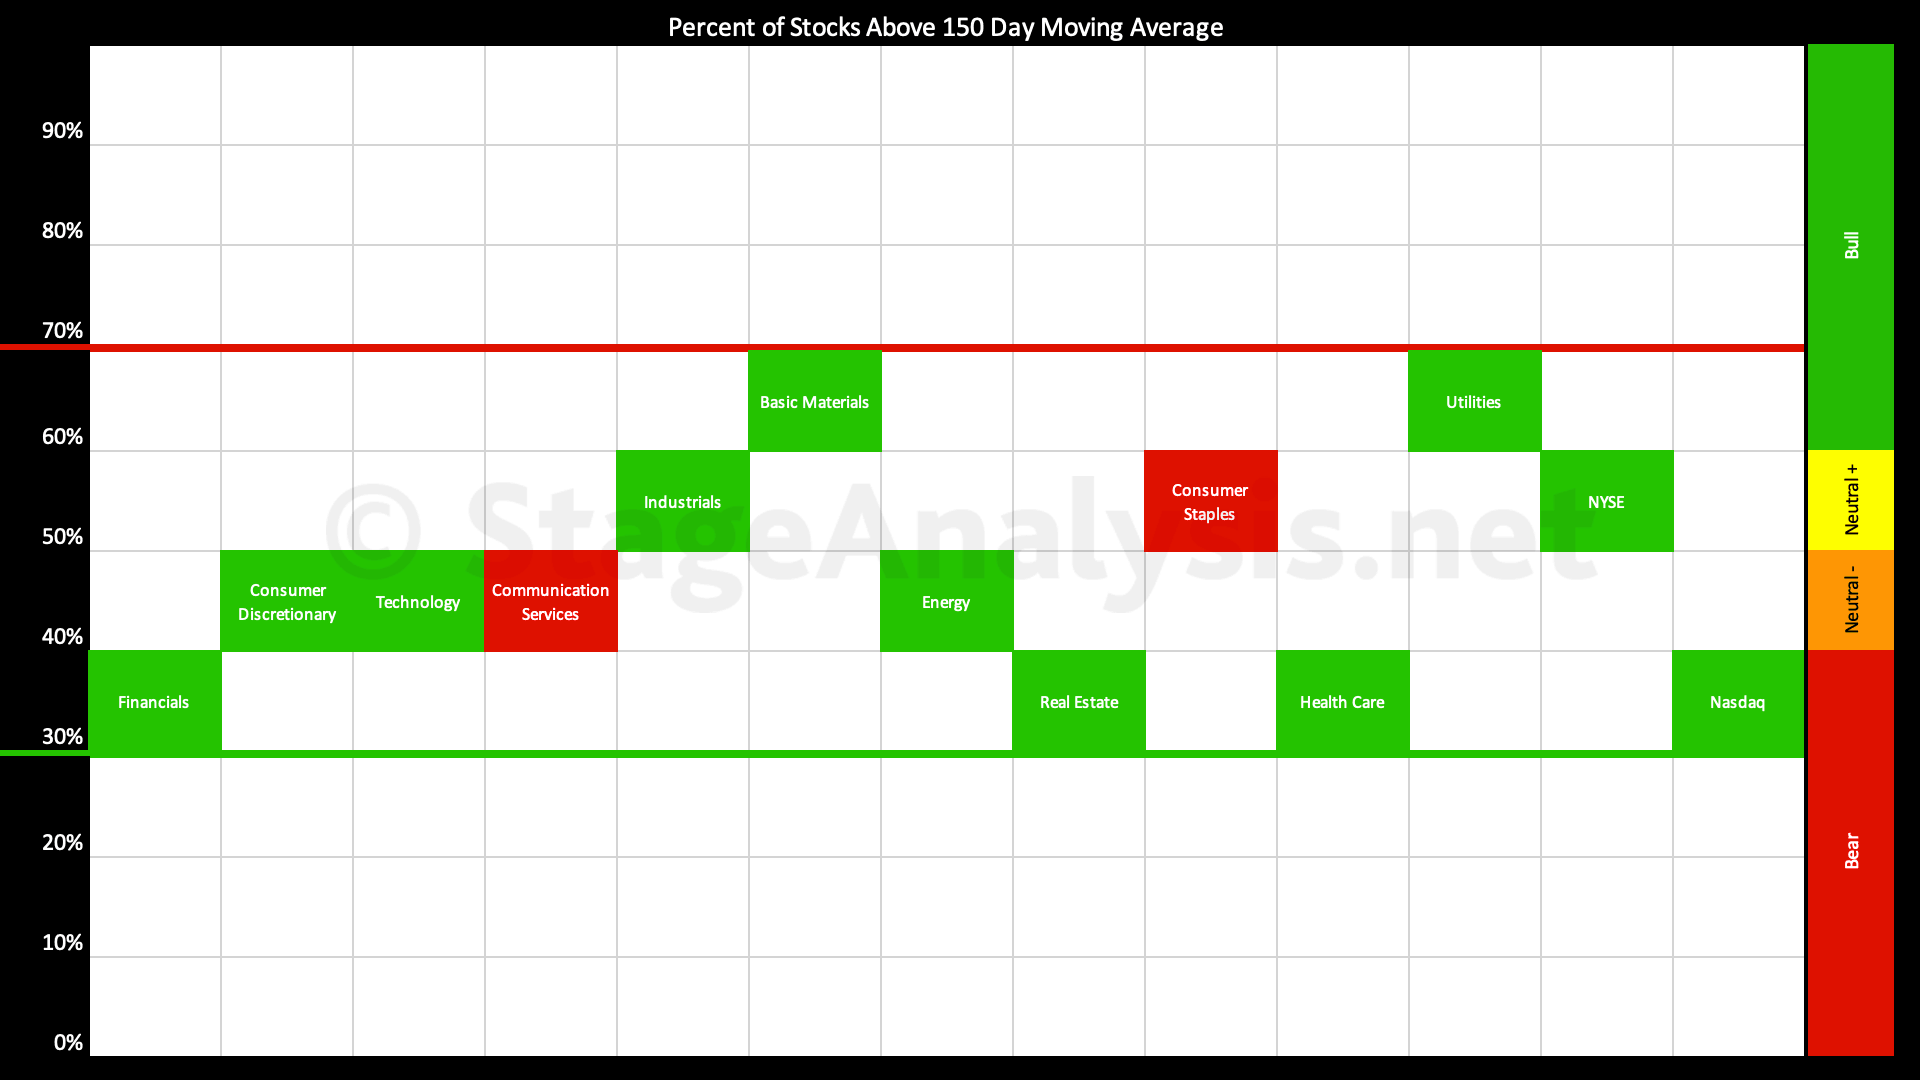
Sector Breadth: Percentage of US Stocks Above Their 150 day (30 Week) Moving Averages
The Percentage of US Stocks Above Their 150 day Moving Averages in the 11 major sectors continues to edge to towards the middle of the range, with every sector clustered in the middle range, as can be see on the visual diagram...
Read More
16 April, 2023
Stage Analysis Members Video – 16 April 2023 (1hr 25mins)
Stage Analysis Members Weekend Video featuring Stage Analysis of the major US indexes on multiple timeframes, Futures (SATA) Stage Analysis Technical Attributes Charts, Industry Group RS Rankings and changes, IBD Industry Groups Bell Curve – Bullish Percent data. The Market Breadth Update to help to determine the Weight of Evidence, which is so crucial to Stan Weinstein's Stage Analysis method....
Read More
15 April, 2023
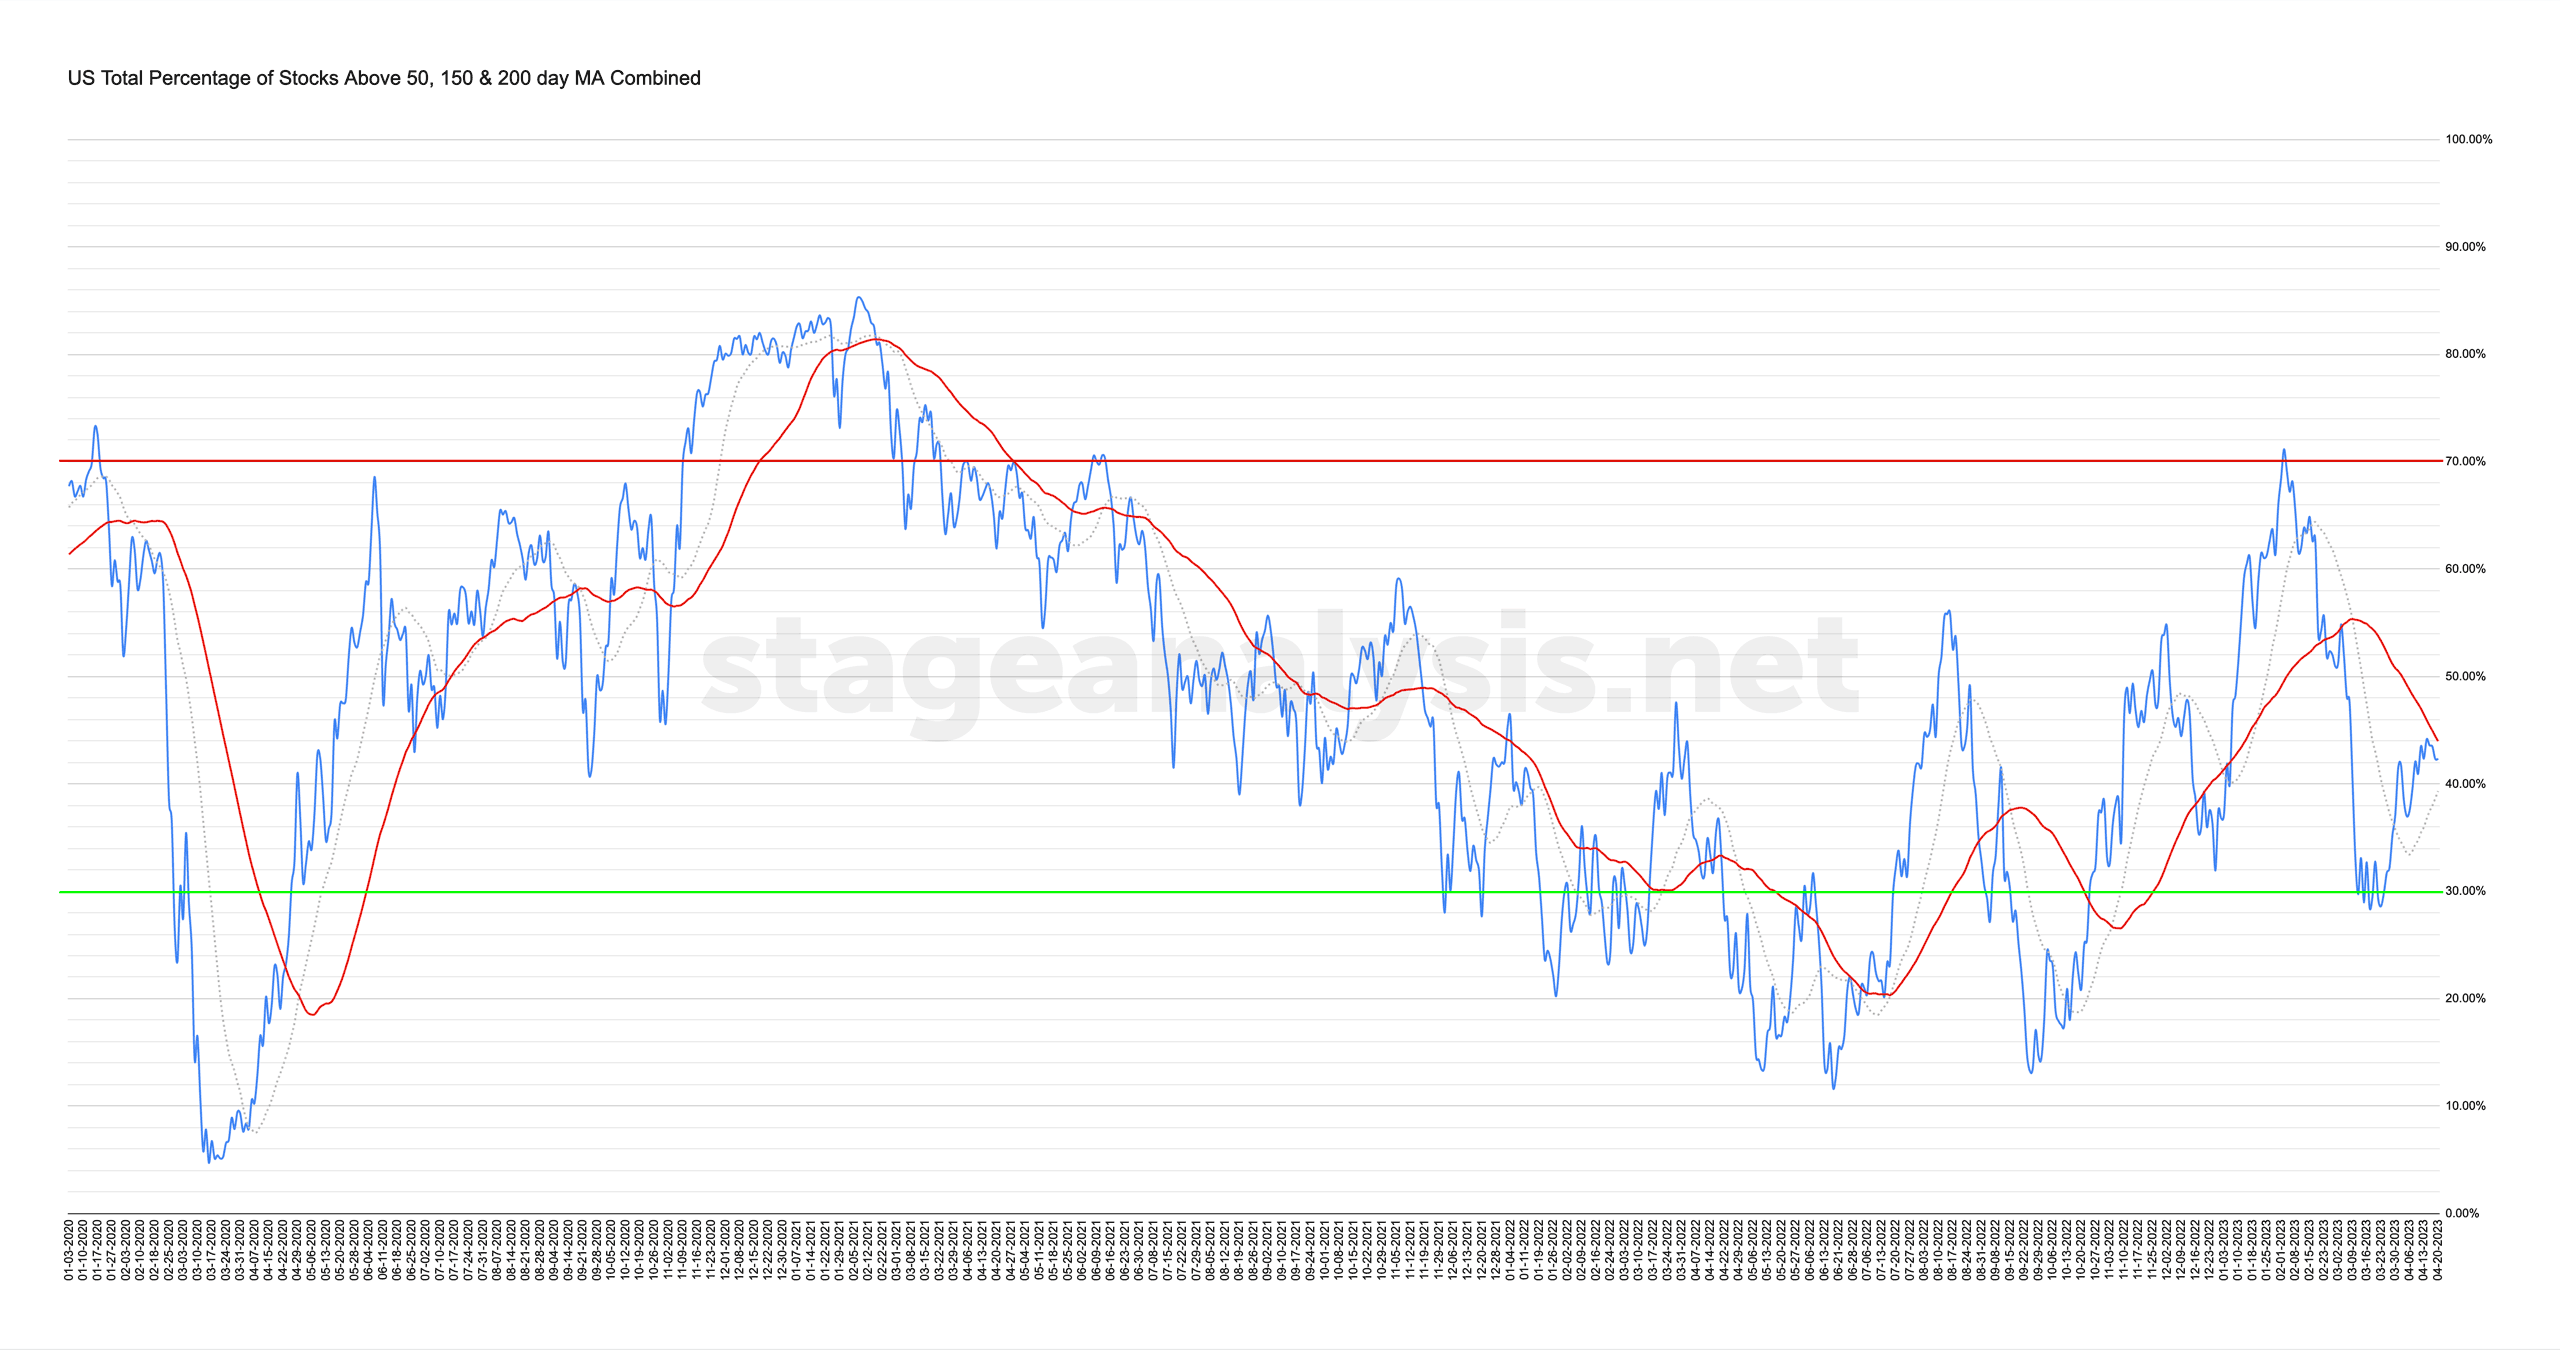
Market Breadth: Percentage of Stocks Above their 50 Day, 150 Day & 200 Day Moving Averages Combined
Custom Percentage of Stocks Above Their 50 Day, 150 Day & 200 Day Moving Averages Combined Market Breadth Charts for the Overall US Market, NYSE and Nasdaq for Market Timing and Strategy.
Read More
12 April, 2023
Stage Analysis Members Video – 12 April 2023 (1hr)
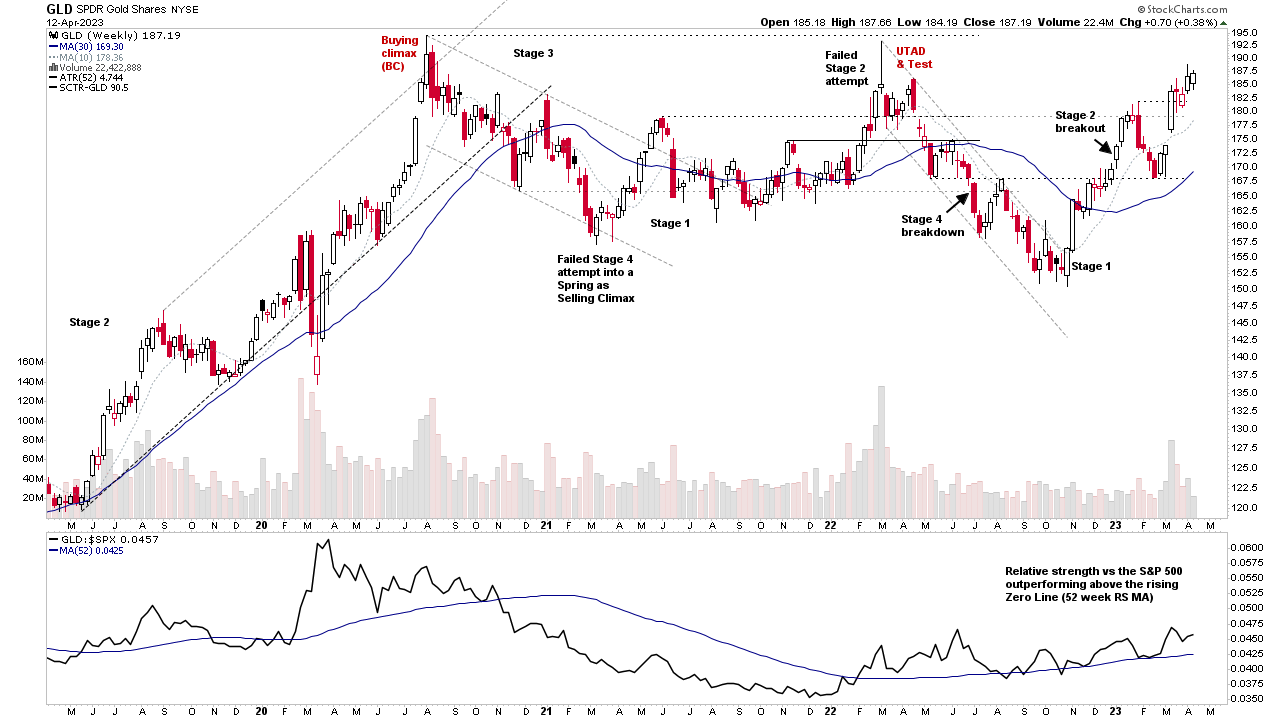
The Stage Analysis members midweek video begins today with Stage Analysis of Gold, Silver, Bitcoin and Ethereum. Followed by the Major Indexes Update, Short-term Market Breadth Indicators and a detailed discussion of the US Watchlist Stocks...
Read More
09 April, 2023
Stage Analysis Members Video – 9 April 2023 (1hr 21mins)
The Stage Analysis members weekend video this week begins with a feature on the mega cap stocks, as many are attempting to move into early Stage 2. Then the more regular member content covering the major US stock market indexes update, Futures stock charts, US Stocks Industry Groups Relative Strength (RS) Rankings...
Read More
08 April, 2023
Market Breadth: Percentage of Stocks Above their 50 Day, 150 Day & 200 Day Moving Averages Combined
Custom Percentage of Stocks Above Their 50 Day, 150 Day & 200 Day Moving Averages Combined Market Breadth Charts for the Overall US Market, NYSE and Nasdaq for Market Timing and Strategy.
Read More