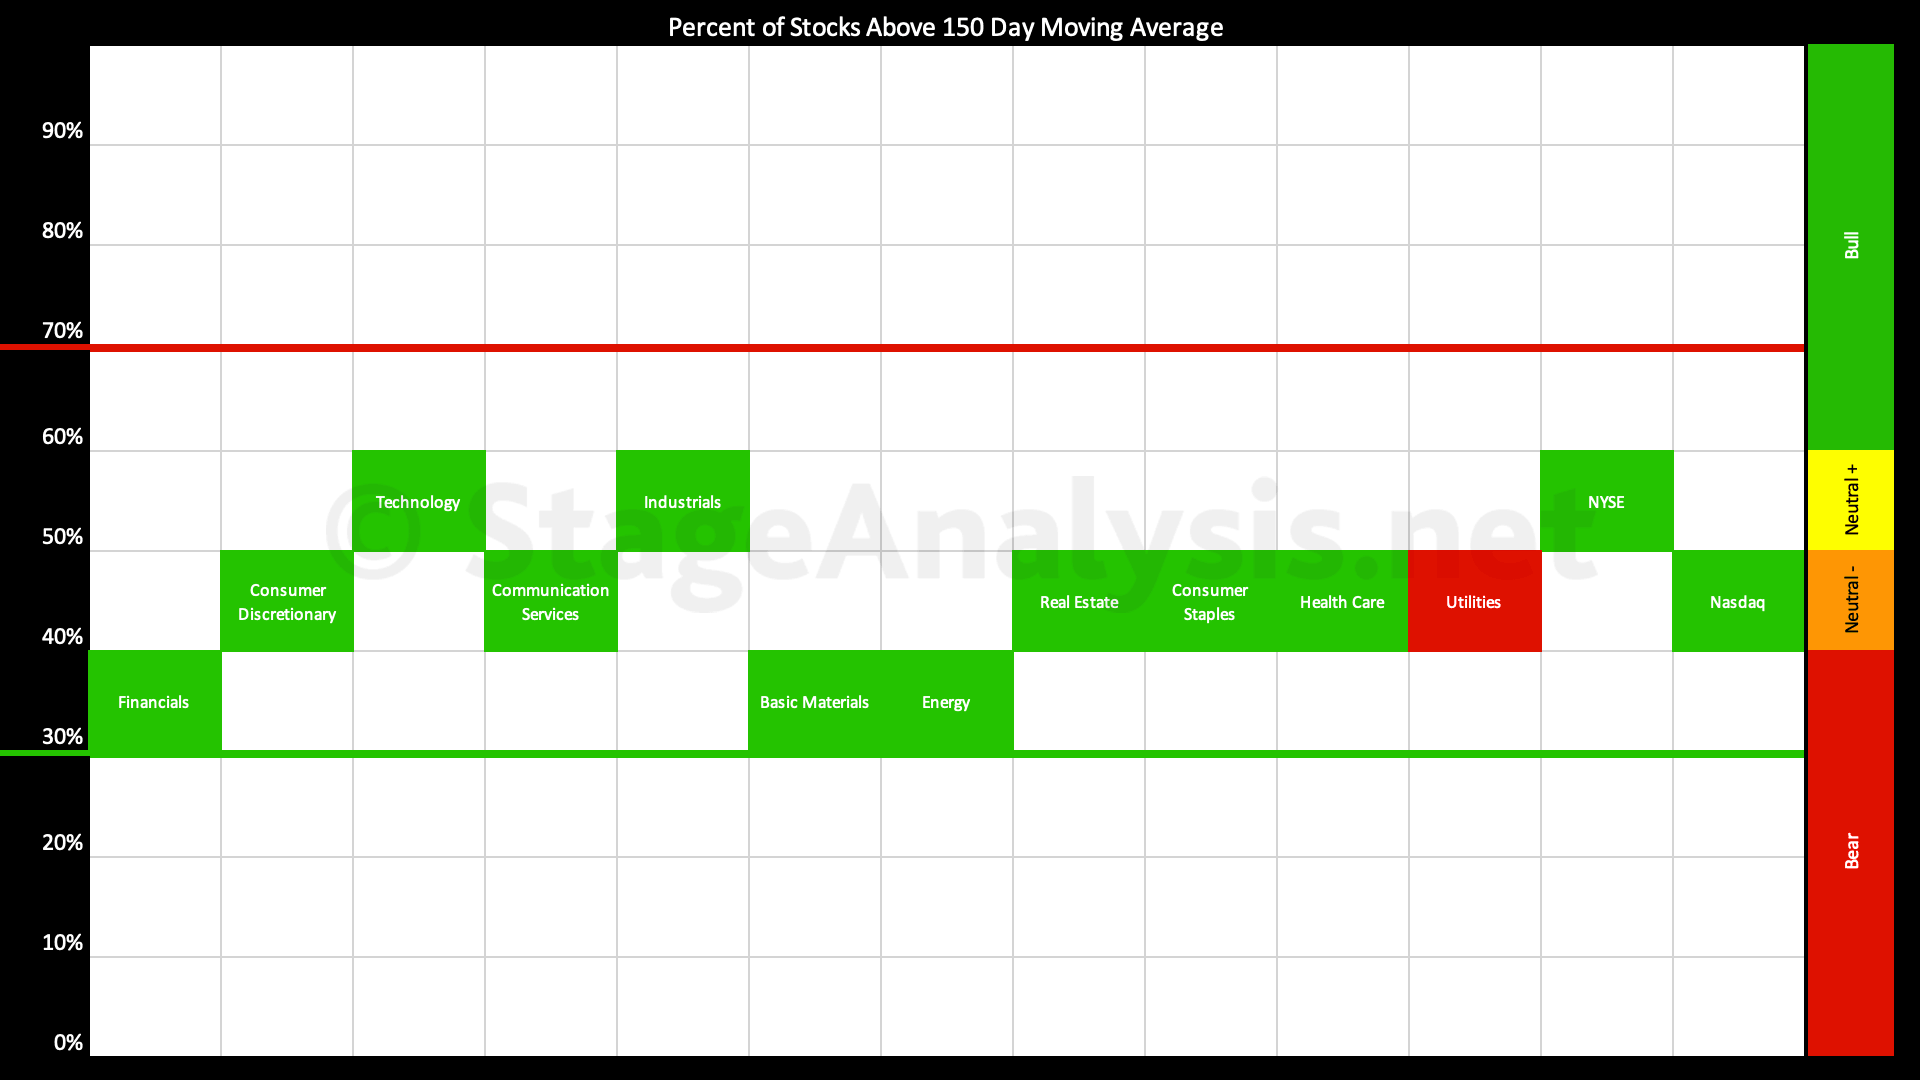
The percentage of US stocks above their 150 day (30 week) moving averages in the 11 major sectors post provides a unique snapshot of the overall market health and is highlighted every few weeks in the Stage Analysis blog...
Read More

Blog
11 June, 2023
Stage Analysis Members Video – 11 June 2023 (1hr 21mins)
Stage Analysis weekend video beginning with the Major Indexes Update as the Small Caps continues to improve, Futures SATA Charts, Industry Groups RS Rankings, IBD Industry Group Bell Curve, Market Breadth Update to help to determine the weight of evidence, Stage 2 breakout attempts on volume and lastly discussing the US Watchlist Stocks from the weekend scans in detail on multiple timeframes.
Read More
10 June, 2023
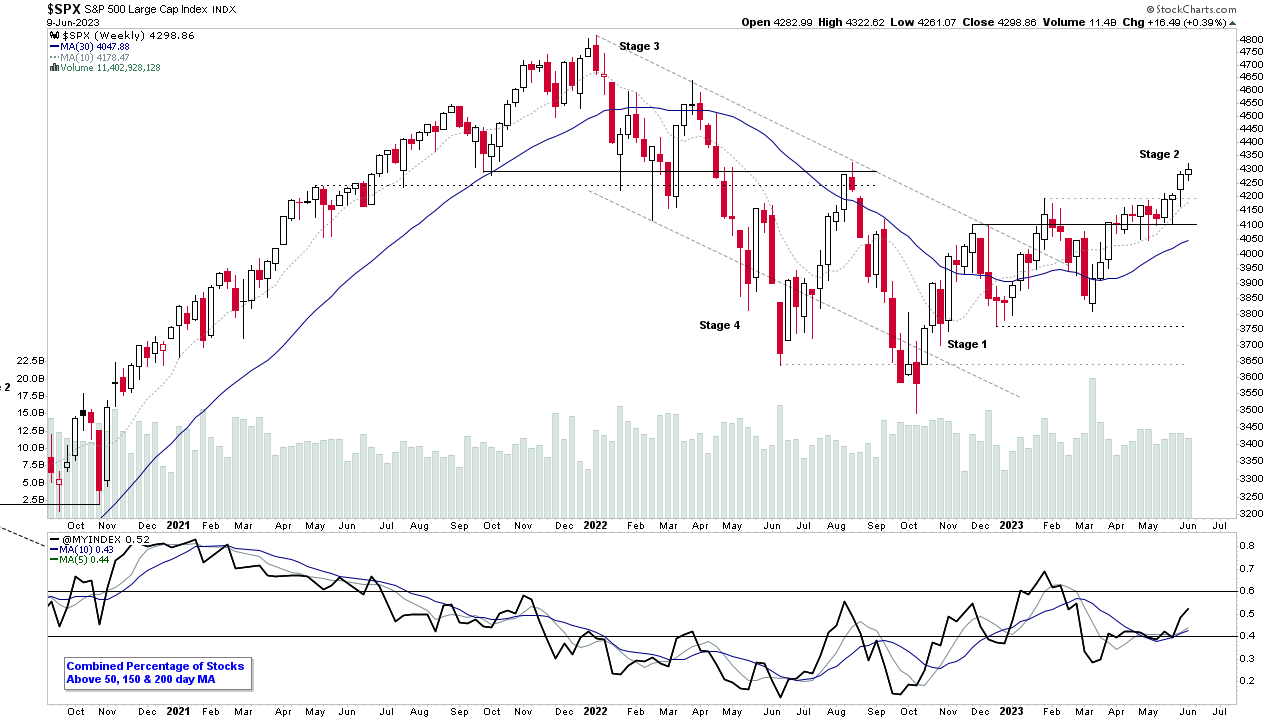
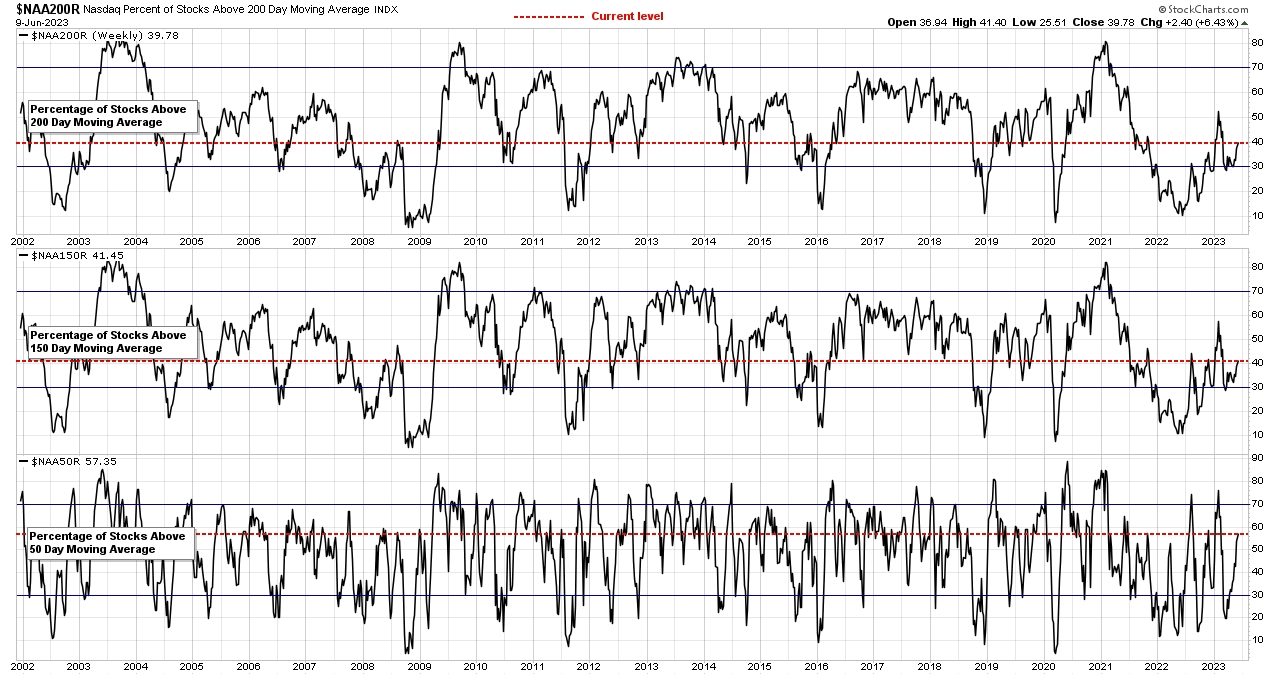
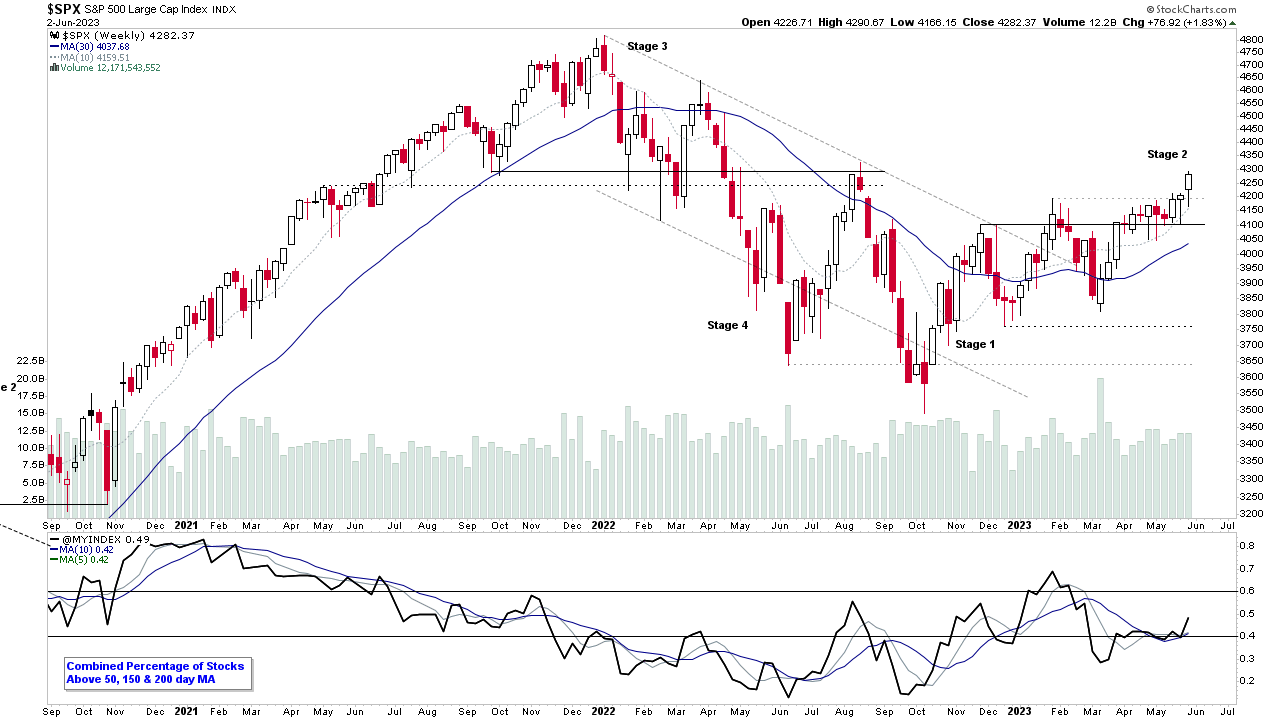
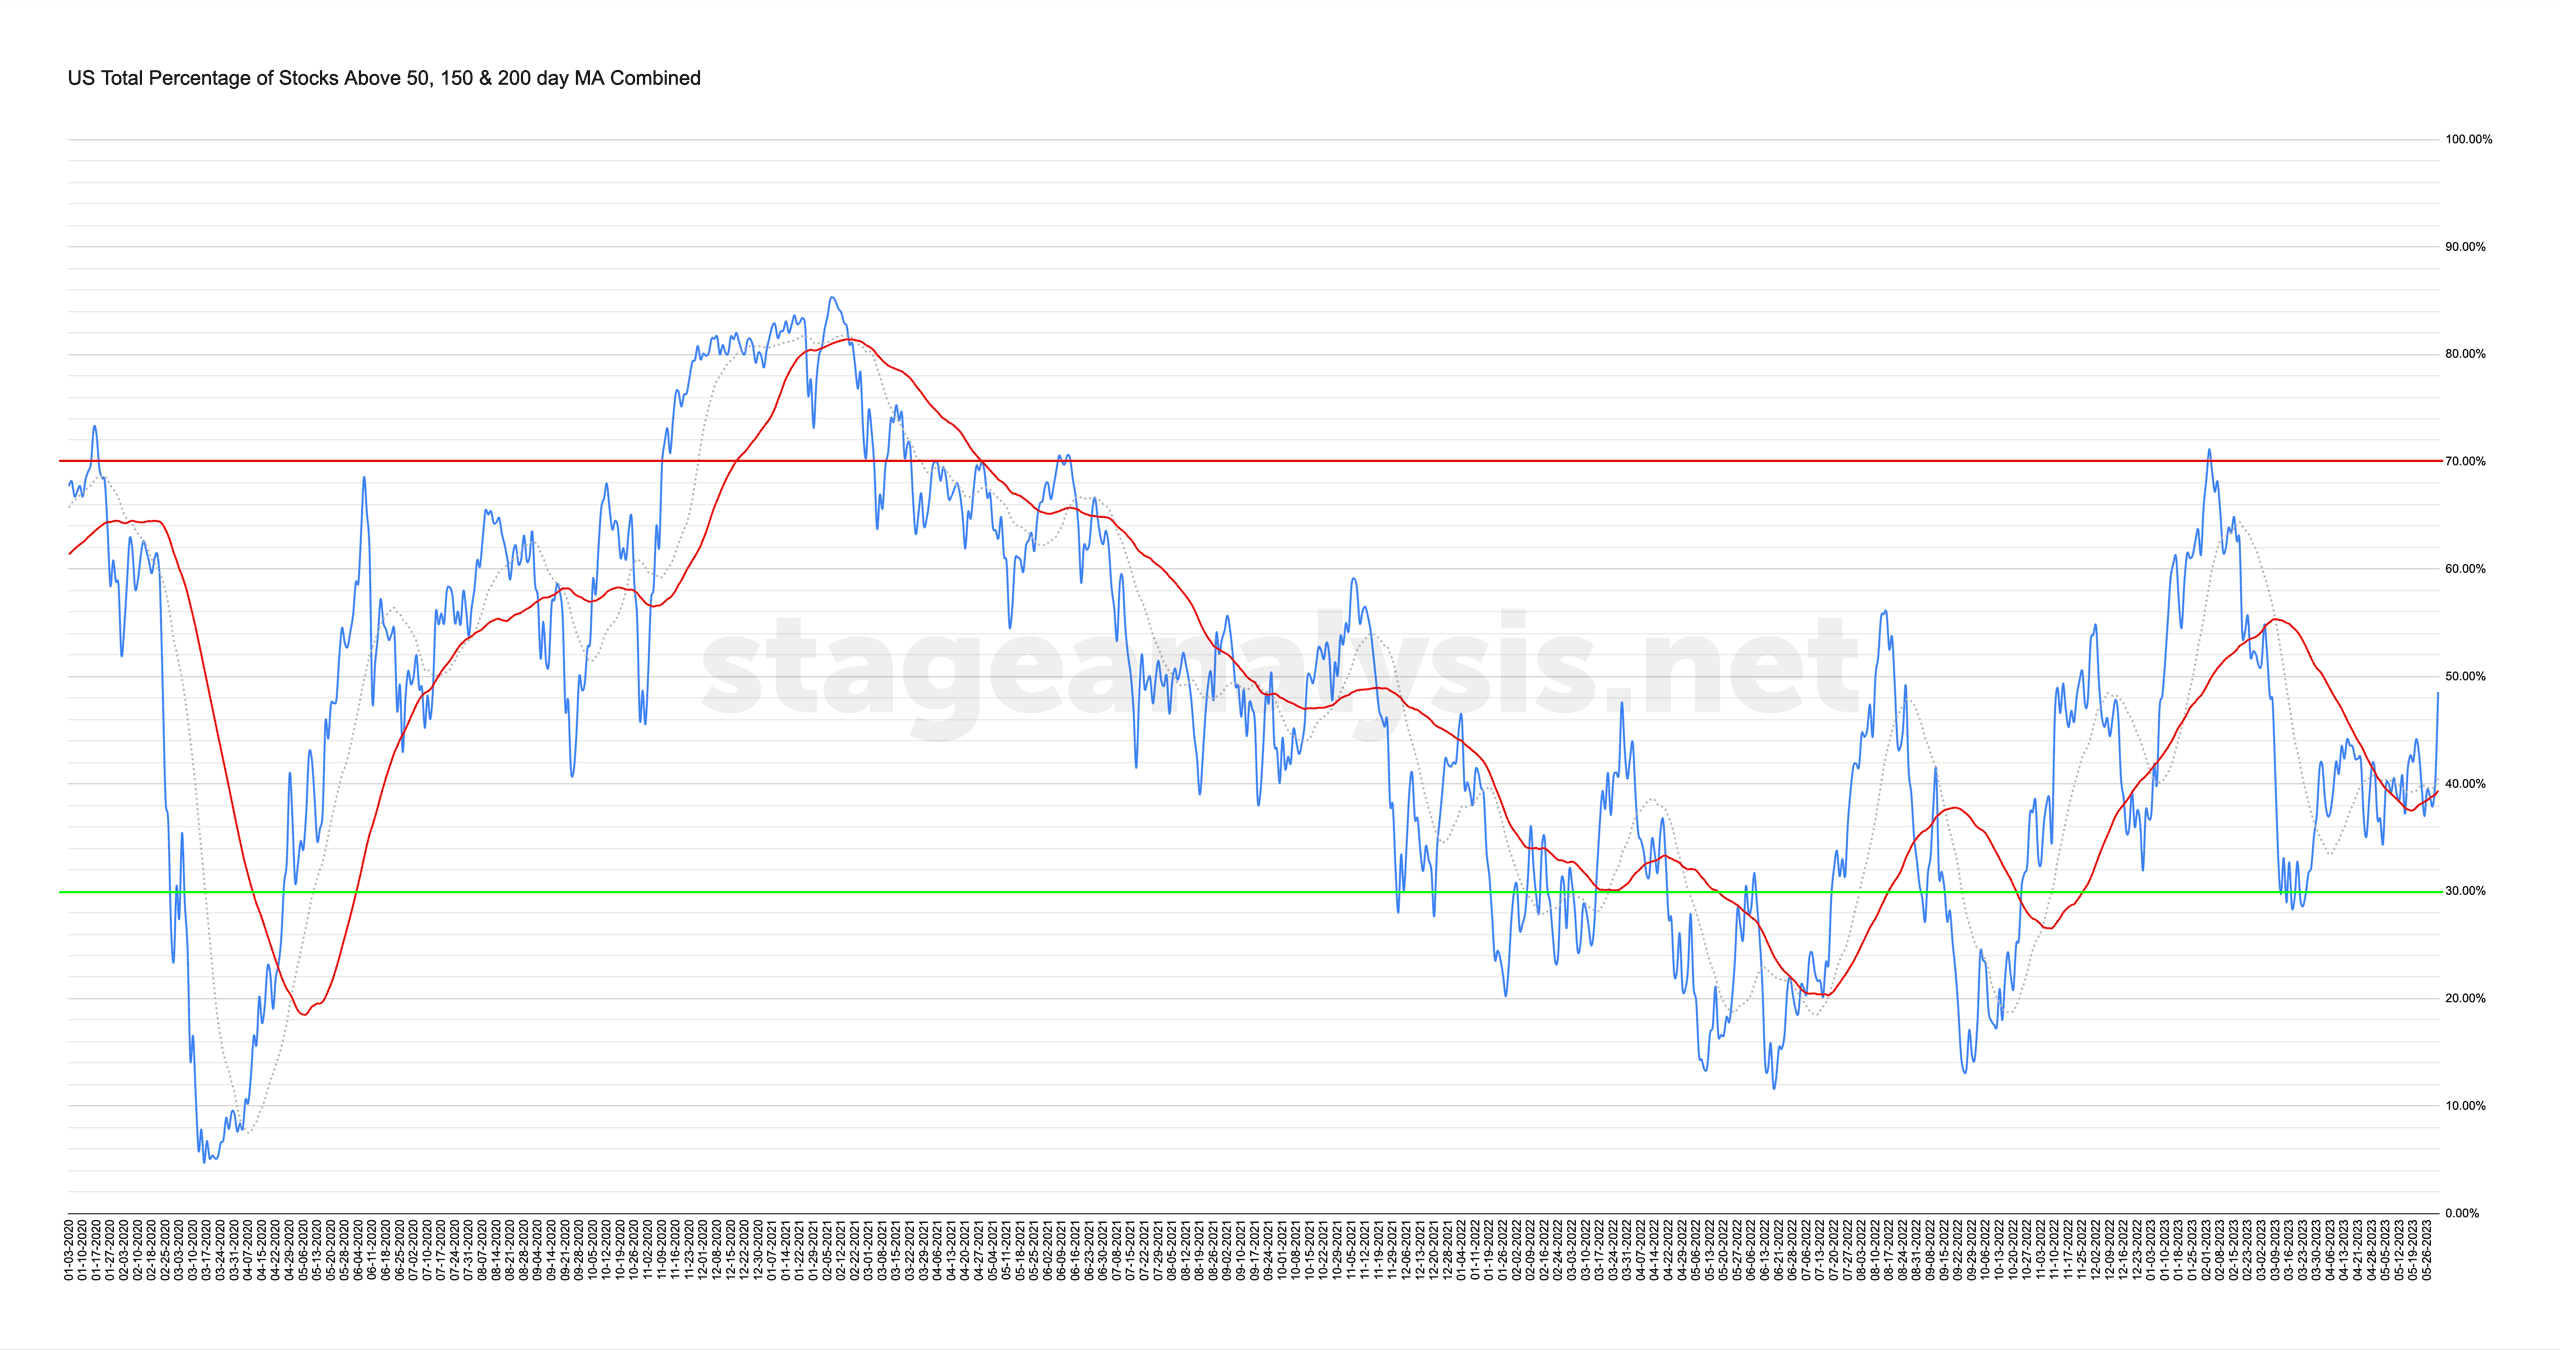
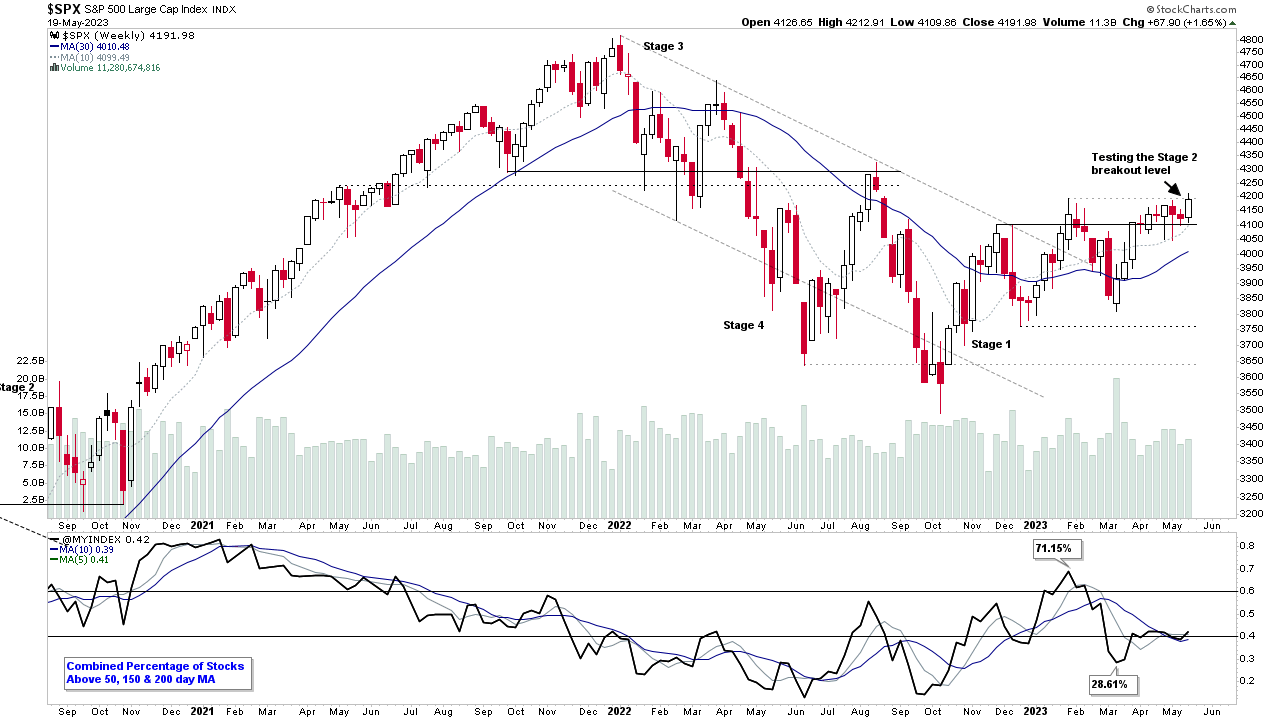
Market Breadth: Percentage of Stocks Above their 50 Day, 150 Day & 200 Day Moving Averages Combined
Custom Percentage of Stocks Above Their 50 Day, 150 Day & 200 Day Moving Averages Combined Market Breadth Charts for the Overall US Market, NYSE and Nasdaq for Market Timing and Strategy.
Read More
07 June, 2023
Stage Analysis Members Video – 7 June 2023 (59 mins)
The Stage Analysis members midweek video this week featuring analysis of the major US Indexes with discussion of the rotation to the Small Caps and NYSE stocks. Plus the short-term market breadth measures, followed by a detailed discussion and live markups of the most recently highlighted stocks for the US stocks watchlist.
Read More
04 June, 2023
Stage Analysis Members Video – 4 June 2023 (1hr 25mins)
Stage Analysis weekend video featuring the regular weekly member content of the Stage 2 breakout attempts on volume, Major US Indexes Update, Futures SATA Charts, Industry Groups RS Rankings, IBD Industry Group Bell Curve, Market Breadth Update to help to determine the weight of evidence, and finishing by discussing the US Watchlist Stocks from the weekend scans in detail on multiple timeframes...
Read More
02 June, 2023
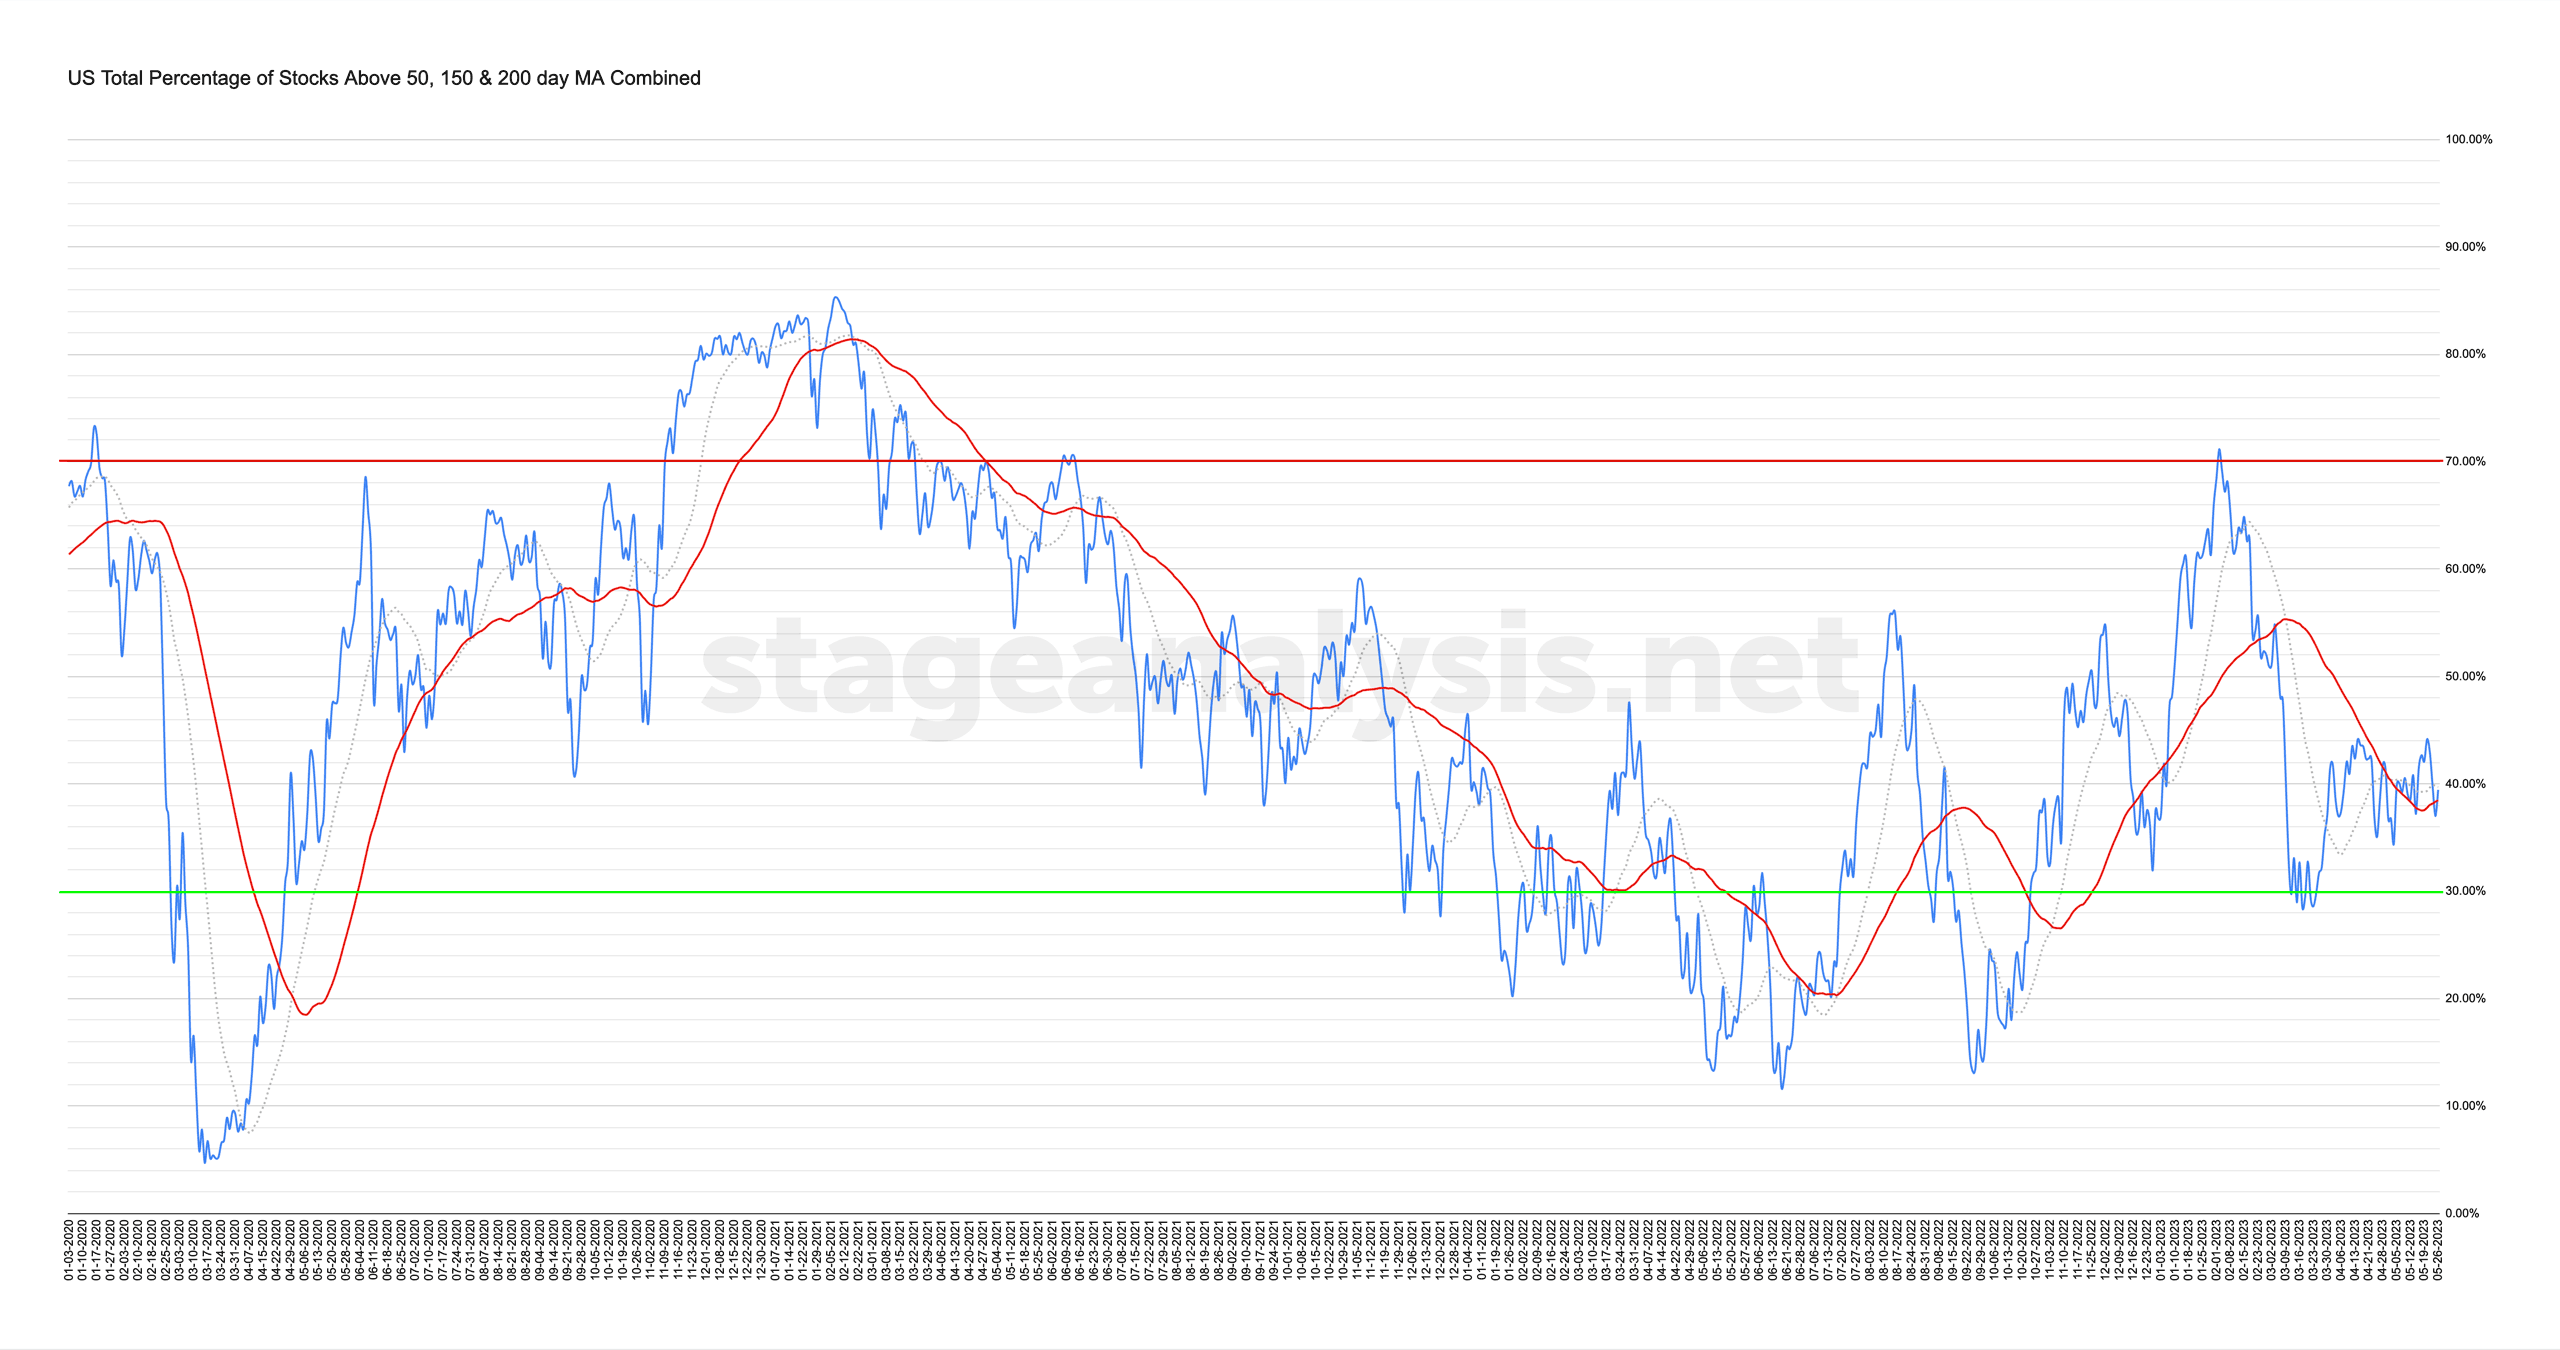
Market Breadth: Percentage of Stocks Above their 50 Day, 150 Day & 200 Day Moving Averages Combined
Custom Percentage of Stocks Above Their 50 Day, 150 Day & 200 Day Moving Averages Combined Market Breadth Charts for the Overall US Market, NYSE and Nasdaq for Market Timing and Strategy.
Read More
29 May, 2023
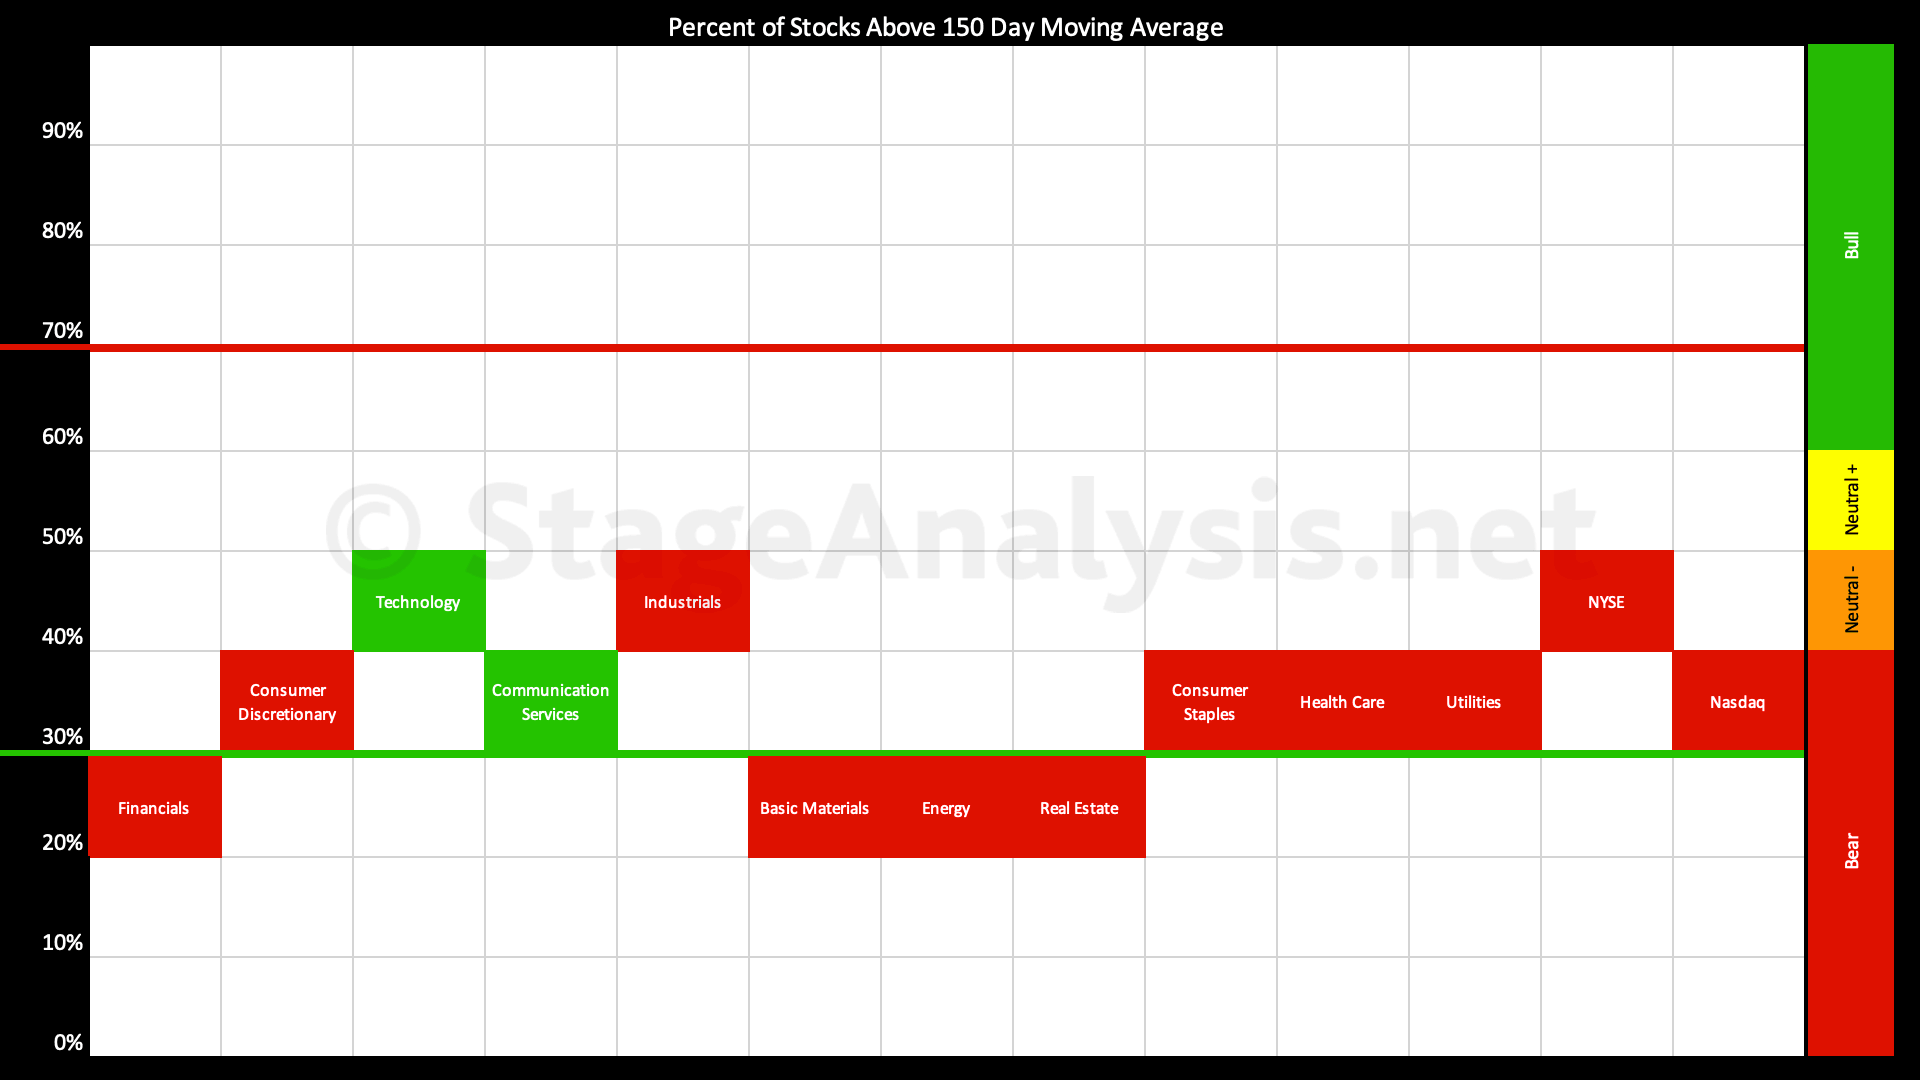
Sector Breadth: Percentage of US Stocks Above Their 150 day (30 Week) Moving Averages
The percentage of US stocks above their 150 day (30 week) moving averages in the 11 major sectors post provides a unique snapshot of the overall market health and is highlighted every few weeks in the Stage Analysis blog...
Read More

28 May, 2023
Stage Analysis Members Video – 28 May 2023 (1hr 27mins)
Stage Analysis weekend video featuring the regular weekly member content of the Major Indexes Update, Futures SATA Charts, Industry Groups RS Rankings, IBD Industry Group Bell Curve, Market Breadth Update to help to determine the weight of evidence, Stage 2 breakout attempts on volume and finishing by discussing the US Watchlist Stocks from the weekend scans in detail on multiple timeframes.
Read More
27 May, 2023
Market Breadth: Percentage of Stocks Above their 50 Day, 150 Day & 200 Day Moving Averages Combined
Custom Percentage of Stocks Above Their 50 Day, 150 Day & 200 Day Moving Averages Combined Market Breadth Charts for the Overall US Market, NYSE and Nasdaq for Market Timing and Strategy.
Read More
21 May, 2023
Stage Analysis Members Video – 21 May 2023 (1hr 14mins)
Stage Analysis weekend video discussing some of the weeks most significant Stage 2 Breakouts and Continuation attempts, plus the regular weekly member content of the Major Indexes Update, Futures SATA Charts, Industry Groups RS Rankings, IBD Industry Group Bell Curve, and Market Breadth Update to help to determine the weight of evidence...
Read More