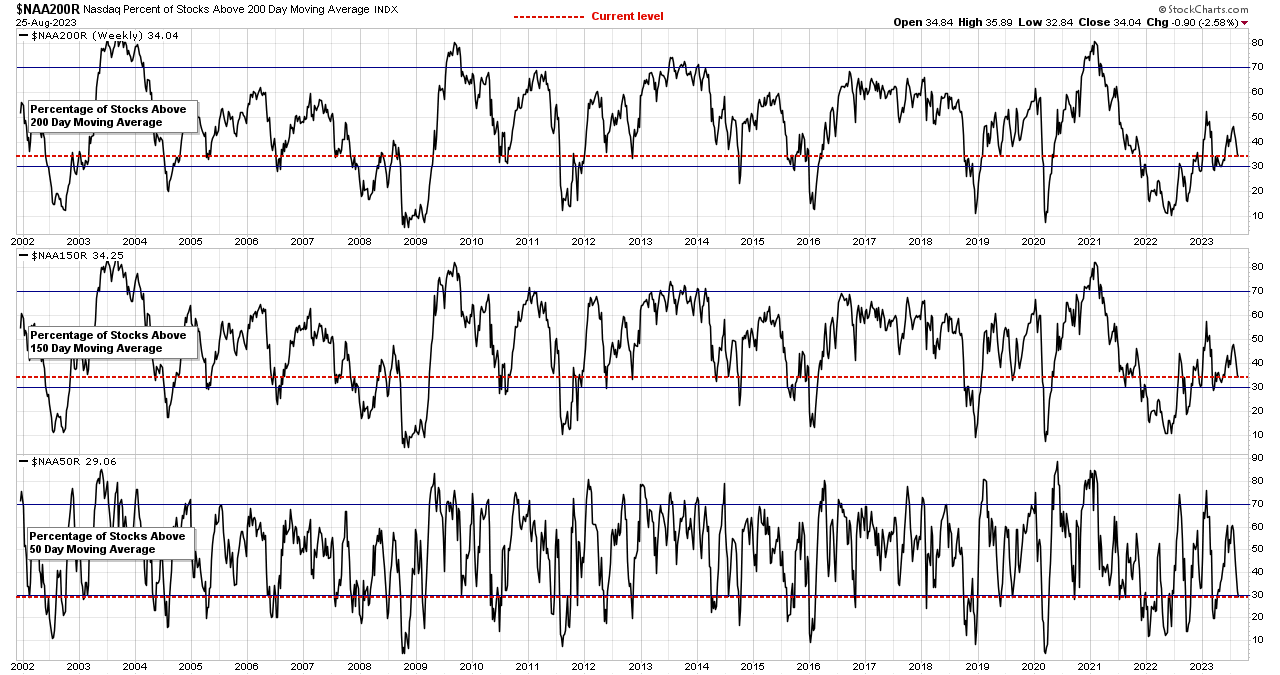
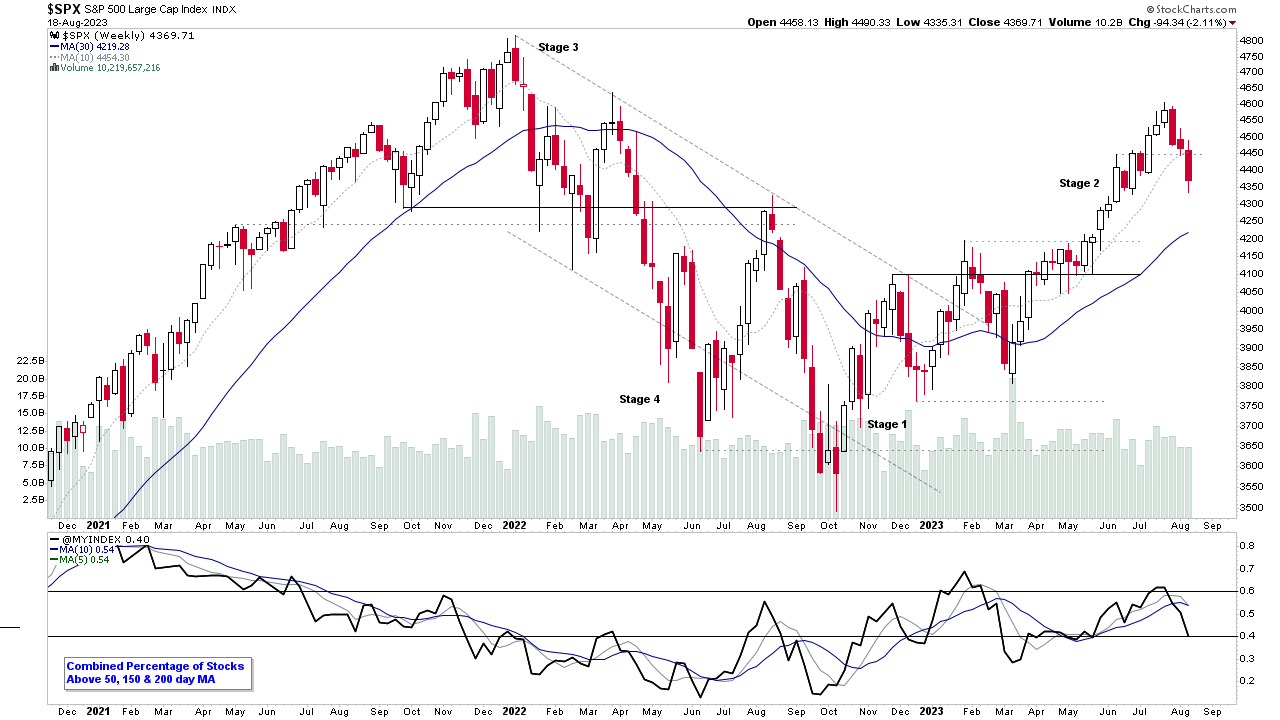
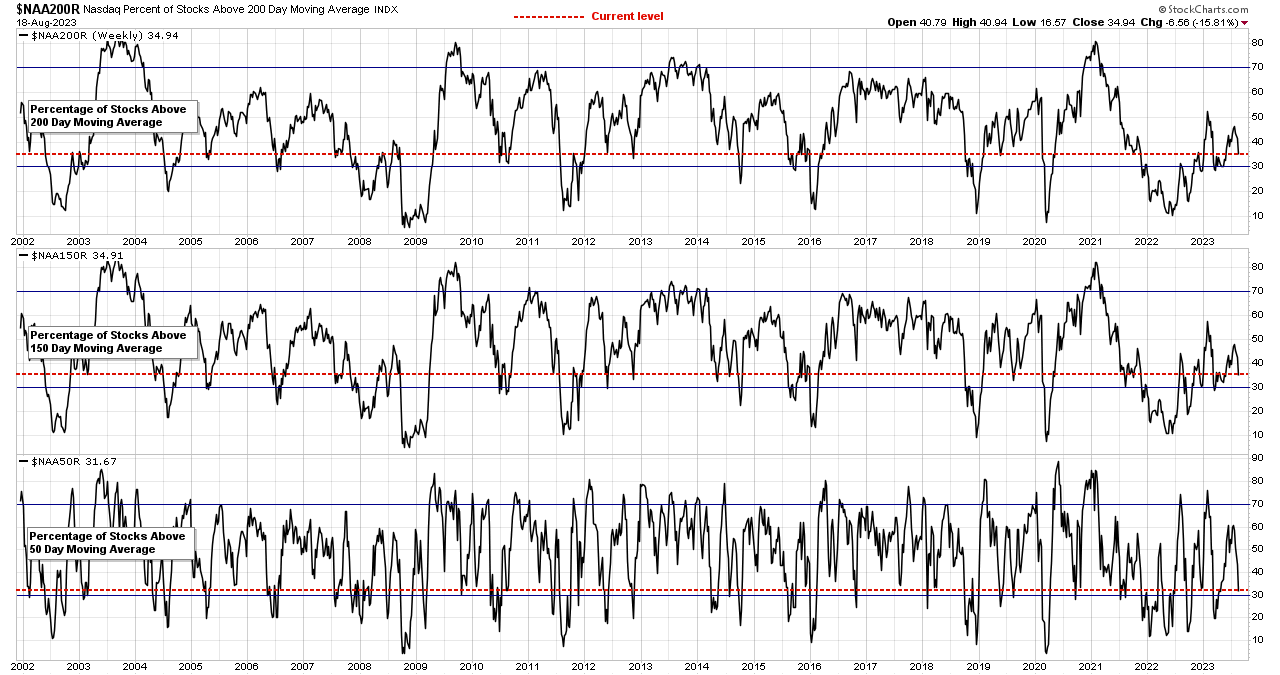
Custom Percentage of Stocks Above Their 50 Day, 150 Day & 200 Day Moving Averages Combined Market Breadth Charts for the Overall US Market, NYSE and Nasdaq for Market Timing and Strategy.
Read More

Blog
22 August, 2023
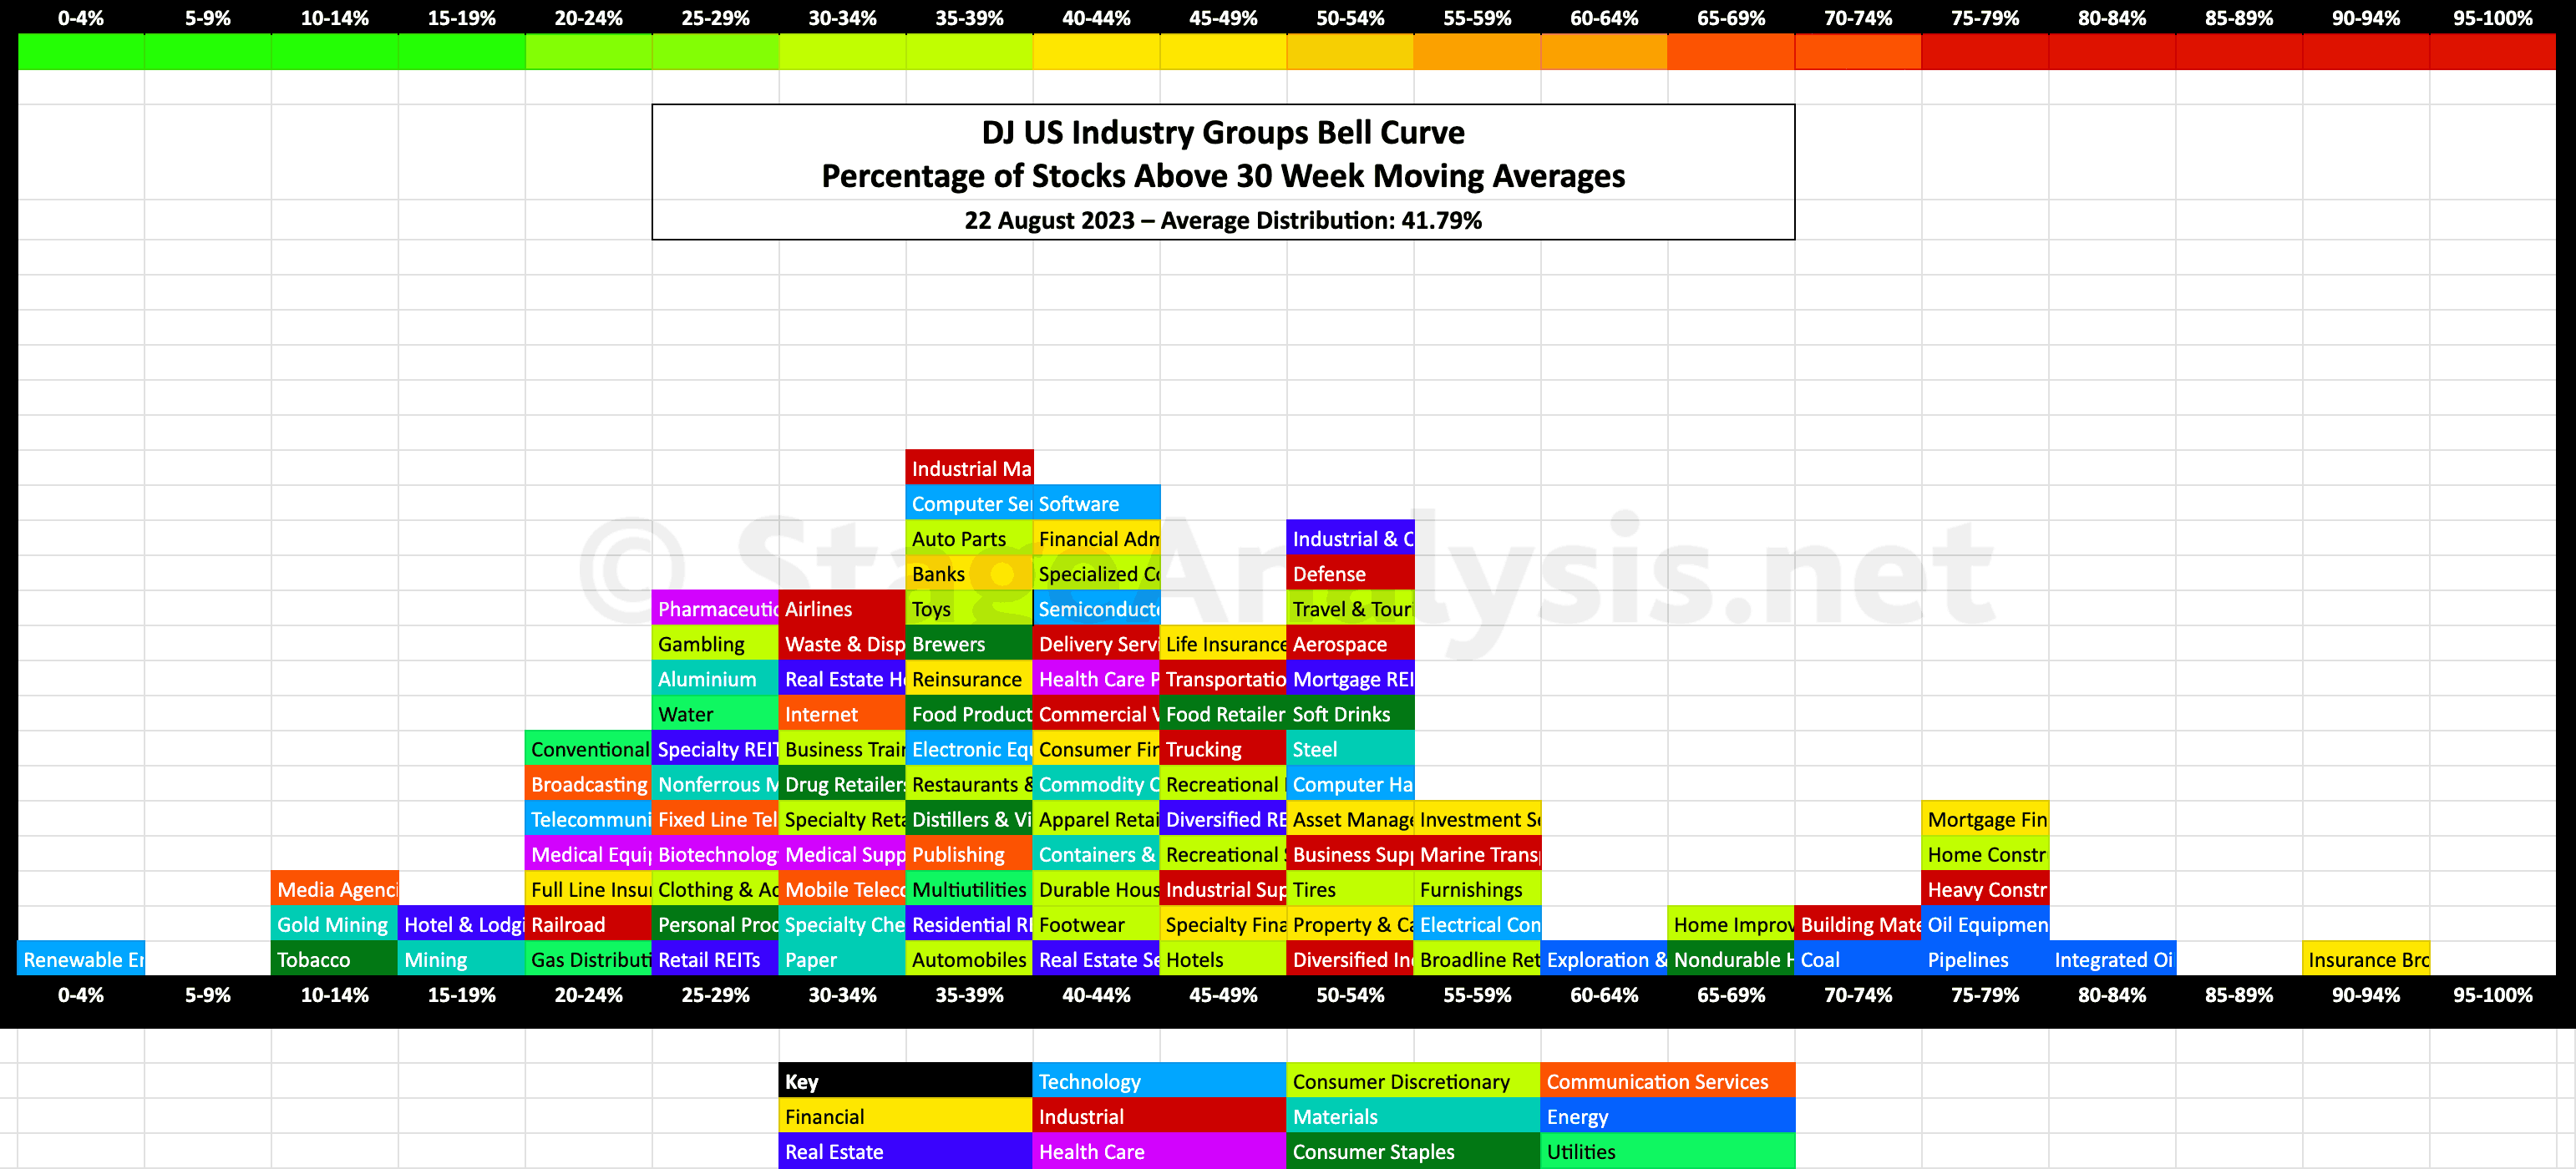
US Industry Groups Bell Curve – Exclusive to StageAnalysis.net
Exclusive graphic of the 104 Dow Jones Industry Groups showing the Percentage of Stocks Above 30 week MA in each group visualised as a Bell Curve chart...
Read More
20 August, 2023
Stage Analysis Members Video – 20 August 2023 (1hr 27mins)
Stage Analysis members video with the usual in-depth review of the market and the various breadth measures that we use in the Stage Analysis method to determine the Weight of Evidence.
Read More
19 August, 2023
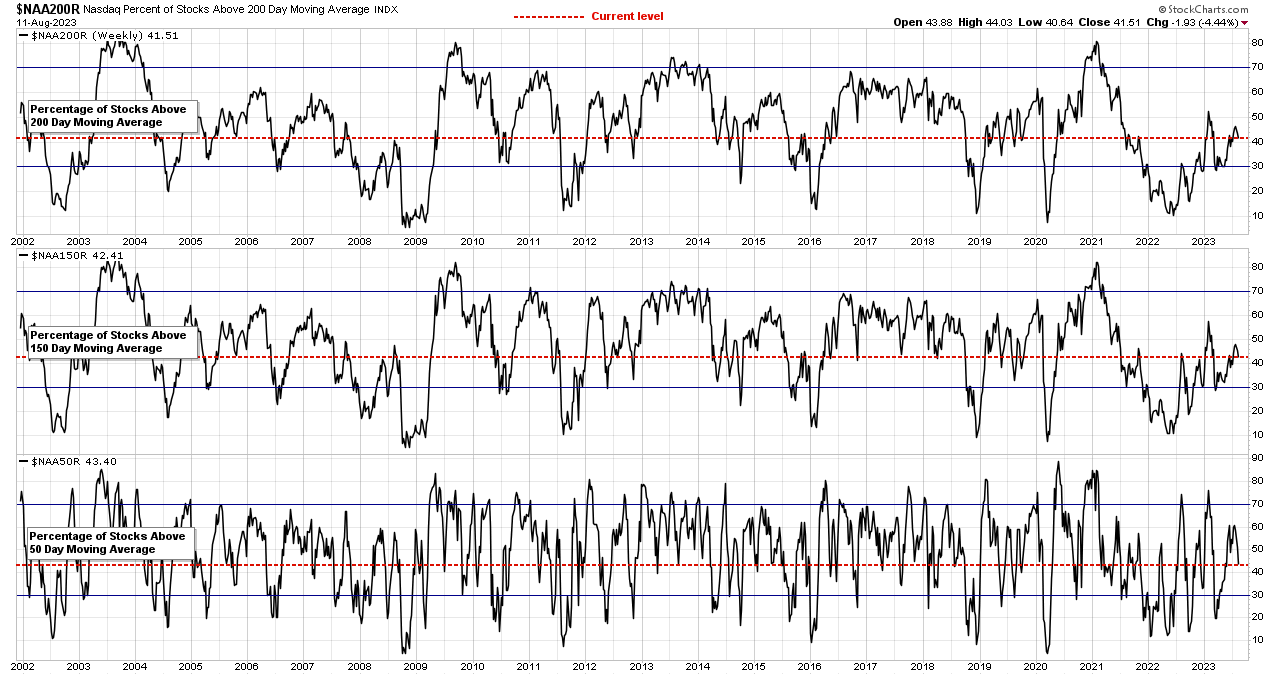
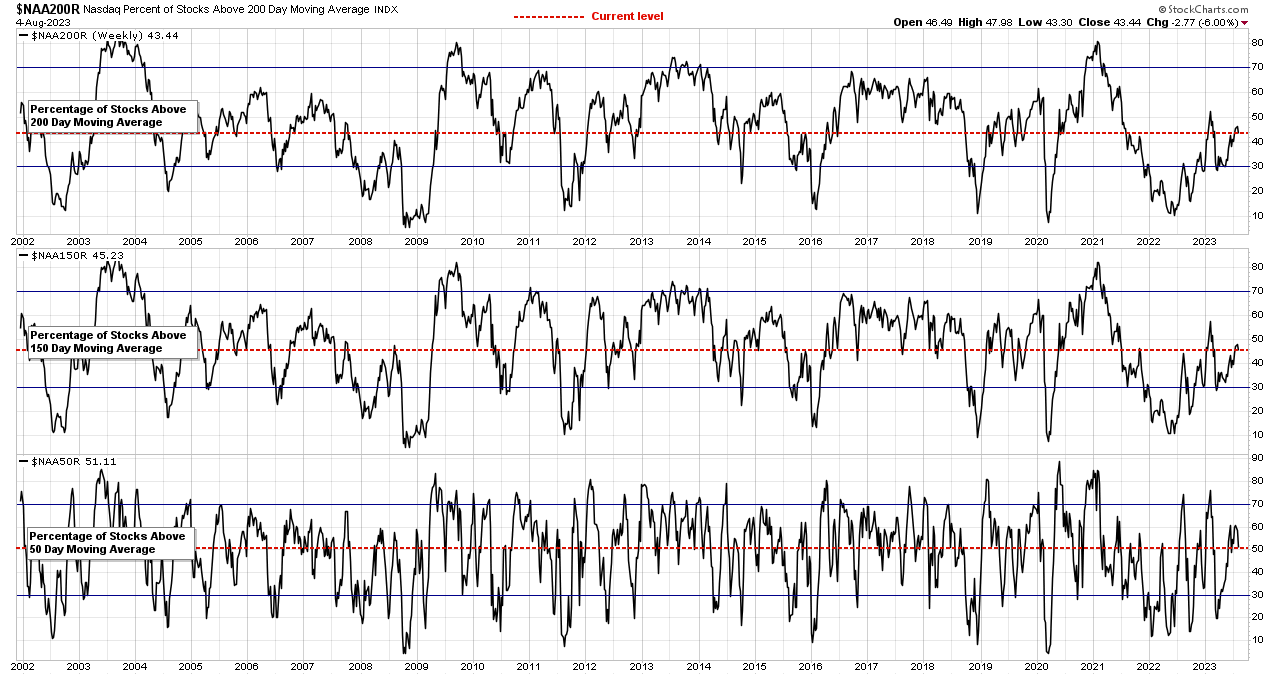
Market Breadth: Percentage of Stocks Above their 50 Day, 150 Day & 200 Day Moving Averages Combined
Custom Percentage of Stocks Above Their 50 Day, 150 Day & 200 Day Moving Averages Combined Market Breadth Charts for the Overall US Market, NYSE and Nasdaq for Market Timing and Strategy.
Read More
14 August, 2023
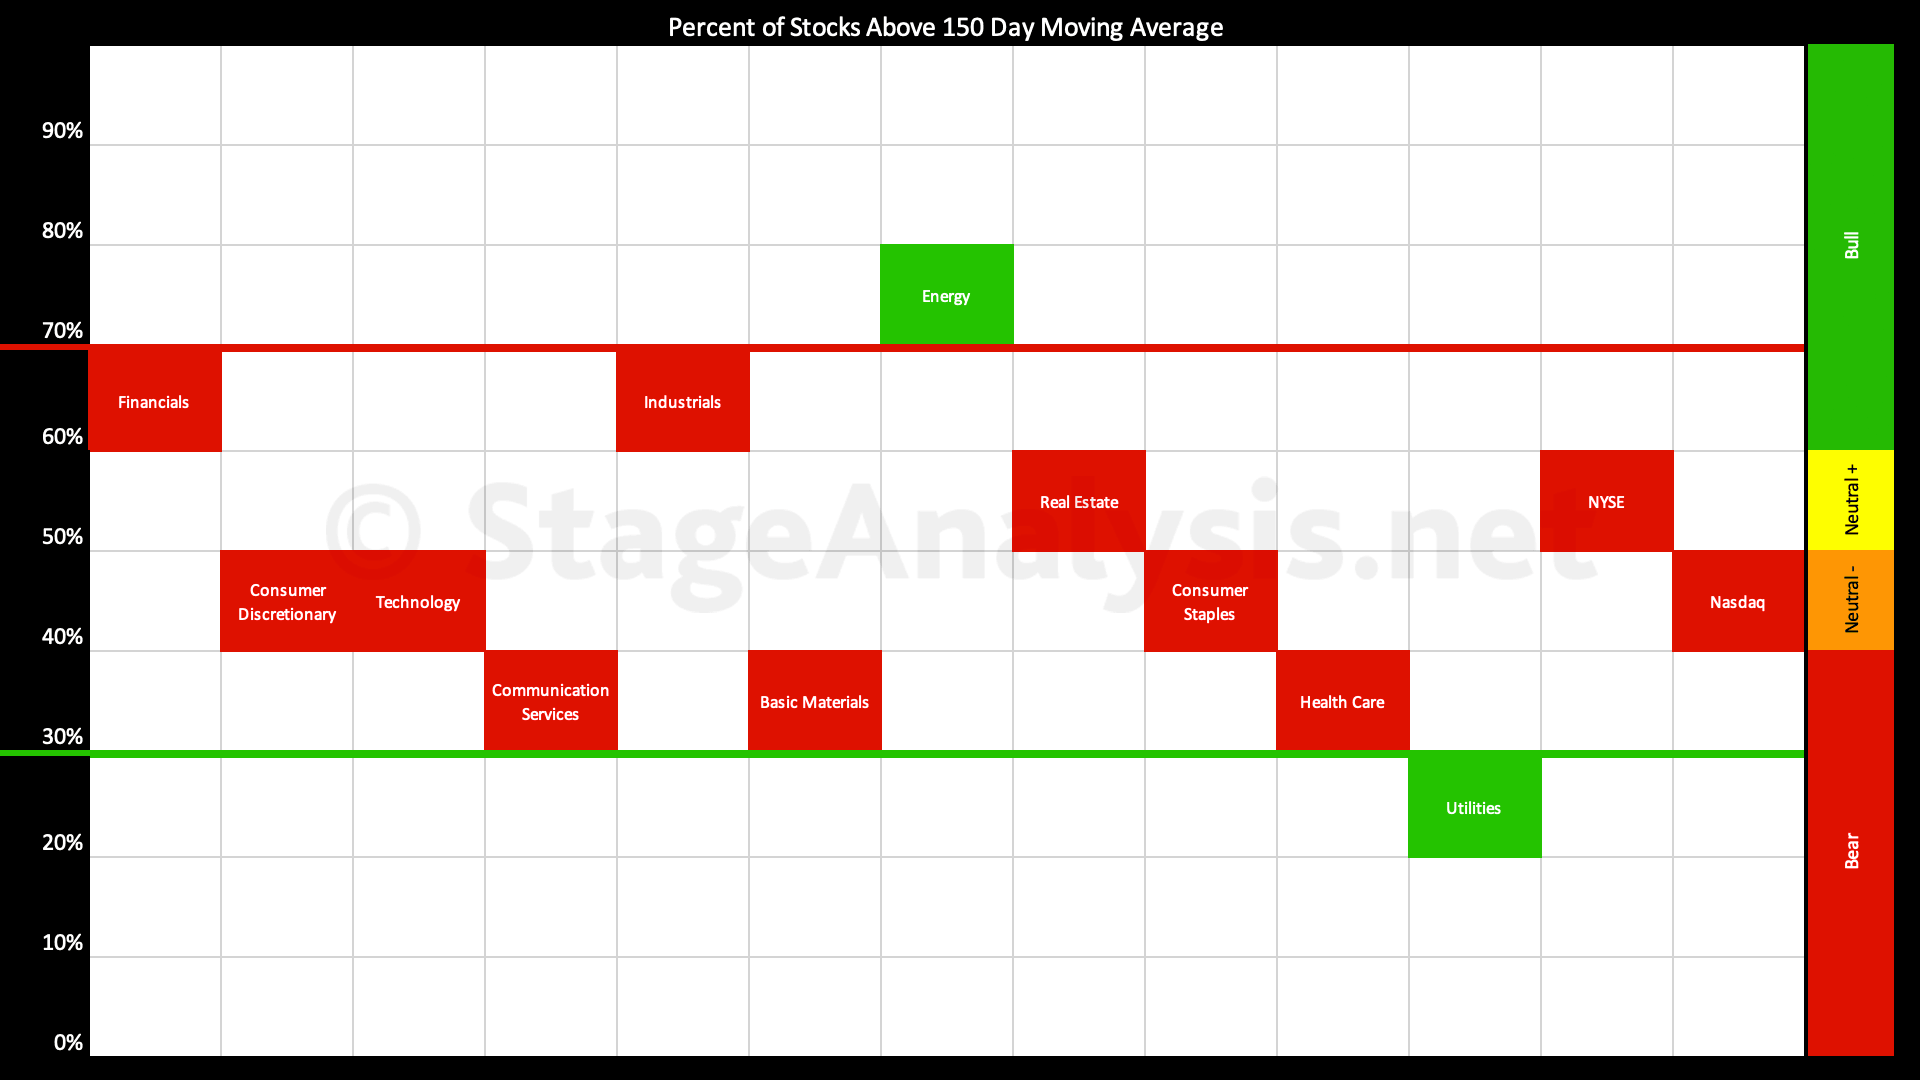
Sector Breadth: Percentage of US Stocks Above Their 150 day (30 Week) Moving Averages
The Percentage of US Stocks Above Their 150 day Moving Averages in the 11 major sectors has declined by -11.96% over the last few weeks since the previous post on the 31st July 2023, moving the overall average down to 47.42%, which in the Neutral- zone, just below the mid-point. Hence a very neutral overall field position...
Read More
13 August, 2023
Stage Analysis Members Video – 13 August 2023 (1hr 30mins)
The Stage Analysis members video begins this week by discussing some of the weeks strongest volume movers in Stage 2, before moving onto the regular member content, including the Major Indexes Update, Futures SATA Charts, Industry Groups RS Rankings, IBD Industry Group Bell Curve – Bullish Percent, Market Breadth Update to determine the Weight of Evidence and finally analysis of the recent watchlist stocks in detail on multiple timeframes.
Read More
12 August, 2023
Market Breadth: Percentage of Stocks Above their 50 Day, 150 Day & 200 Day Moving Averages Combined
Custom Percentage of Stocks Above Their 50 Day, 150 Day & 200 Day Moving Averages Combined Market Breadth Charts for the Overall US Market, NYSE and Nasdaq for Market Timing and Strategy.
Read More
09 August, 2023
Stage Analysis Members Video – 9 August 2023 (59mins)
Stage Analysis midweek video discussing the pullback in the major US indexes, and Stage Analysis multiple timeframe methods for dealing with pullback entries. A discussion of the new Anchored Volume Profile tool in Tradingview followed by the market breadth update using the short-term measures, and finally analysis of the most recent watchlist stocks.
Read More
06 August, 2023
Stage Analysis Members Video – 6 August 2023 (1hr 28mins)
Stage Analysis members video discussing some of the weeks strongest volume movers in Stage 2, as well as all the usual member content, i.e. Major Indexes Update, Futures SATA Charts, Industry Groups RS Rankings, IBD Industry Group Bell Curve – Bullish Percent, Market Breadth Update to determine the Weight of Evidence and finishing with analysis of the recent watchlist stocks in detail on multiple timeframes.
Read More
05 August, 2023
Market Breadth: Percentage of Stocks Above their 50 Day, 150 Day & 200 Day Moving Averages Combined
Custom Percentage of Stocks Above Their 50 Day, 150 Day & 200 Day Moving Averages Combined Market Breadth Charts for the Overall US Market, NYSE and Nasdaq for Market Timing and Strategy.
Read More