Custom Percentage of Stocks Above Their 50 Day, 150 Day & 200 Day Moving Averages Combined Market Breadth Charts for the Overall US Market, NYSE and Nasdaq for Market Timing and Strategy.
Read More

Blog
04 October, 2023
Stage Analysis Members Video – 4 October 2023 (47mins)
Stage Analysis midweek video discussing the major US stock market indexes price action, as well as the short-term market breadth measures. Followed by a detailed discussion of the recent watchlist stocks on multiple timeframes.
Read More
01 October, 2023
Stage Analysis Members Video – 1 October 2023 (1hr 12mins)
Stage Analysis weekend video featuring the regular members content of the the Major US Indexes Update, Futures SATA Charts, Industry Groups RS Rankings, IBD Industry Group Bell Curve, Market Breadth Update to help to determine the weight of evidence, strong volume movers Stage 2 and discussion of the US Watchlist Stocks with detailed live markups on multiple timeframes...
Read More
30 September, 2023
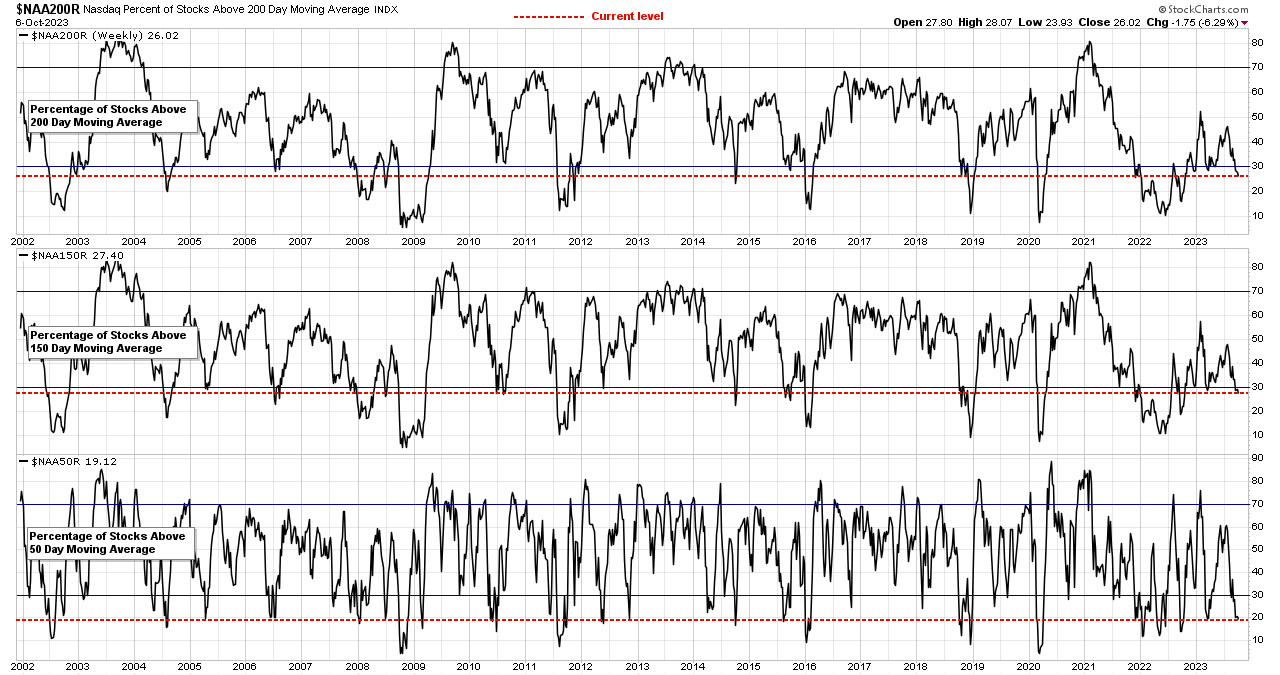
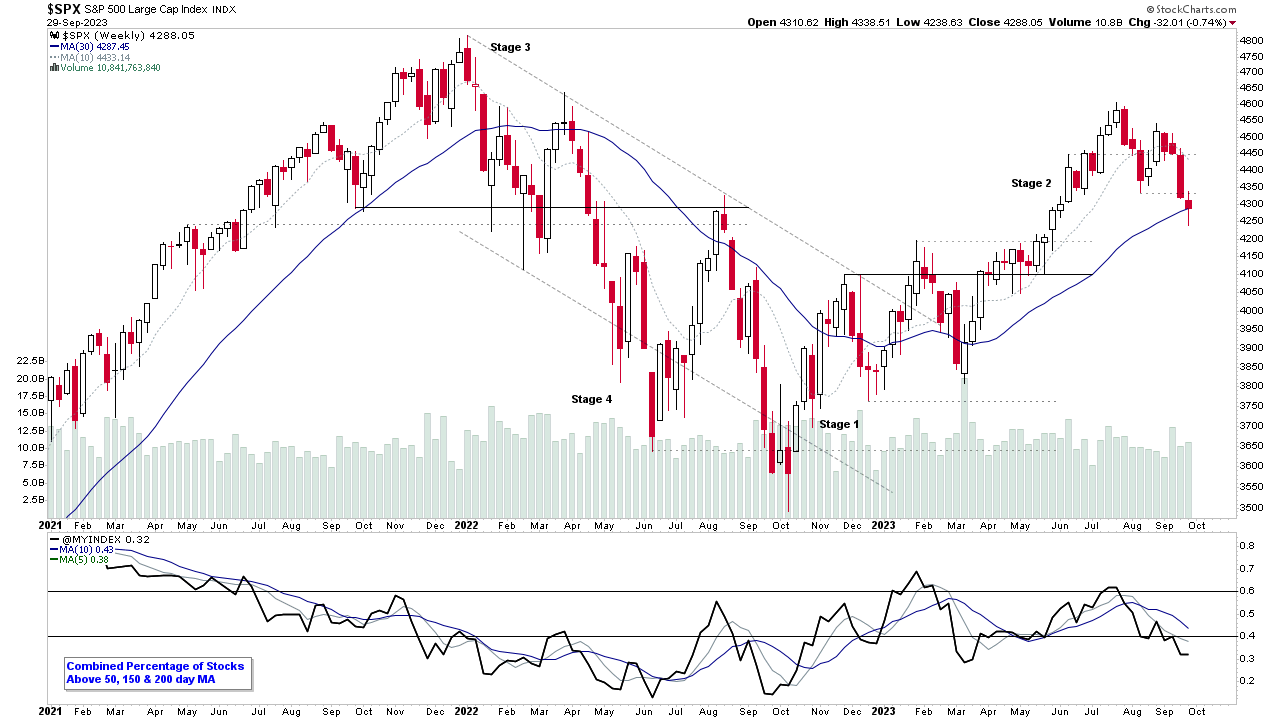
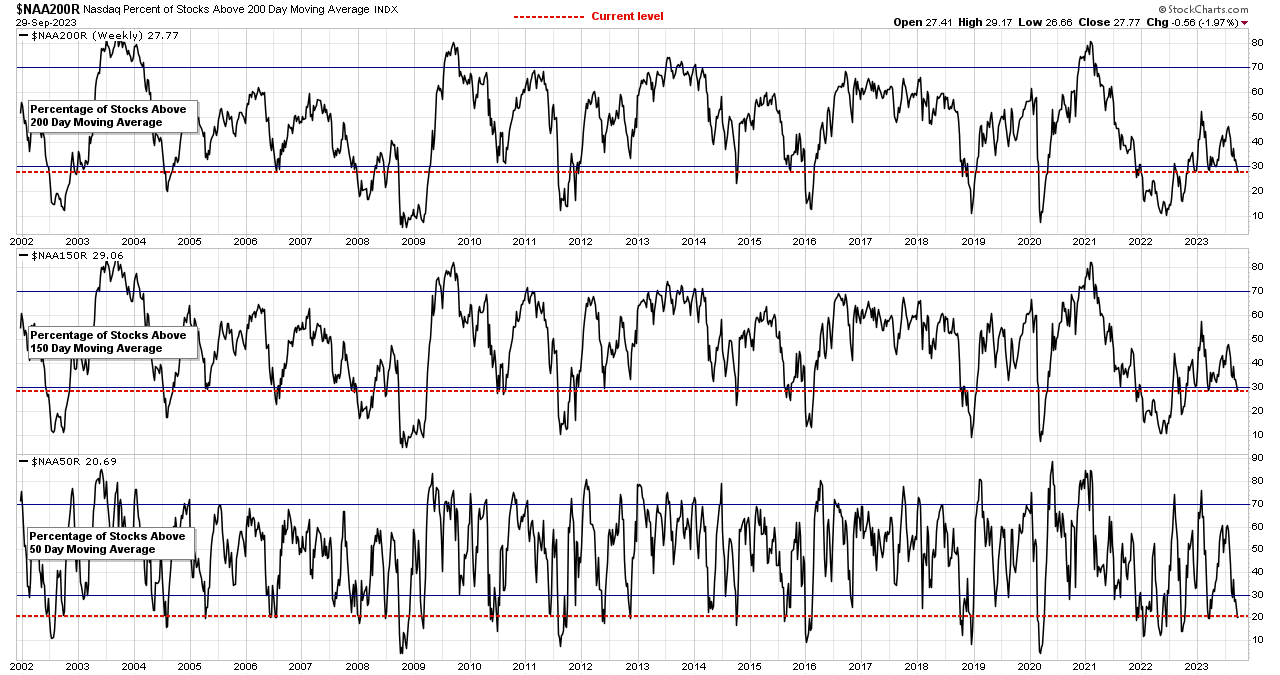
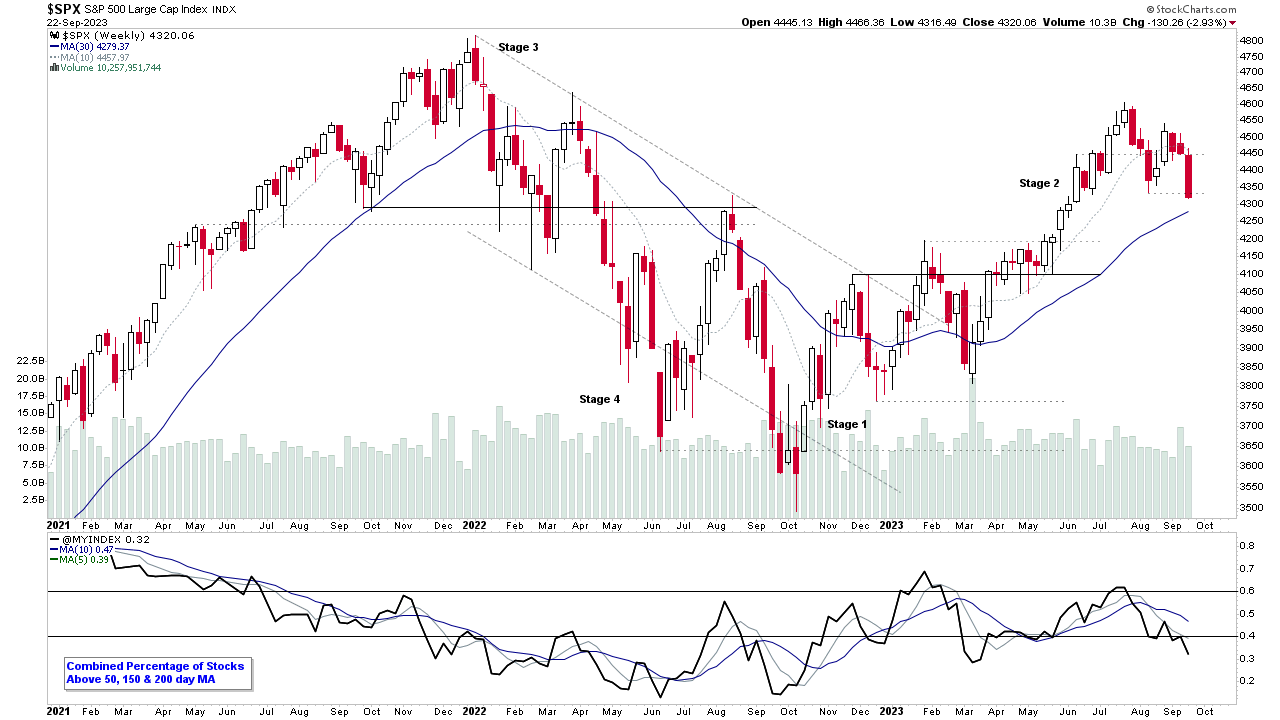
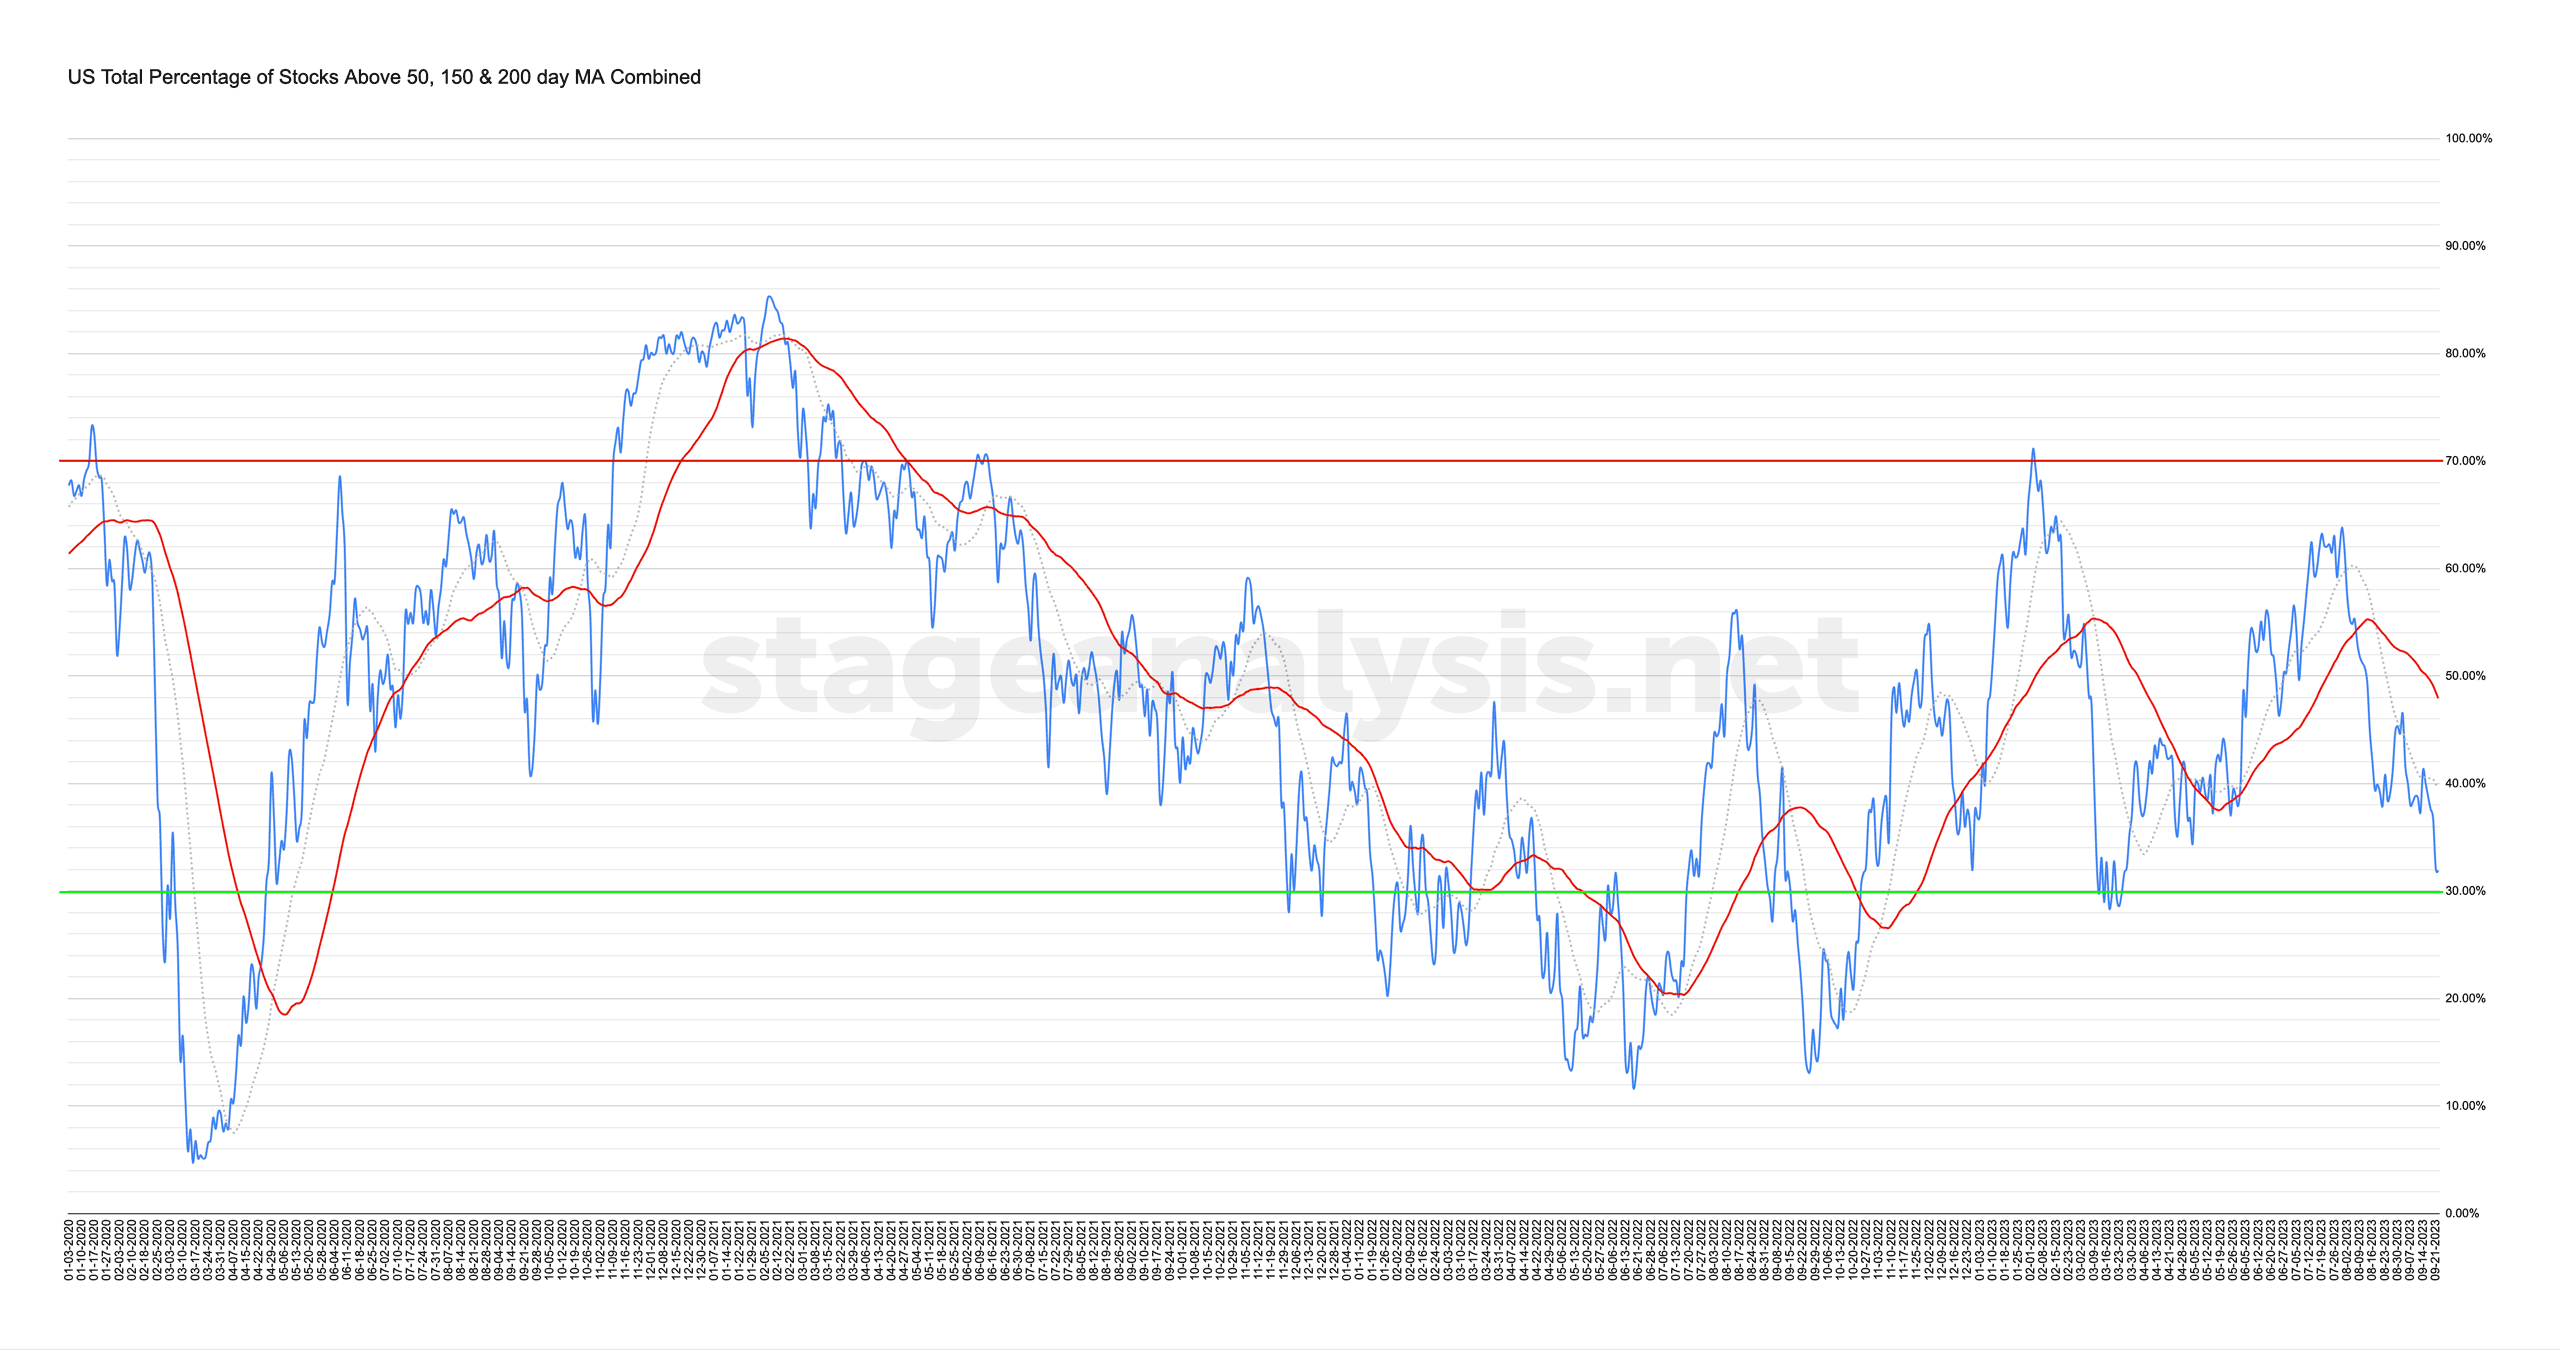
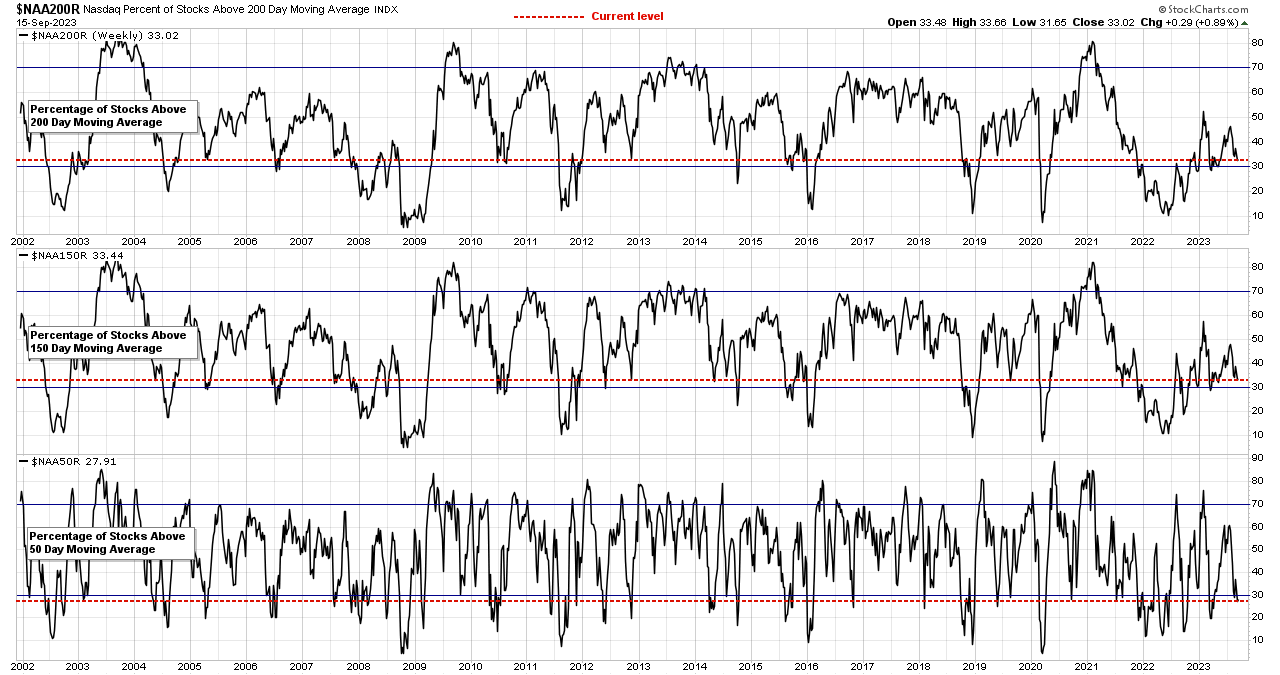
Market Breadth: Percentage of Stocks Above their 50 Day, 150 Day & 200 Day Moving Averages Combined
Custom Percentage of Stocks Above Their 50 Day, 150 Day & 200 Day Moving Averages Combined Market Breadth Charts for the Overall US Market, NYSE and Nasdaq for Market Timing and Strategy.
Read More
27 September, 2023
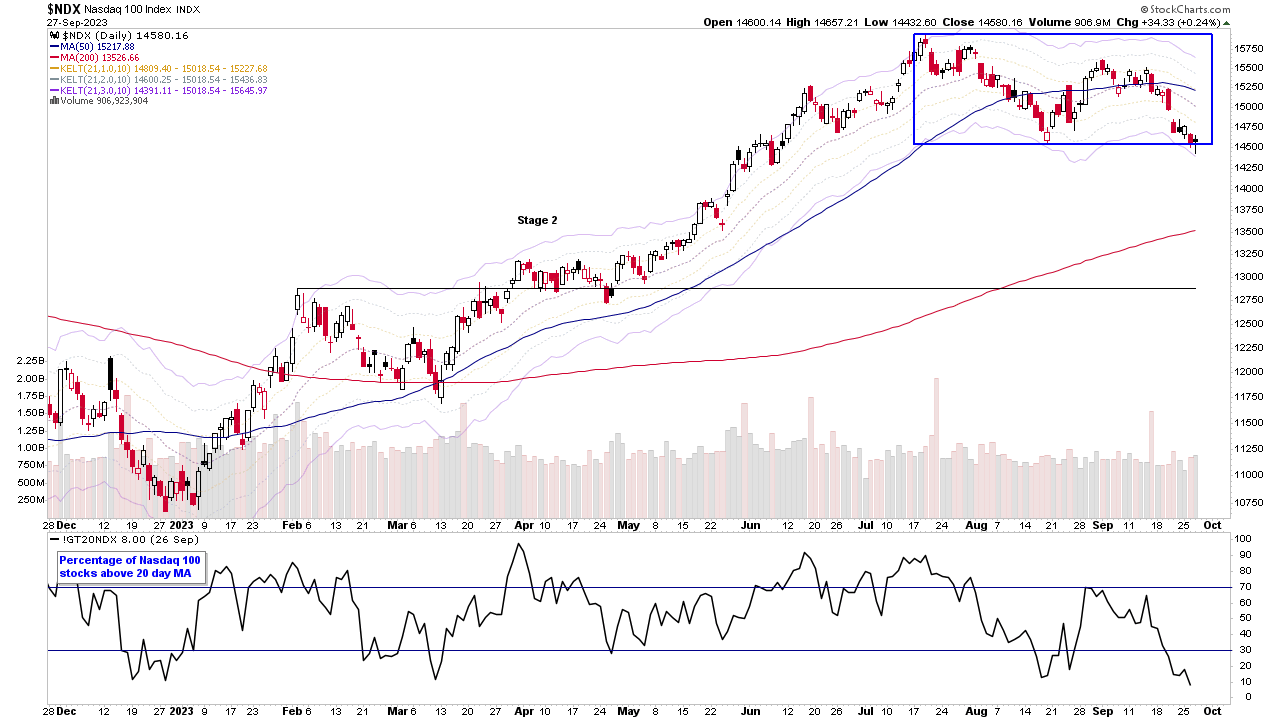
Stage Analysis Members Video – 27 September 2023 (57mins)
Stage Analysis midweek video discussing the price action in the market and short-term breadth measures. Also a look at the Stage positions of the S&P 500 leading stocks year to date as well as discussion of the recent watchlist stocks...
Read More
25 September, 2023
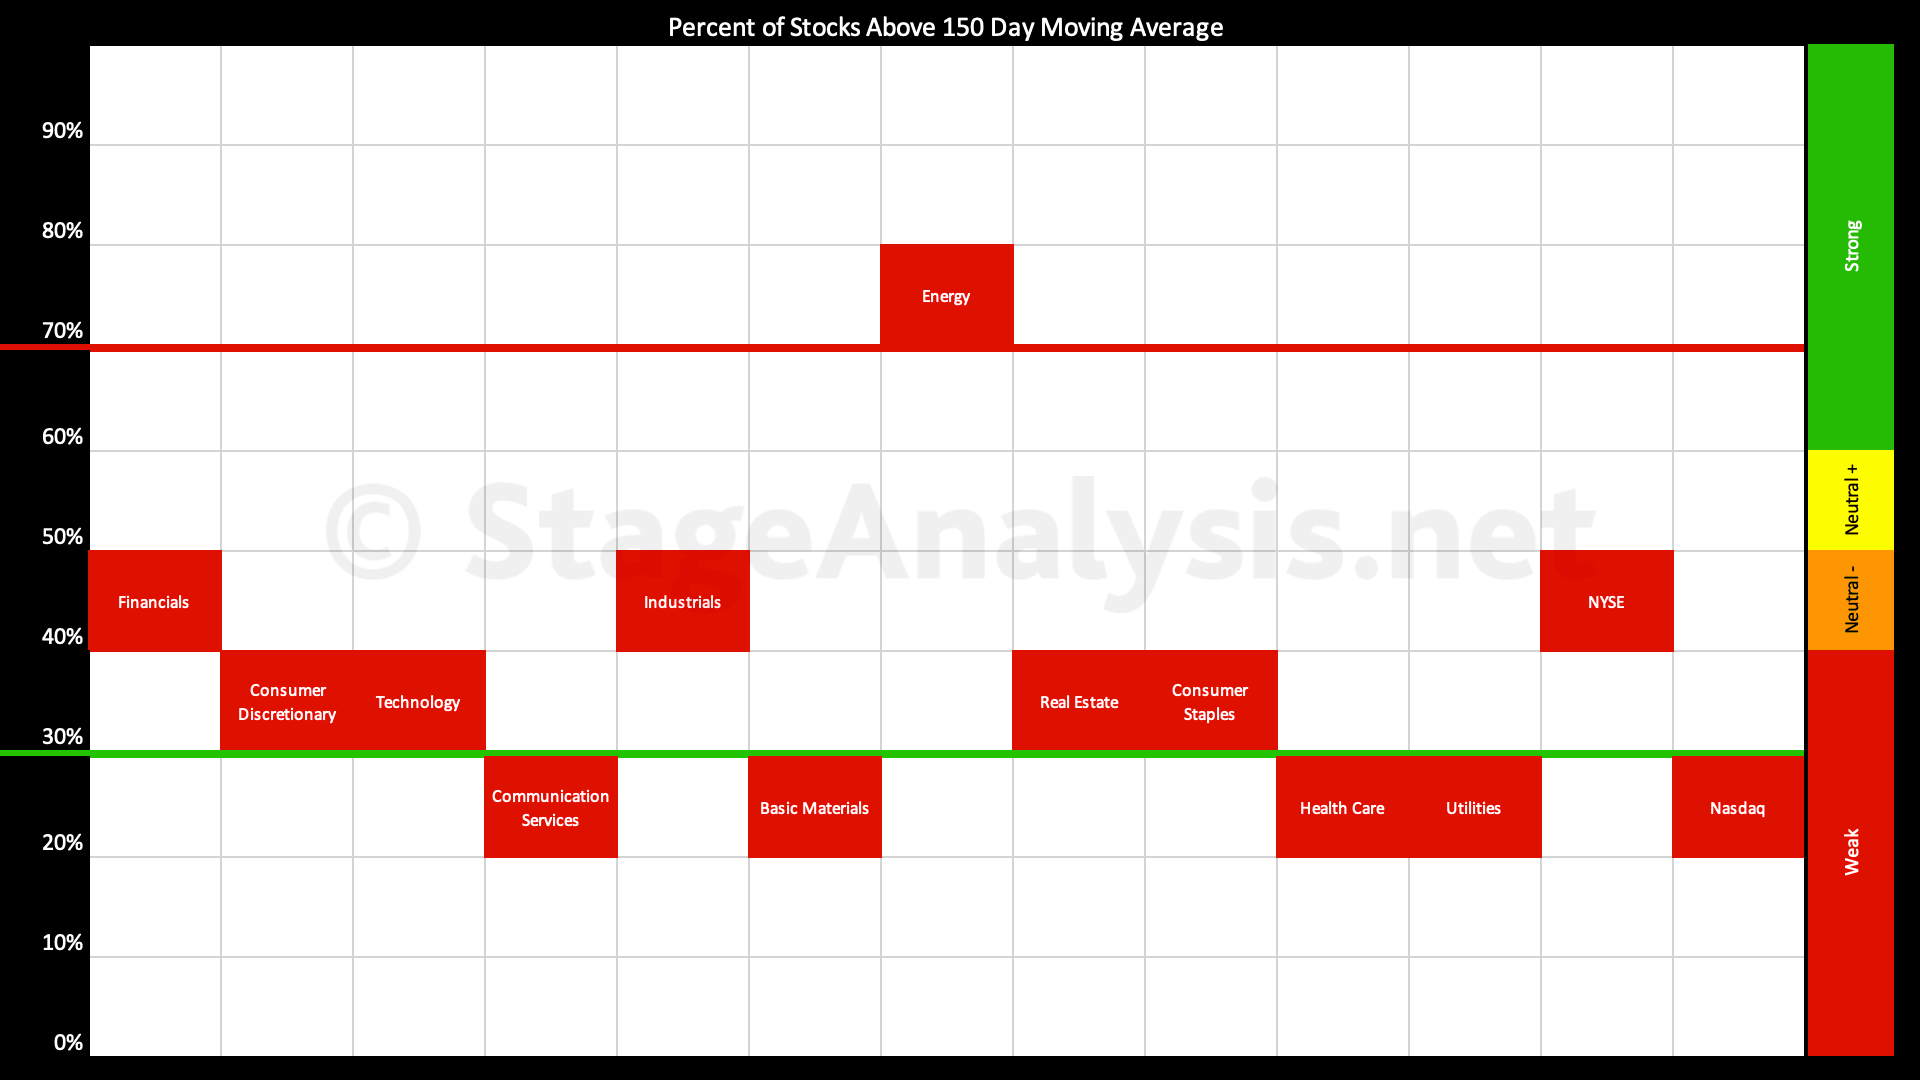
Sector Breadth: Percentage of US Stocks Above Their 150 day (30 Week) Moving Averages
The Percentage of US Stocks Above Their 150 day Moving Averages in the 11 major sectors has continued to deteriorate over the last month, and has fallen a further -6.86% since the previous post...
Read More
24 September, 2023
Stage Analysis Members Video – 24 September 2023 (1hr 21mins)
The regular weekend Stage Analysis members video featuring analysis of the major US indexes and futures charts, Industry Groups Relative Strength (RS) Rankings, the IBD Industry Group Bell Curve – Bullish Percent, the Market Breadth Update to help to determine the Weight of Evidence, and finally Stage Analysis of some of the recent stocks highlighted in the watchlist in detail, and on multiple timeframes...
Read More
23 September, 2023
Market Breadth: Percentage of Stocks Above their 50 Day, 150 Day & 200 Day Moving Averages Combined
Custom Percentage of Stocks Above Their 50 Day, 150 Day & 200 Day Moving Averages Combined Market Breadth Charts for the Overall US Market, NYSE and Nasdaq for Market Timing and Strategy.
Read More
20 September, 2023
Stage Analysis Members Video – 20 September 2023 (21mins)
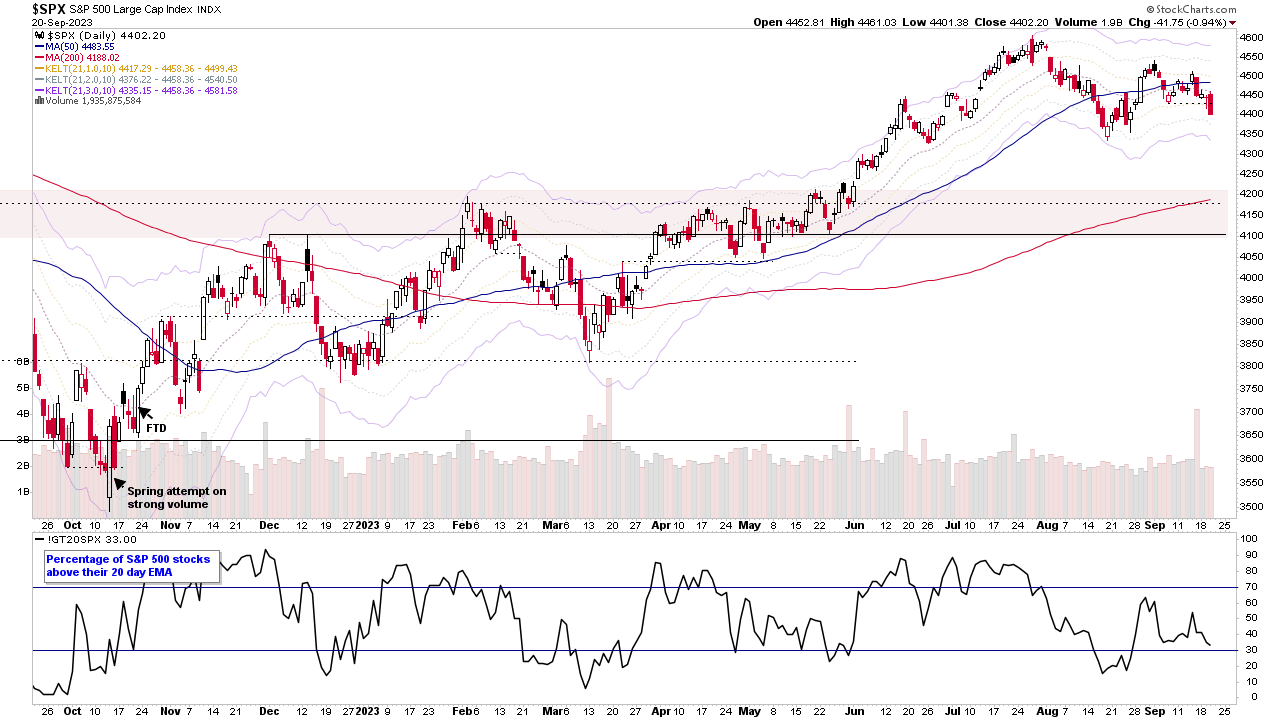
Stage Analysis midweek video discussing the major US stock market indexes and some of the short-term market breadth measures
Read More
17 September, 2023
Market Breadth: Percentage of Stocks Above their 50 Day, 150 Day & 200 Day Moving Averages Combined
Custom Percentage of Stocks Above Their 50 Day, 150 Day & 200 Day Moving Averages Combined Market Breadth Charts for the Overall US Market, NYSE and Nasdaq for Market Timing and Strategy.
Read More