Stage Analysis members weekend video covering the Major US Indexes, Futures Charts, Industry Groups Relative Strength (RS) Rankings, IBD Industry Group Bell Curve – Bullish Percent, Significant Weekly Bars, Crypto Coins update and the US watchlist stocks in detail on multiple timeframes.
Read More

Blog
12 November, 2023
Stage Analysis Members Video – 12 November 2023 (1hr 11mins)
11 November, 2023
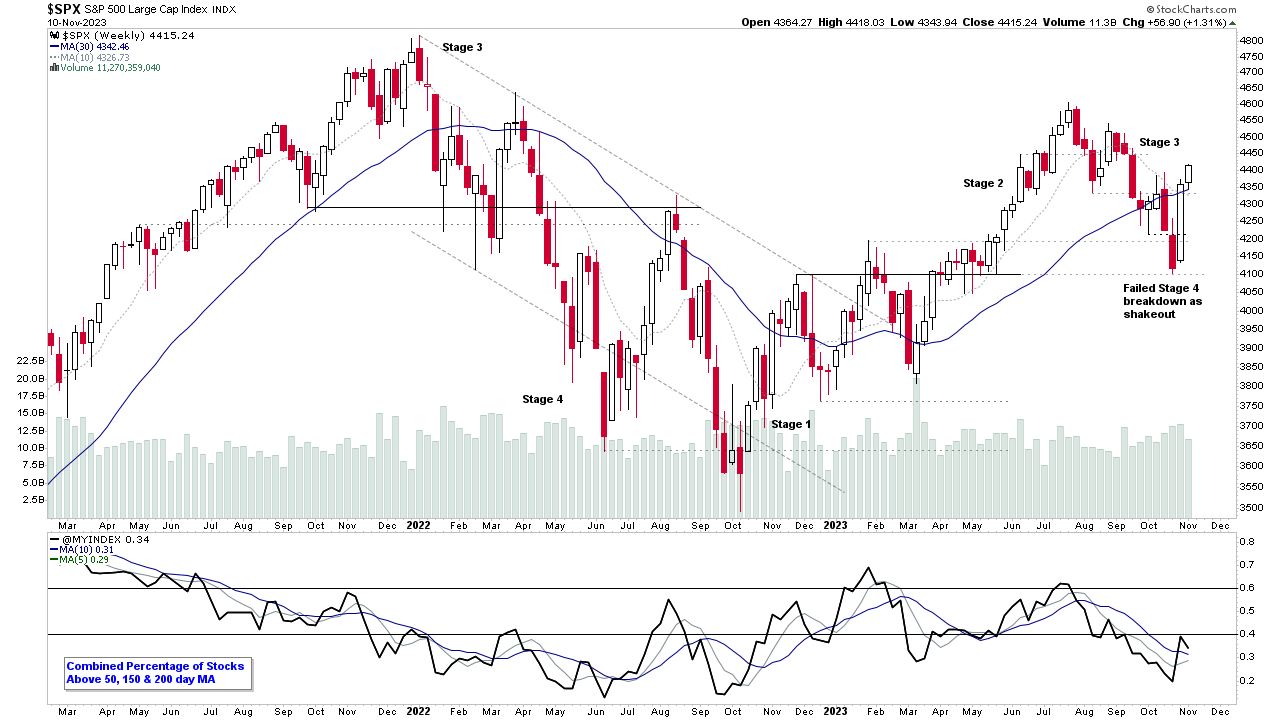
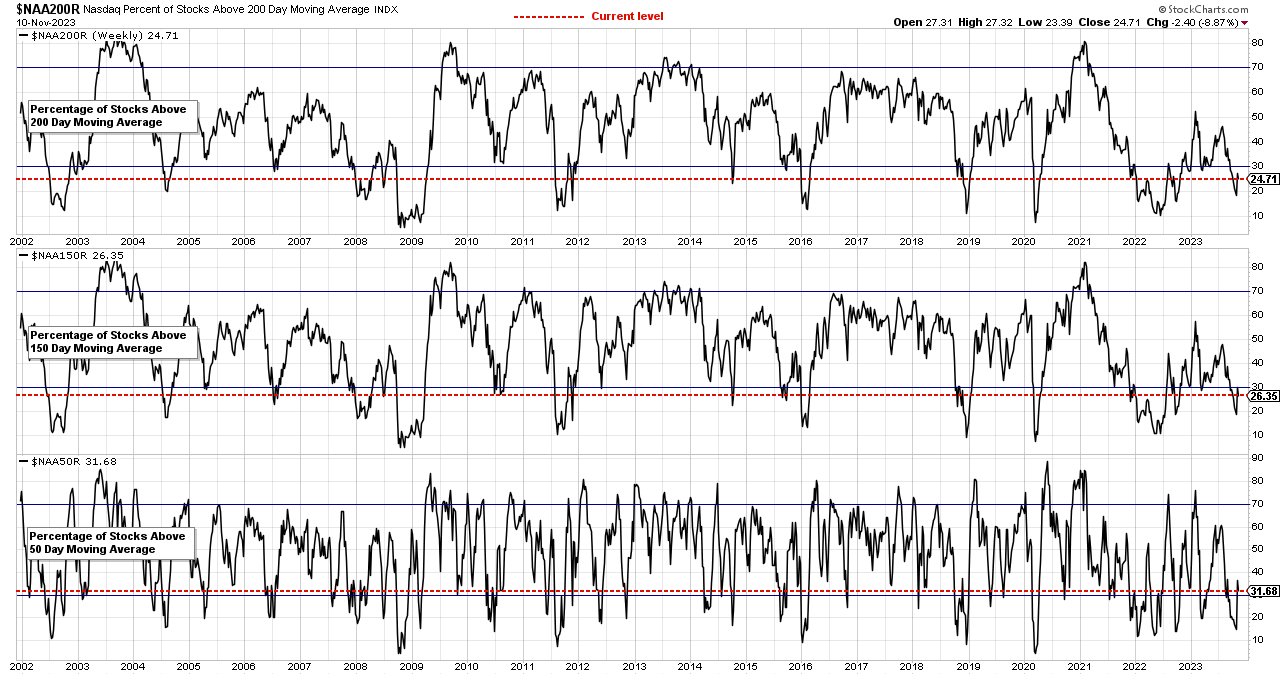
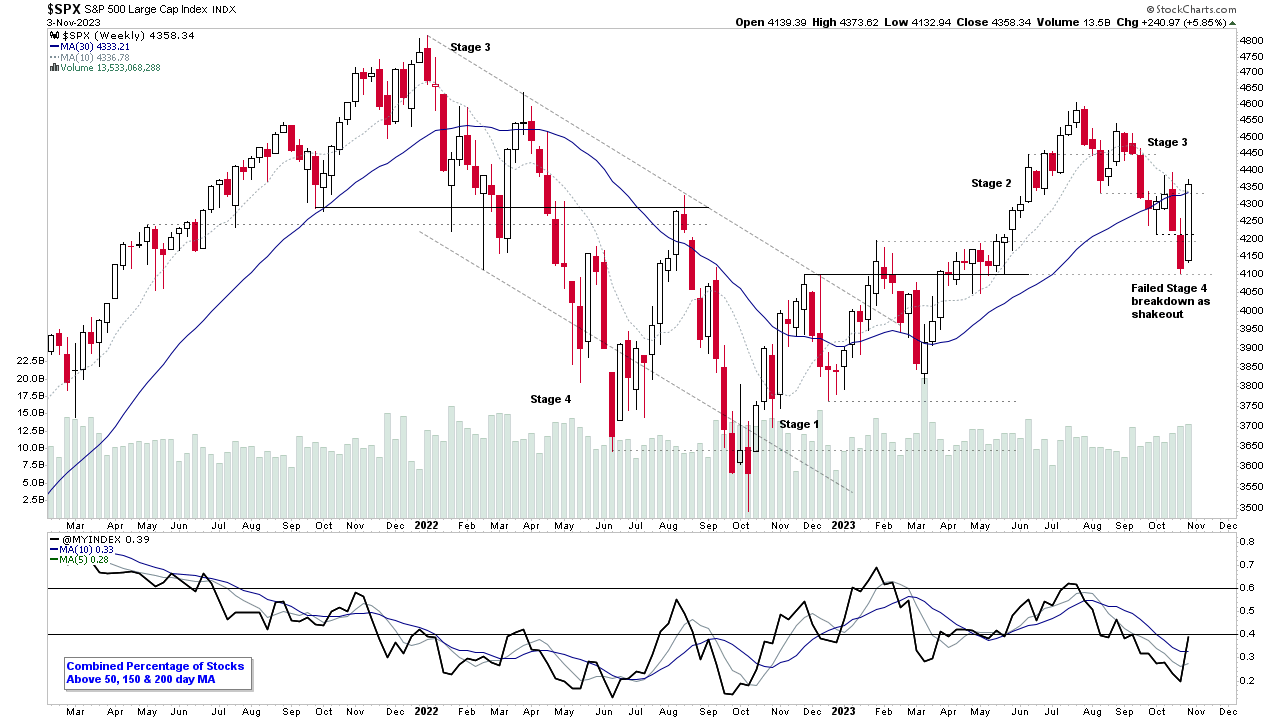
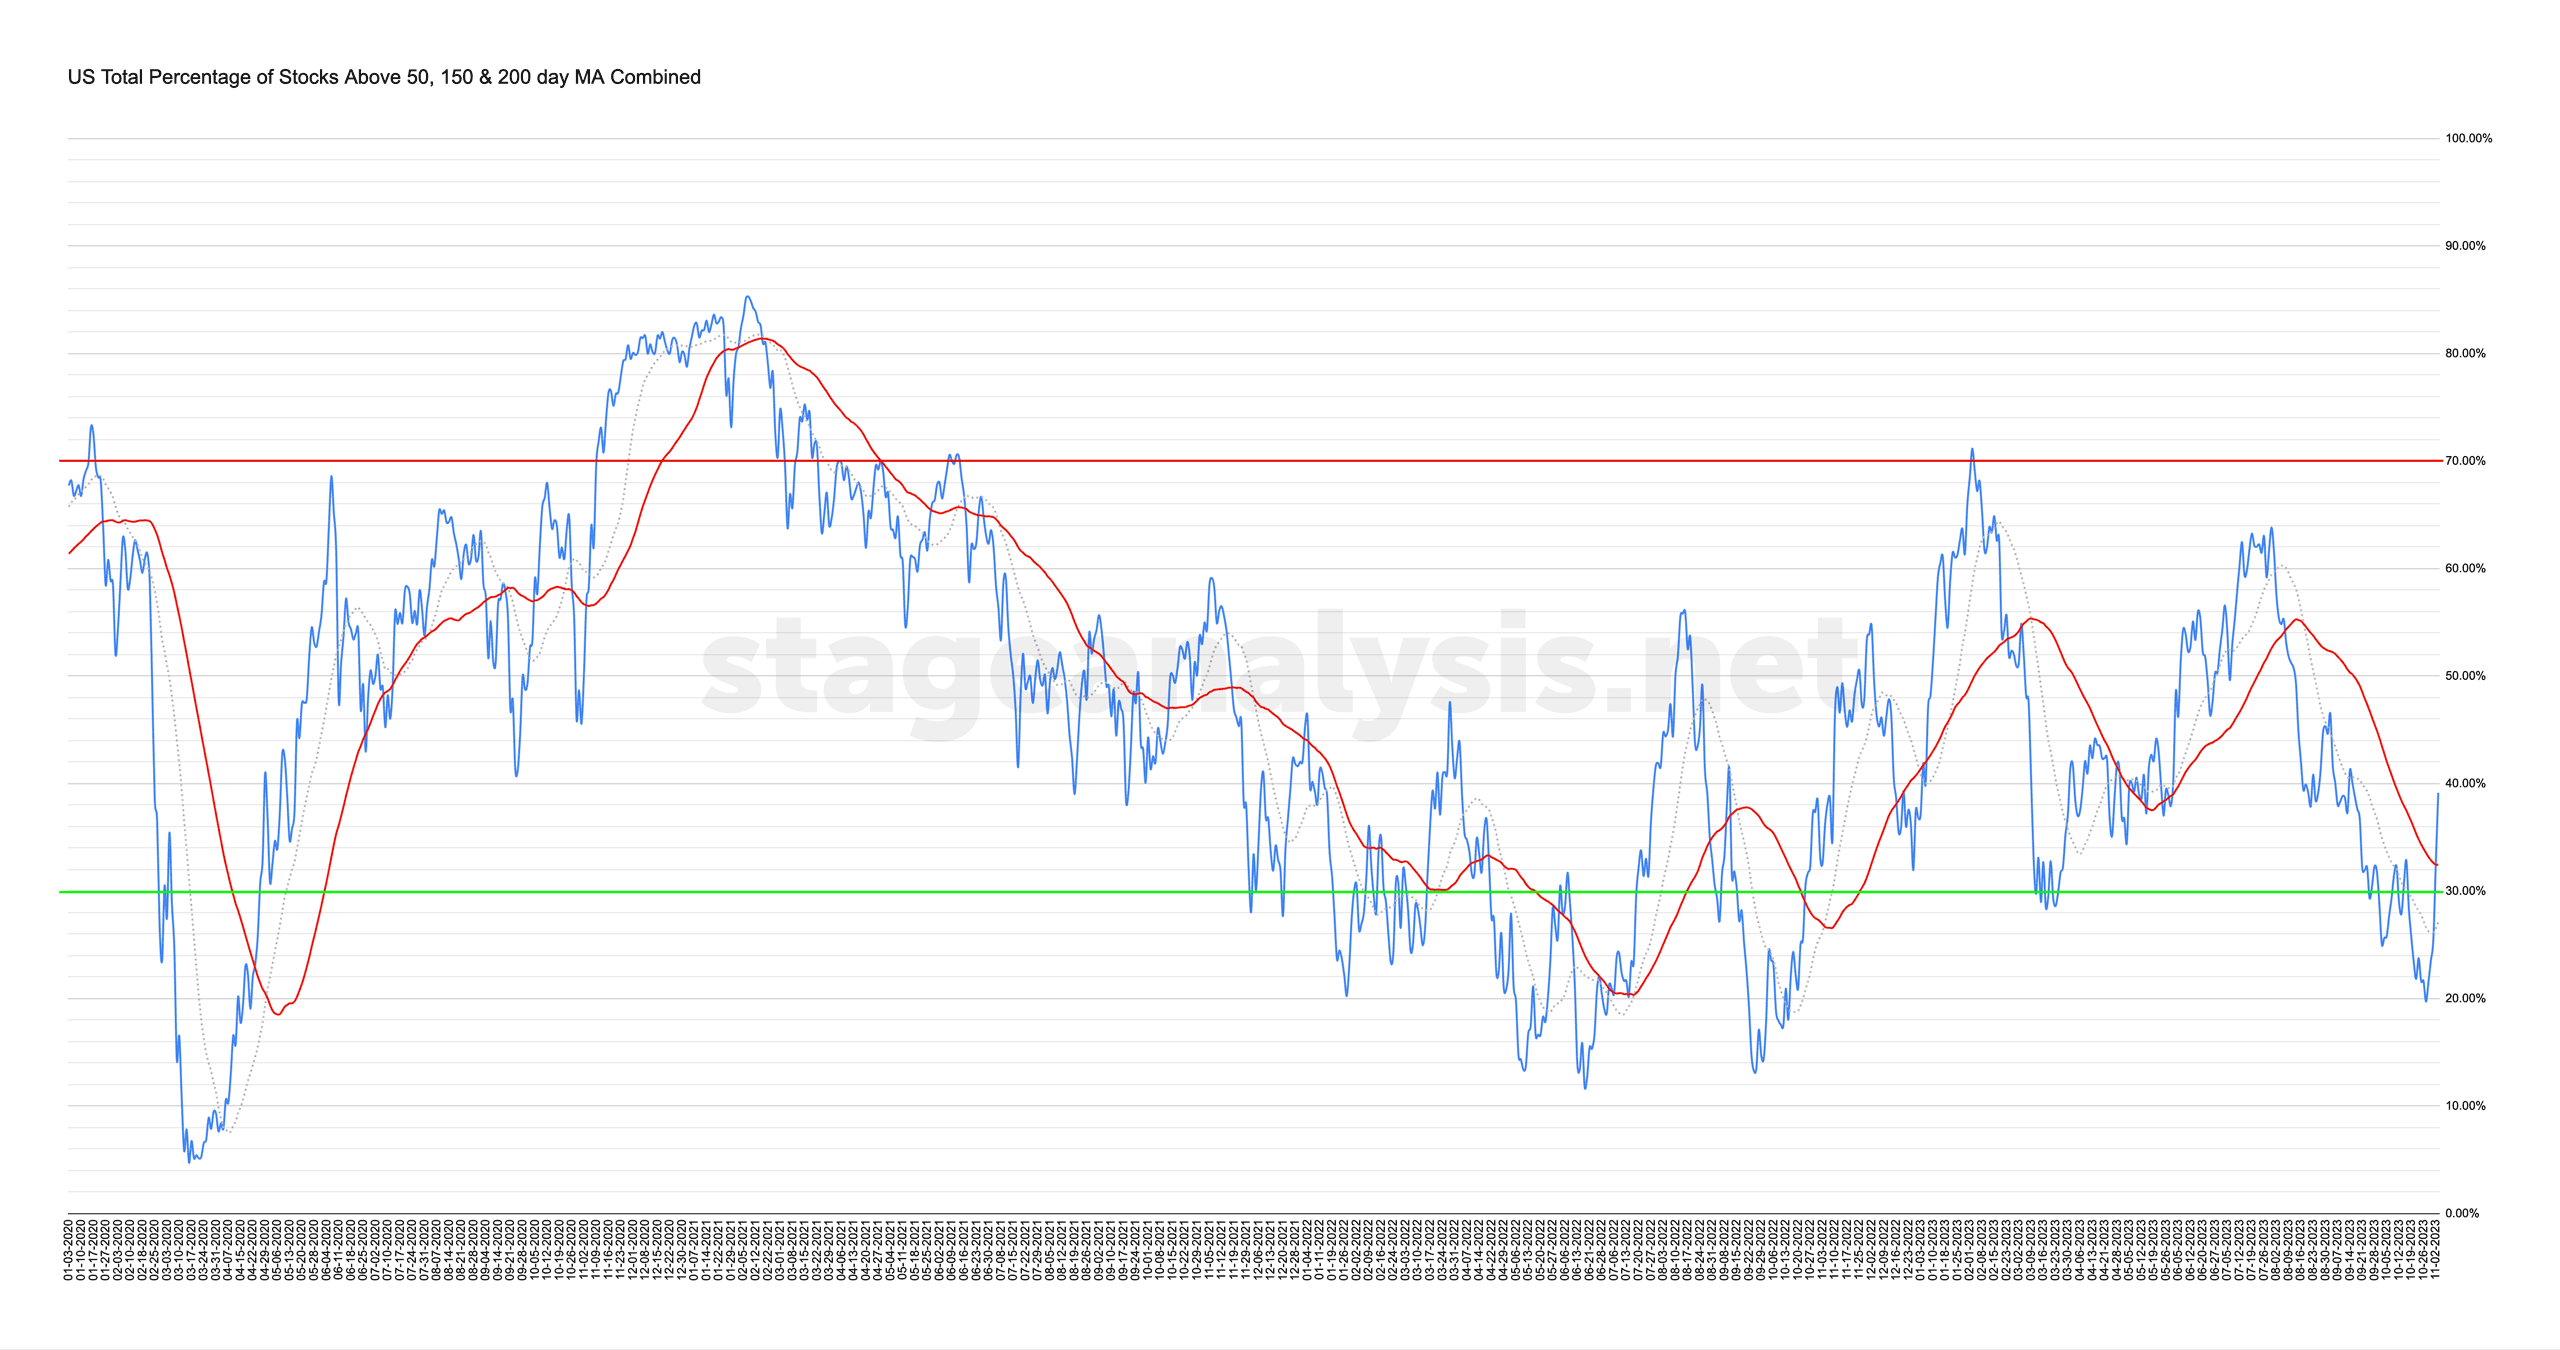
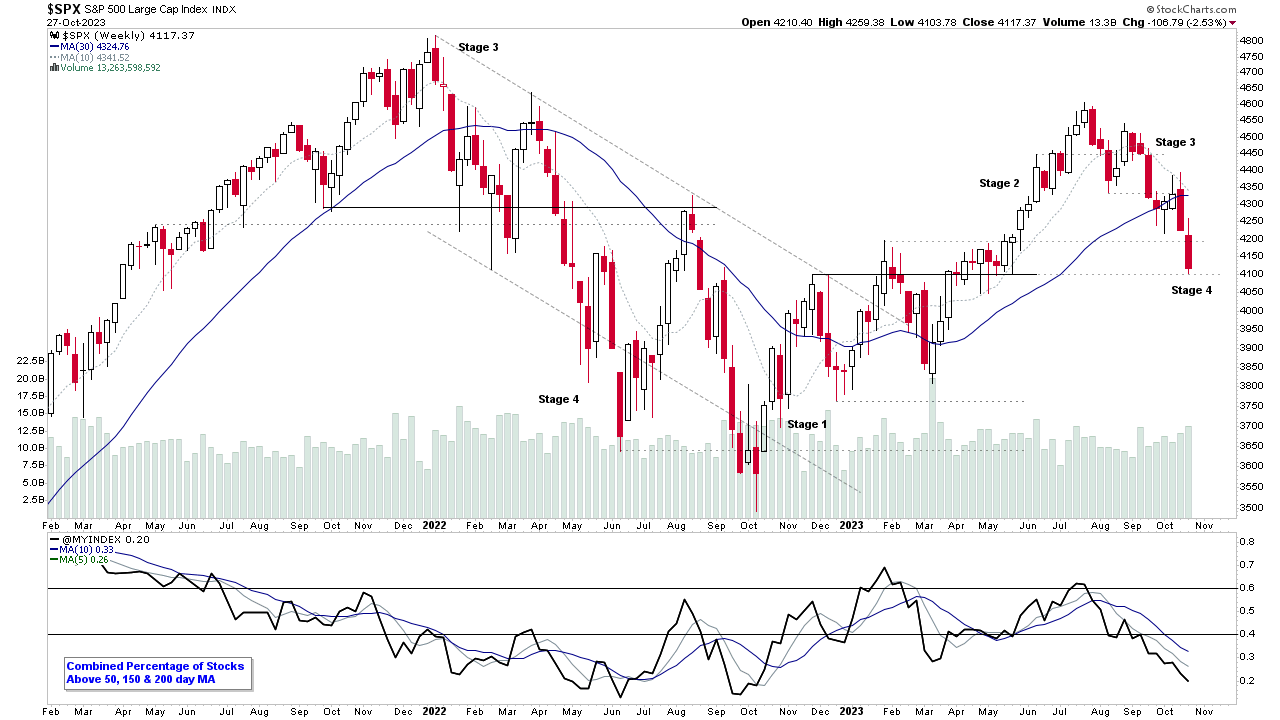
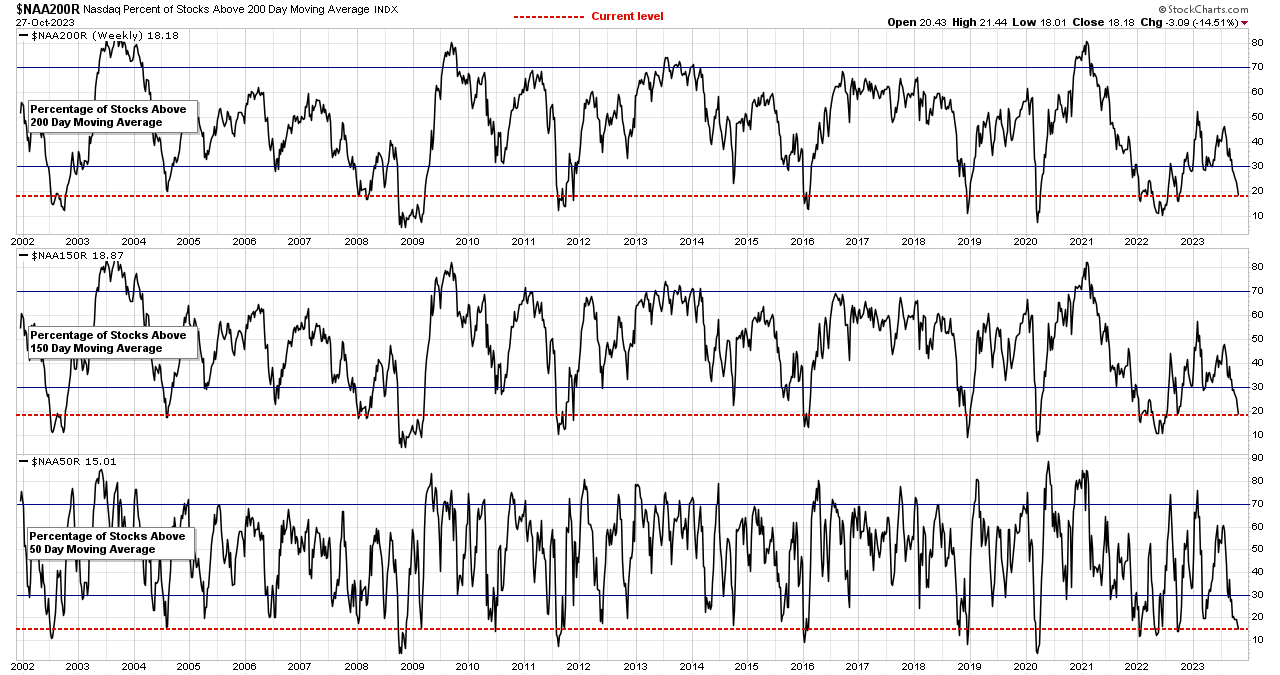
Market Breadth: Percentage of Stocks Above their 50 Day, 150 Day & 200 Day Moving Averages Combined
Custom Percentage of Stocks Above Their 50 Day, 150 Day & 200 Day Moving Averages Combined Market Breadth Charts for the Overall US Market, NYSE and Nasdaq for Market Timing and Strategy.
Read More
08 November, 2023
Stage Analysis Members Video – 8 November 2023 (56mins)
The Stage Analysis midweek video discussing of the major US stock market indexes, short-term market breadth measures, Bitcoin and Ethereum updated analysis, and the recent watchlist stocks on multiple timeframes.
Read More
06 November, 2023
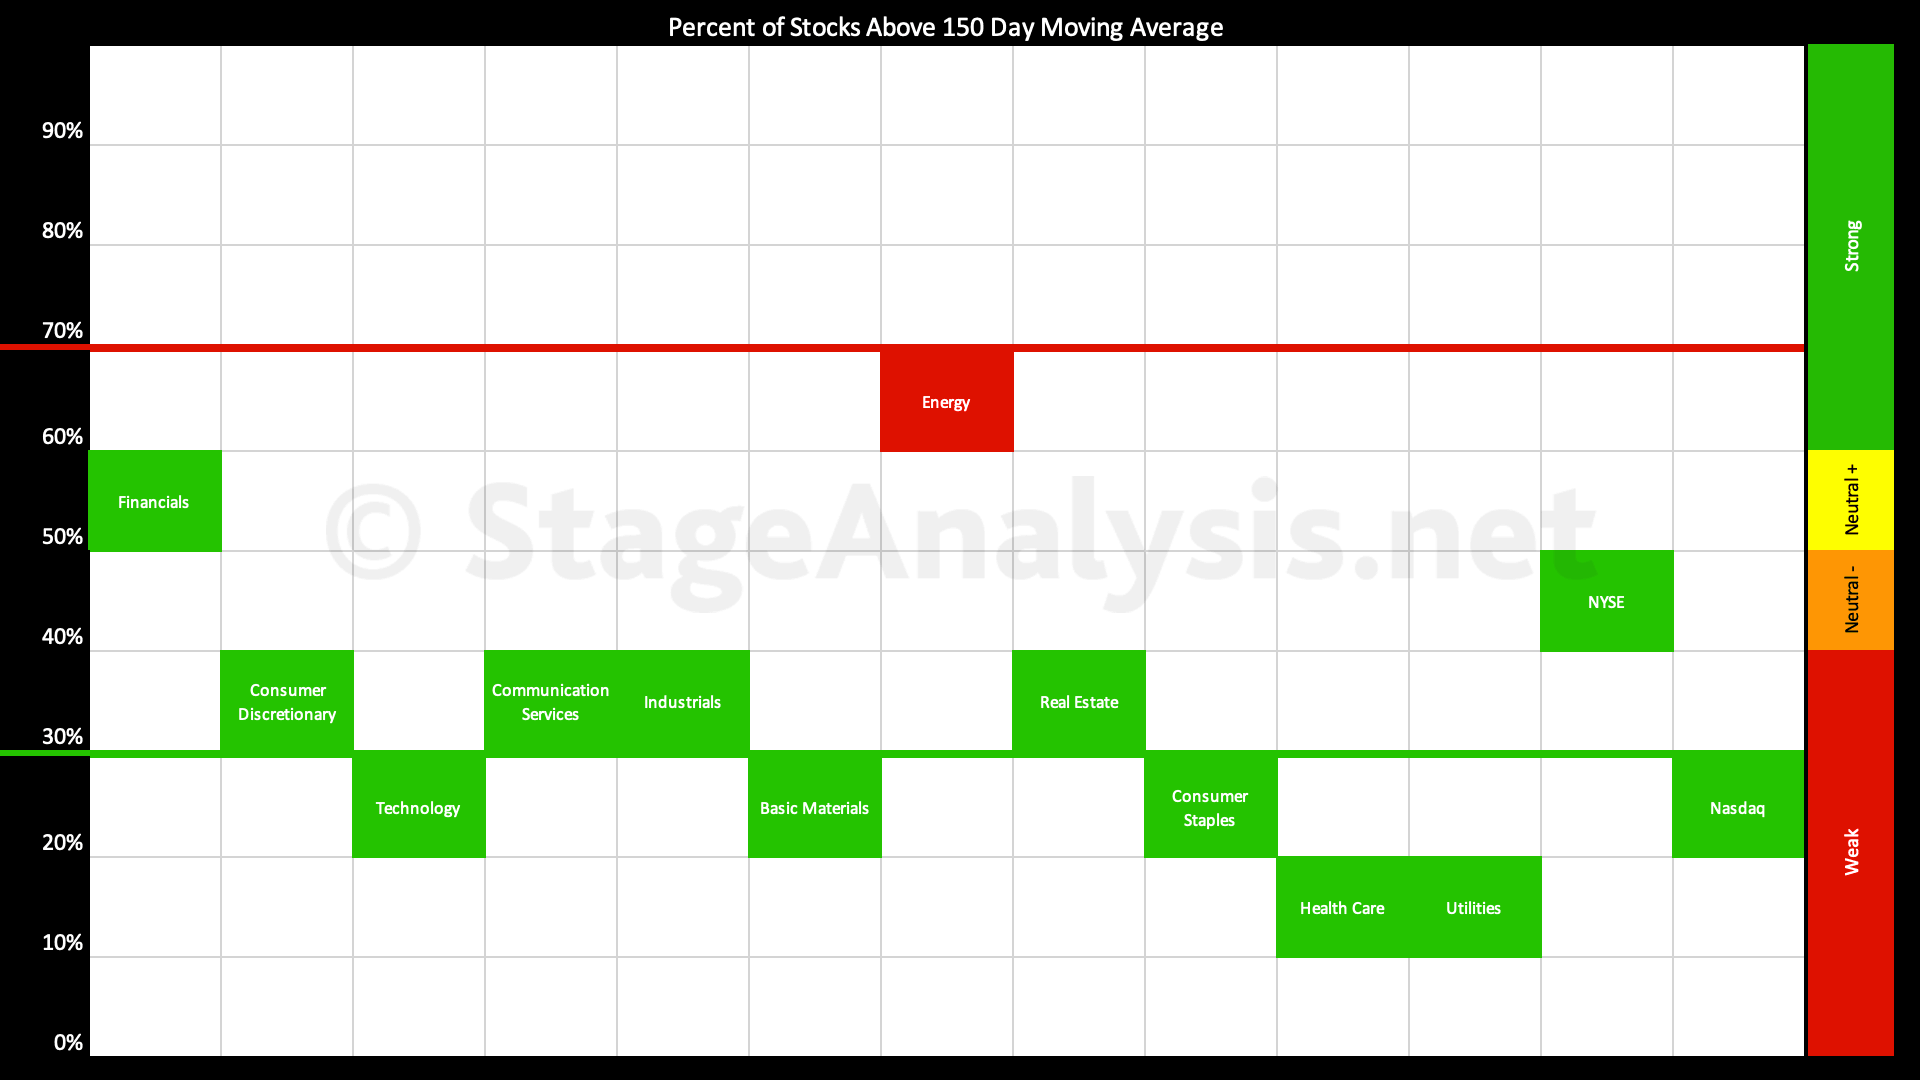
Sector Breadth: Percentage of US Stocks Above Their 150 day (30 Week) Moving Averages
The percentage of US stocks above their 150 day moving averages in the 11 major sectors increased by +10.13% since the previous post on the 23rd October 2023, with a strong rebound from the lower zone up through the key 30% level. Which is a positive change for this contrarian breadth indicator...
Read More
05 November, 2023
Stage Analysis Members Video – 5 November 2023 (1hr 33mins)
The Stage Analysis members weekend video begins with a look at some of the weeks significant bars in individual stocks, after a huge change of behaviour in the broad market. Followed by the regular weekend content of the Major US Indexes, the Futures Charts, Industry Groups Relative Strength (RS) Rankings, IBD Industry Group Bell Curve – Bullish Percent, and US watchlist stocks in detail on multiple timeframes.
Read More
04 November, 2023
Market Breadth: Percentage of Stocks Above their 50 Day, 150 Day & 200 Day Moving Averages Combined
Custom Percentage of Stocks Above Their 50 Day, 150 Day & 200 Day Moving Averages Combined Market Breadth Charts for the Overall US Market, NYSE and Nasdaq for Market Timing and Strategy.
Read More
01 November, 2023
Stage Analysis Members Video – 1 November 2023 (49mins)
Stage Analysis midweek video discussing of the major US stock market indexes, short-term market breadth measures and the recent watchlist stocks on multiple timeframes.
Read More
01 November, 2023
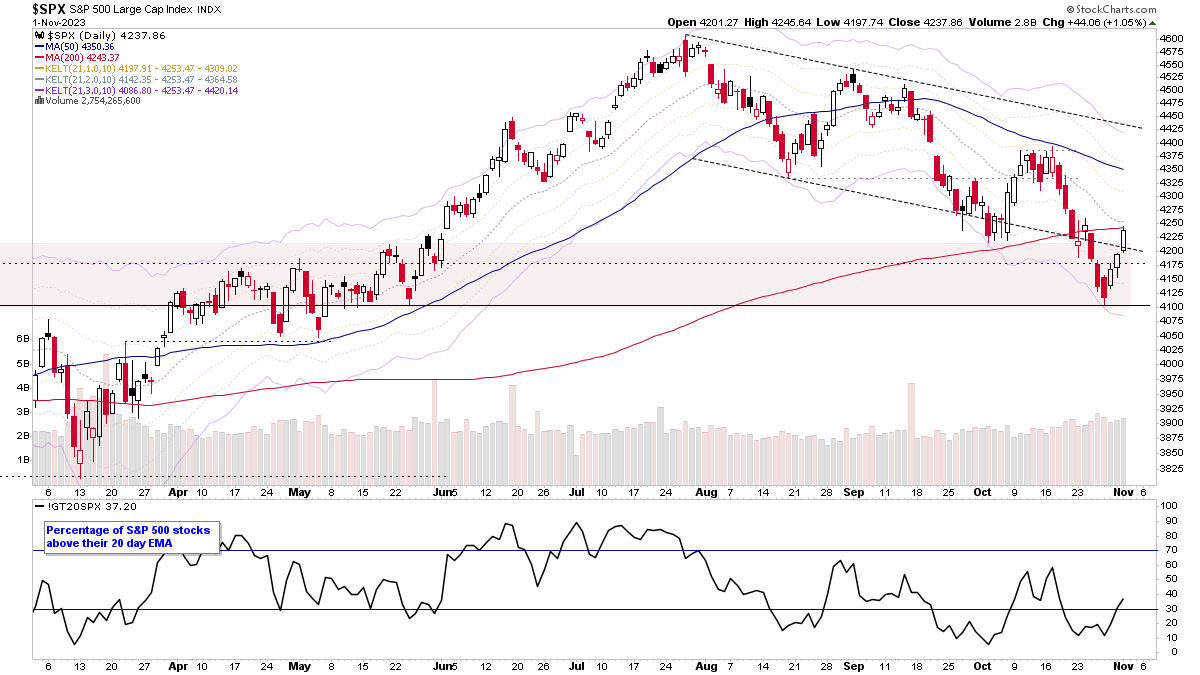
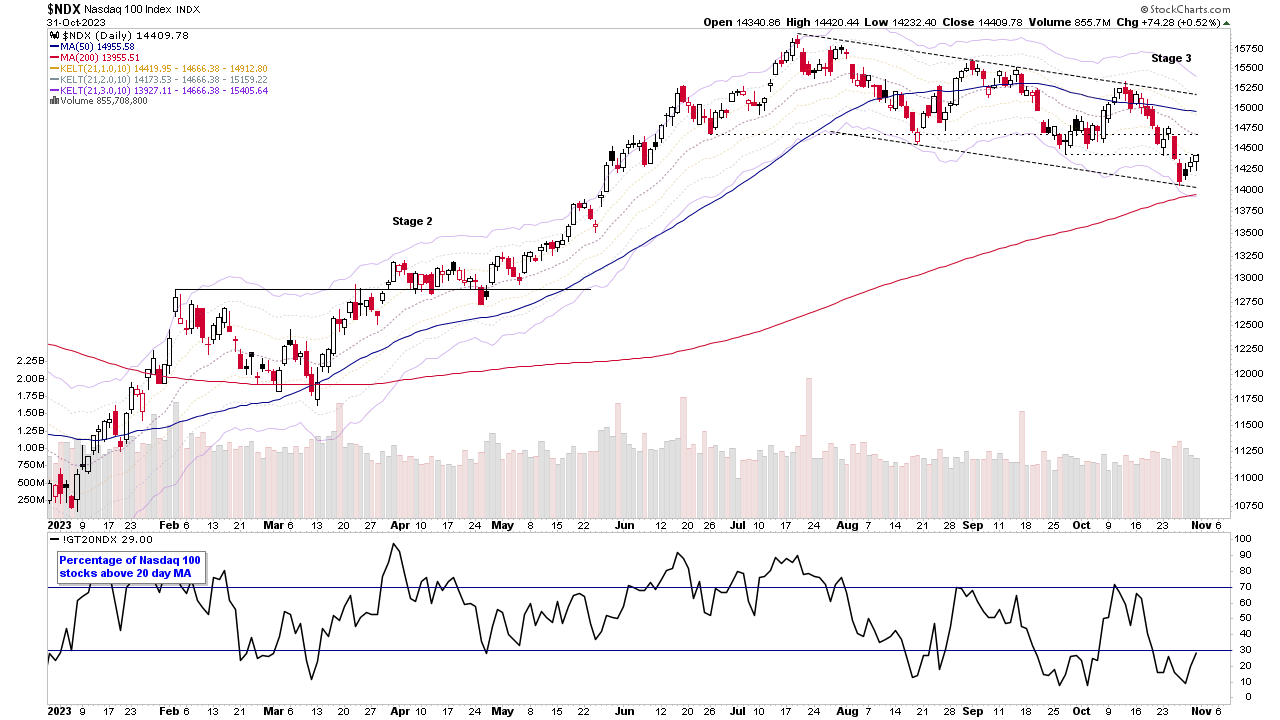
US Stocks Watchlist – 31 October 2023
The major indexes continued to gradually rebound from the most recent swing lows, with four days since low the Nasdaq 100 for example, which may turn out to be a bear flag, within the downtrend channel. However, the rebound attempt has caused some of the very short-term market breadth measures to turn back to positive
Read More
29 October, 2023
Stage Analysis Members Video – 29 October 2023 (1hr 3mins)
The Stage Analysis members weekend video begins this week with a detailed look at the market breadth data to help to determine the current weight of evidence, as it's a crucial spect of the Stage Analysis method. Followed by the regular weekend members content including the Major US Indexes, the Futures Charts, Industry Groups Relative Strength (RS) Rankings, IBD Industry Group Bell Curve – Bullish Percent, and US watchlist stocks in detail on multiple timeframes. Plus an update on Bitcoin and Ethereum.
Read More
28 October, 2023
Market Breadth: Percentage of Stocks Above their 50 Day, 150 Day & 200 Day Moving Averages Combined
Custom Percentage of Stocks Above Their 50 Day, 150 Day & 200 Day Moving Averages Combined Market Breadth Charts for the Overall US Market, NYSE and Nasdaq for Market Timing and Strategy.
Read More