There were 24 stocks highlighted from the US stocks watchlist scans today...
Read More

Blog
11 January, 2024
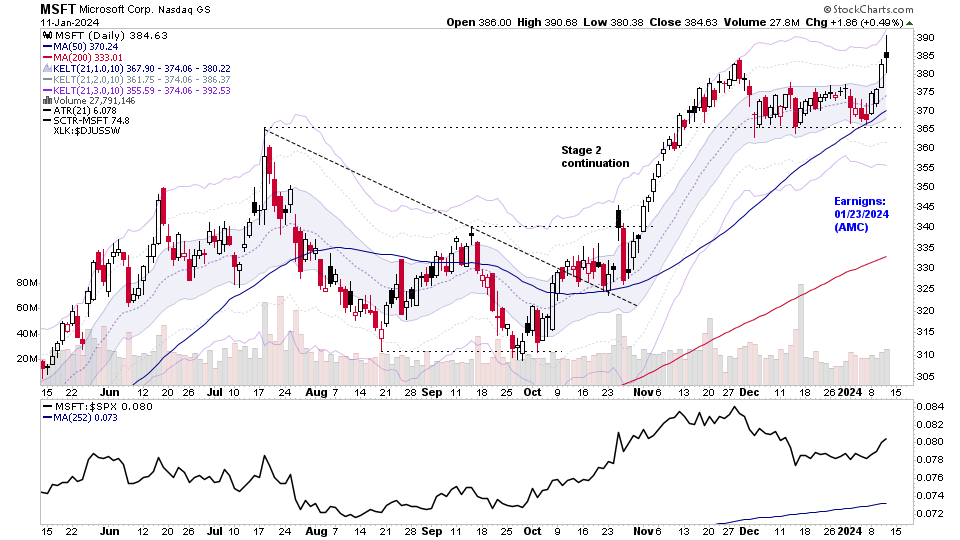
US Stocks Watchlist – 11 January 2024
10 January, 2024
Stage Analysis Members Video – 10 January 2024 (49mins)
Stage Analysis midweek video discussing of the major US stock market indexes, short-term market breadth measures, plus a look at Bitcoin and some of the major Altcoins now that the spot Bitcoin ETFs have been approved, and finishing with discussion of the most recent watchlist stocks on multiple timeframes.
Read More
08 January, 2024
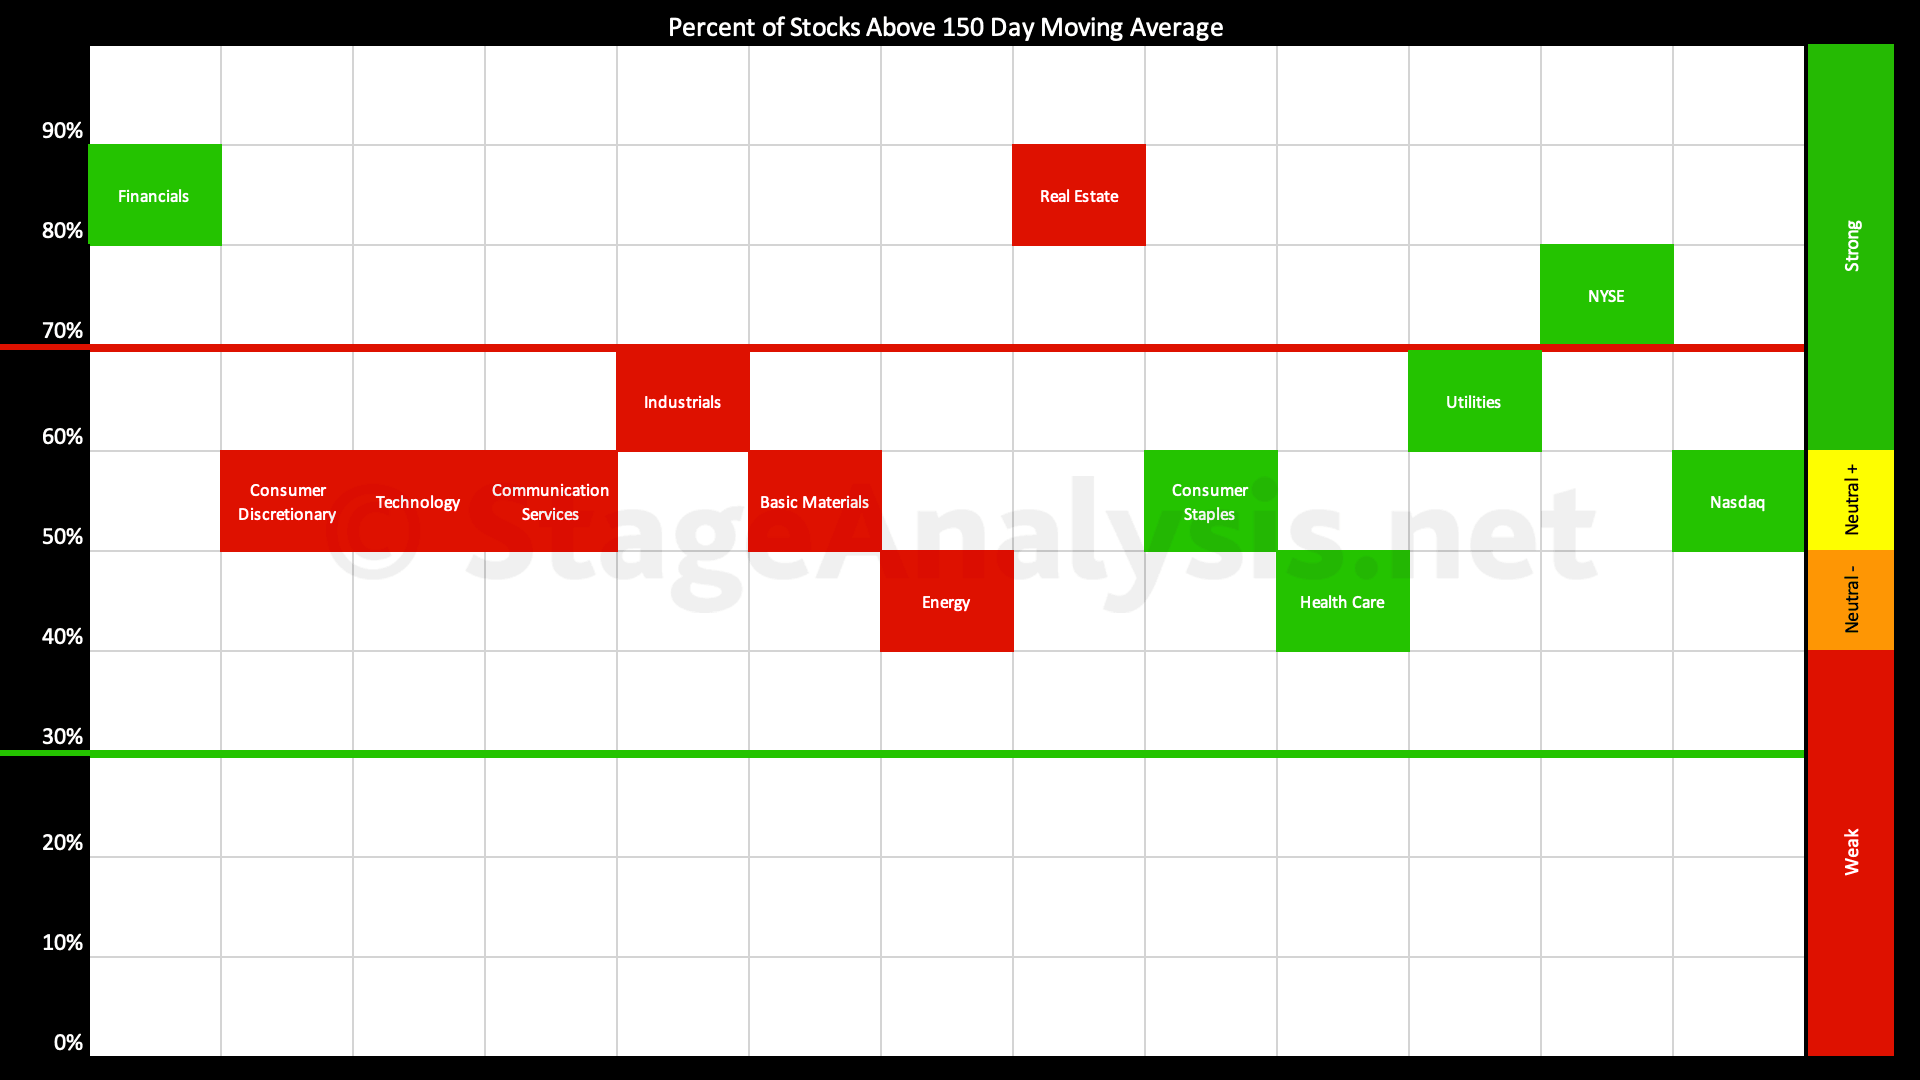
Sector Breadth: Percentage of US Stocks Above Their 150 day (30 Week) Moving Averages
The percentage of US stocks above their 150 day moving averages in the 11 major sectors increased by +2.89% since the previous post on the 18th December 2023, moving the overall average up to 60.03%, which is lower end of strong zone (60%+).
Read More
07 January, 2024
Stage Analysis Members Video – 7 January 2024 (1hr)
Stage Analysis members video discussing the Major US Stock Market Indexes, Futures charts, Industry Groups Relative Strength (RS) Rankings, IBD Industry Group Bell Curve – Bullish Percent, the key Market Breadth Charts to determine the Weight of Evidence, Significant Weekly Bars and the most recent US watchlist stocks in detail on multiple timeframes.
Read More
06 January, 2024
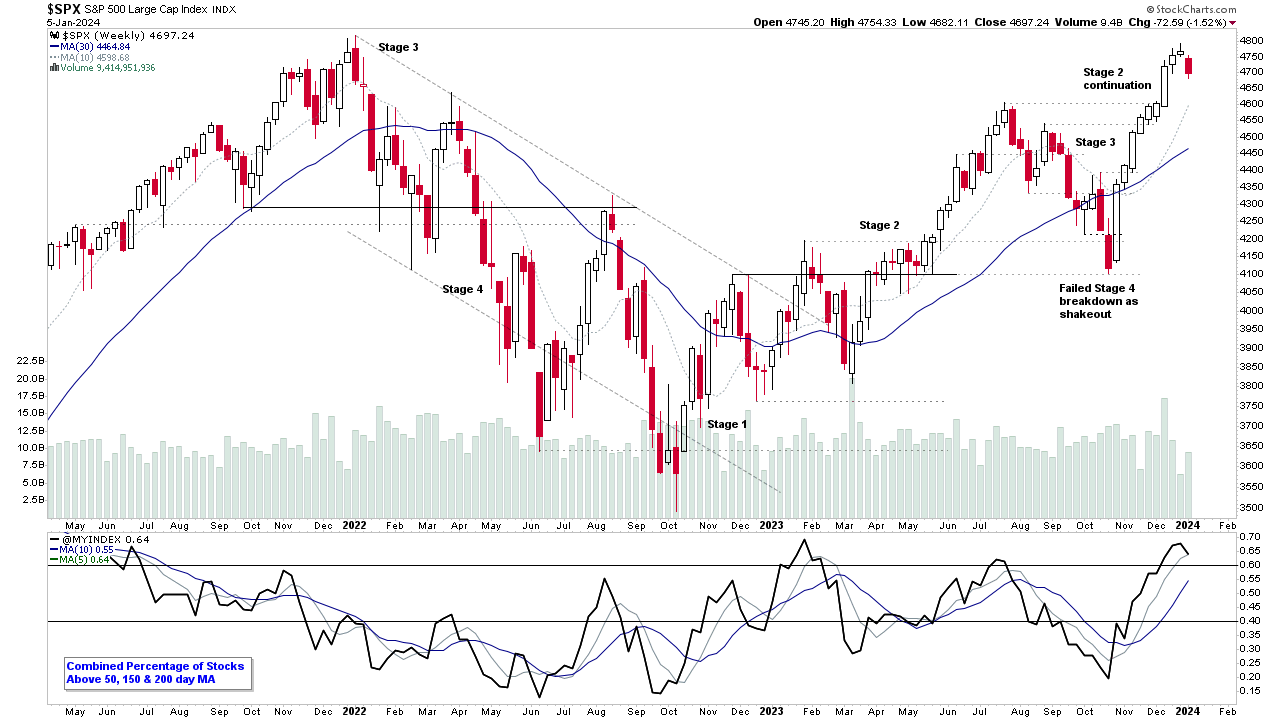
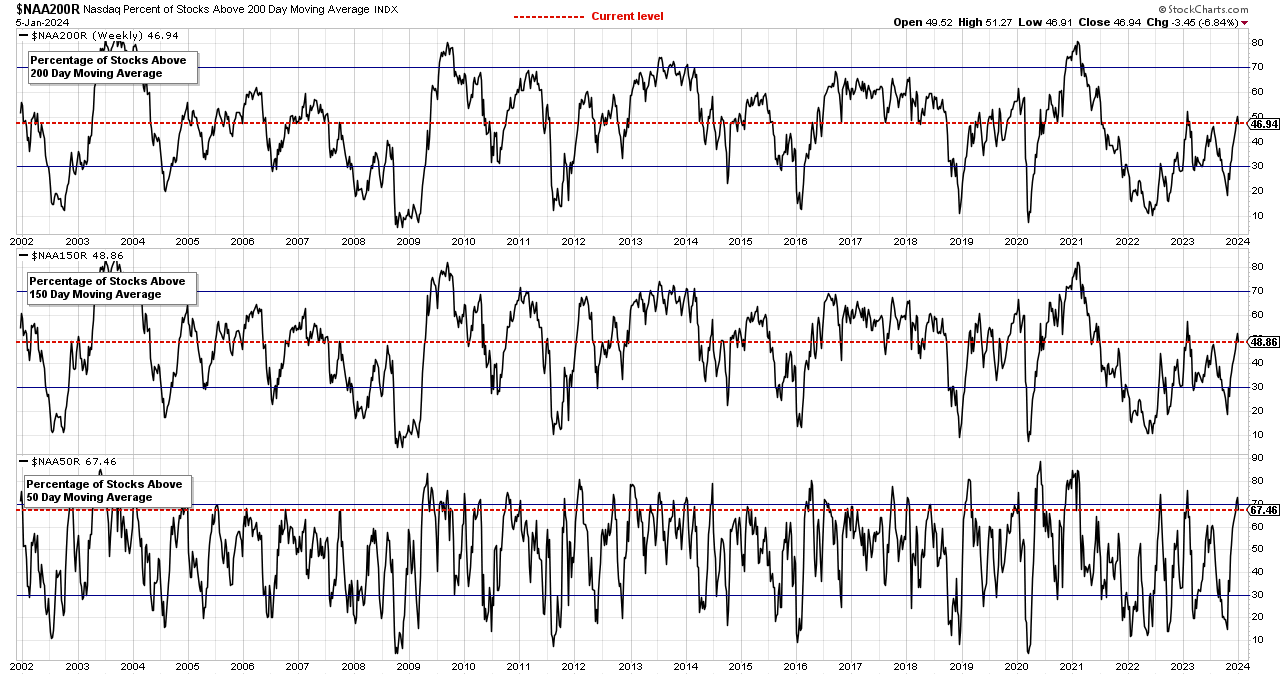
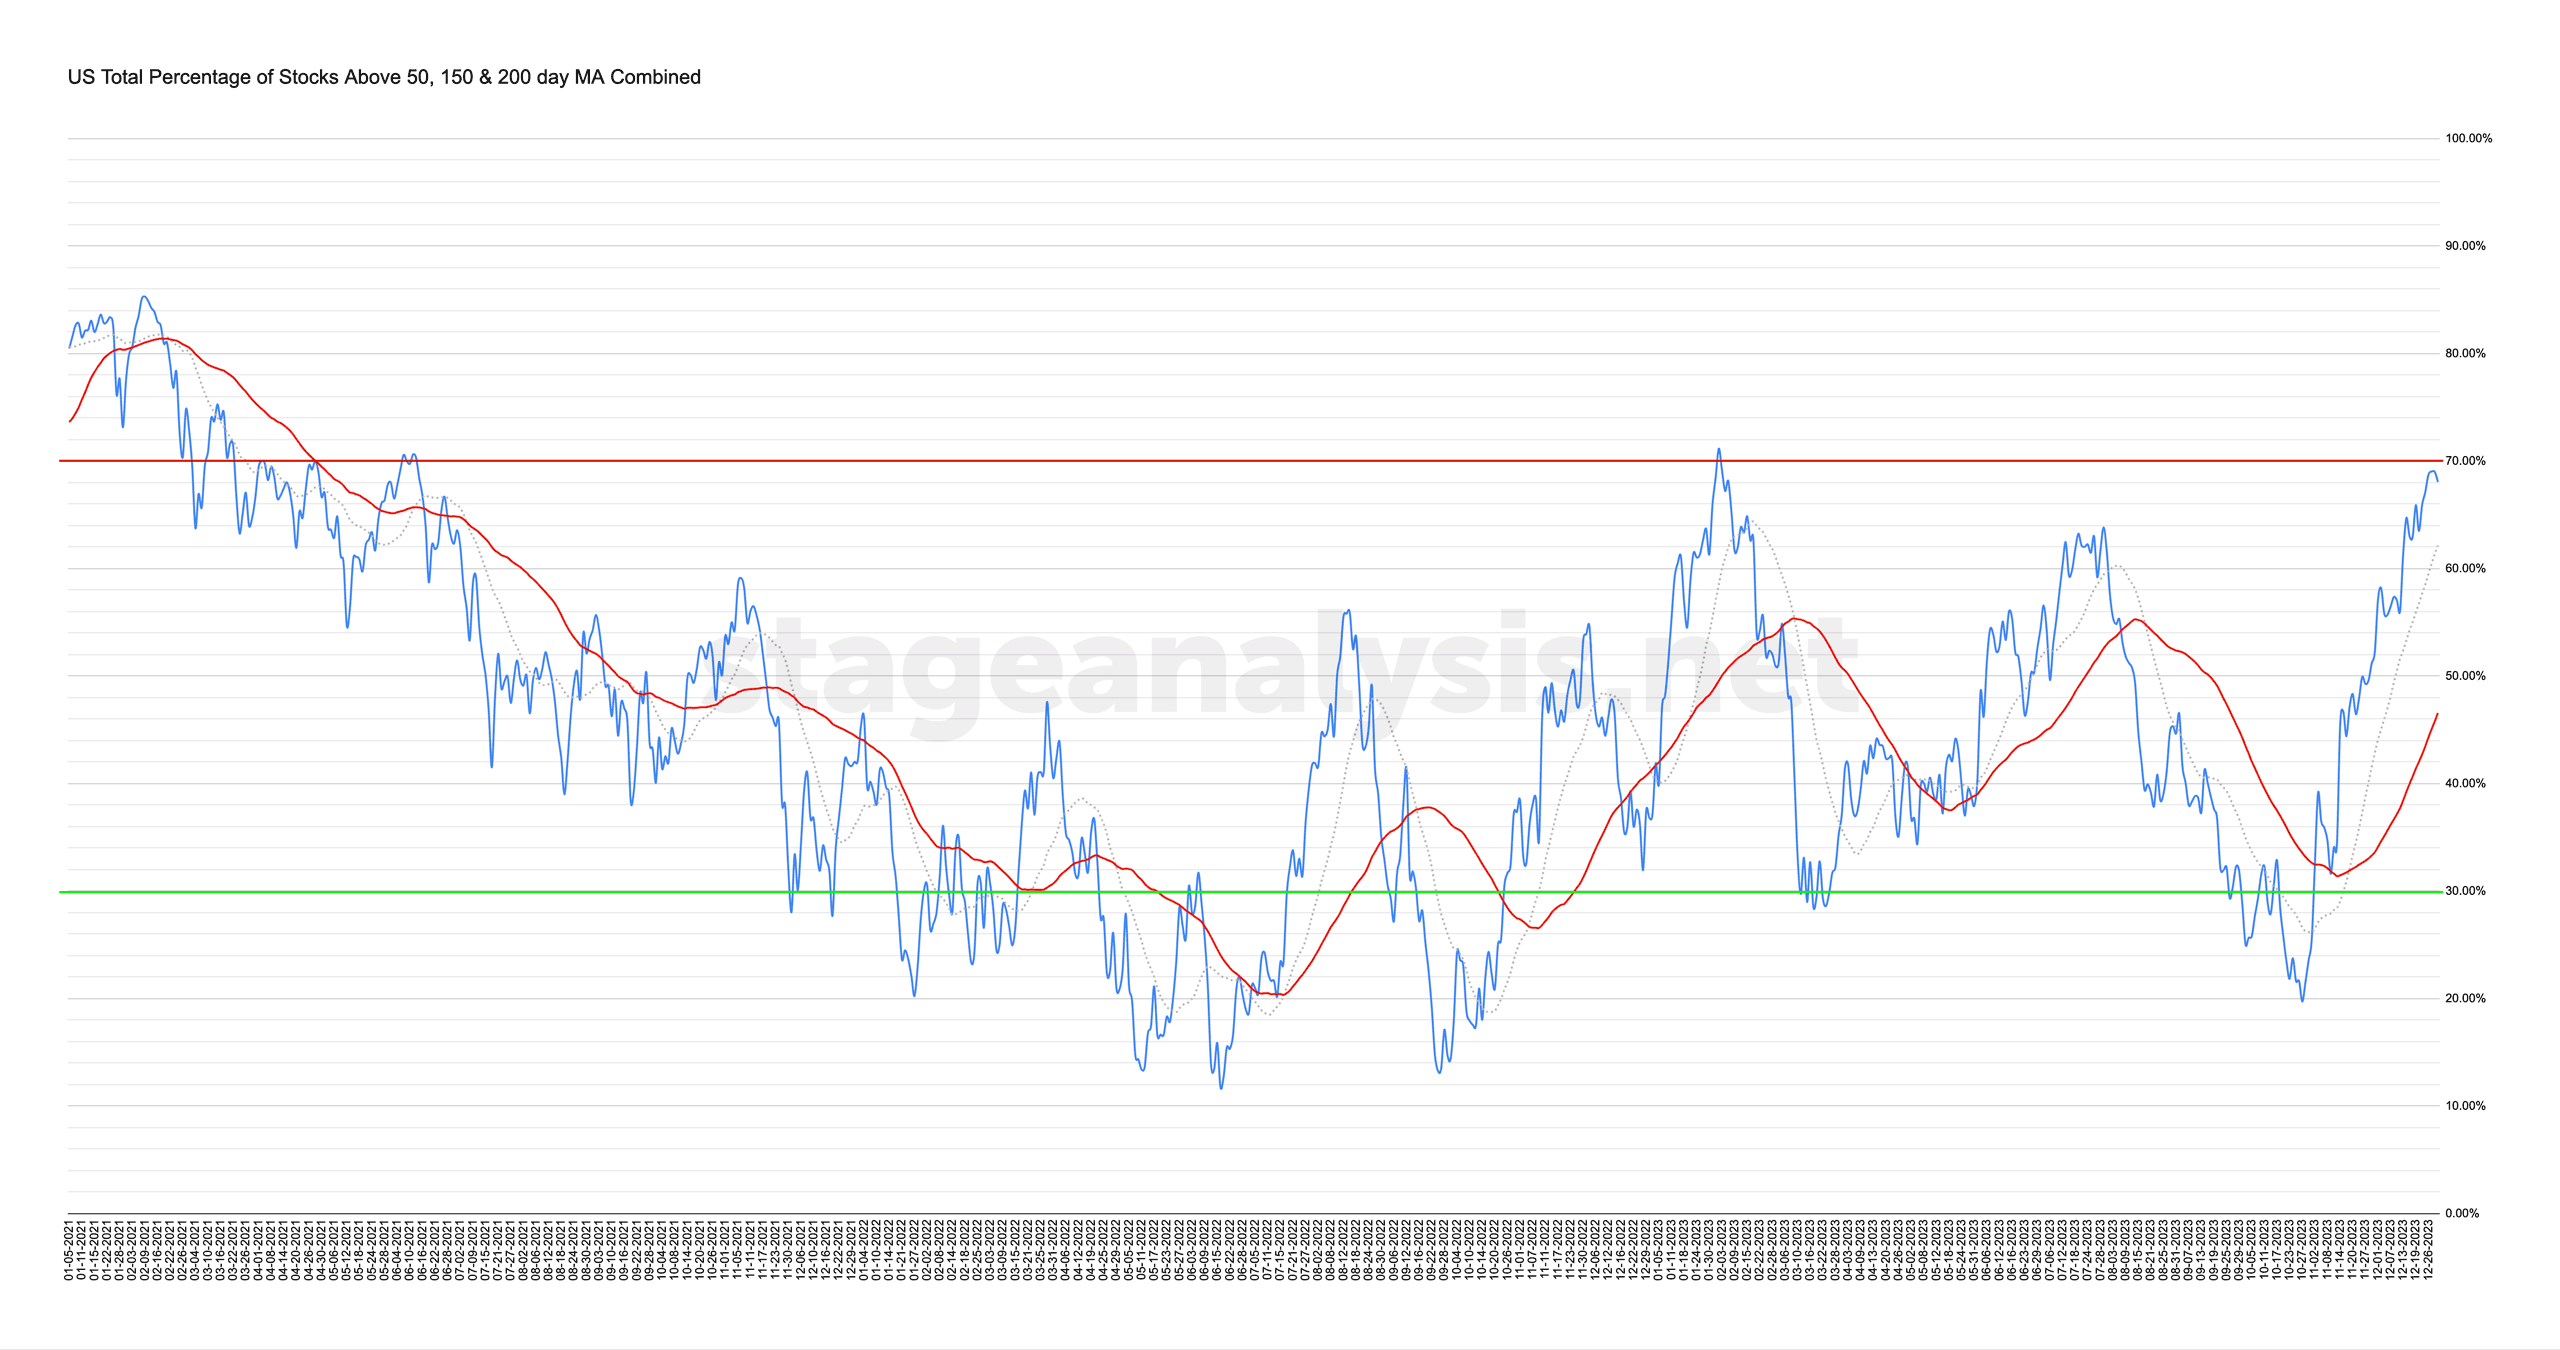
Market Breadth: Percentage of Stocks Above their 50 Day, 150 Day & 200 Day Moving Averages Combined
Custom Percentage of Stocks Above Their 50 Day, 150 Day & 200 Day Moving Averages Combined Market Breadth Charts for the Overall US Market, NYSE and Nasdaq for Market Timing and Strategy.
Read More
04 January, 2024
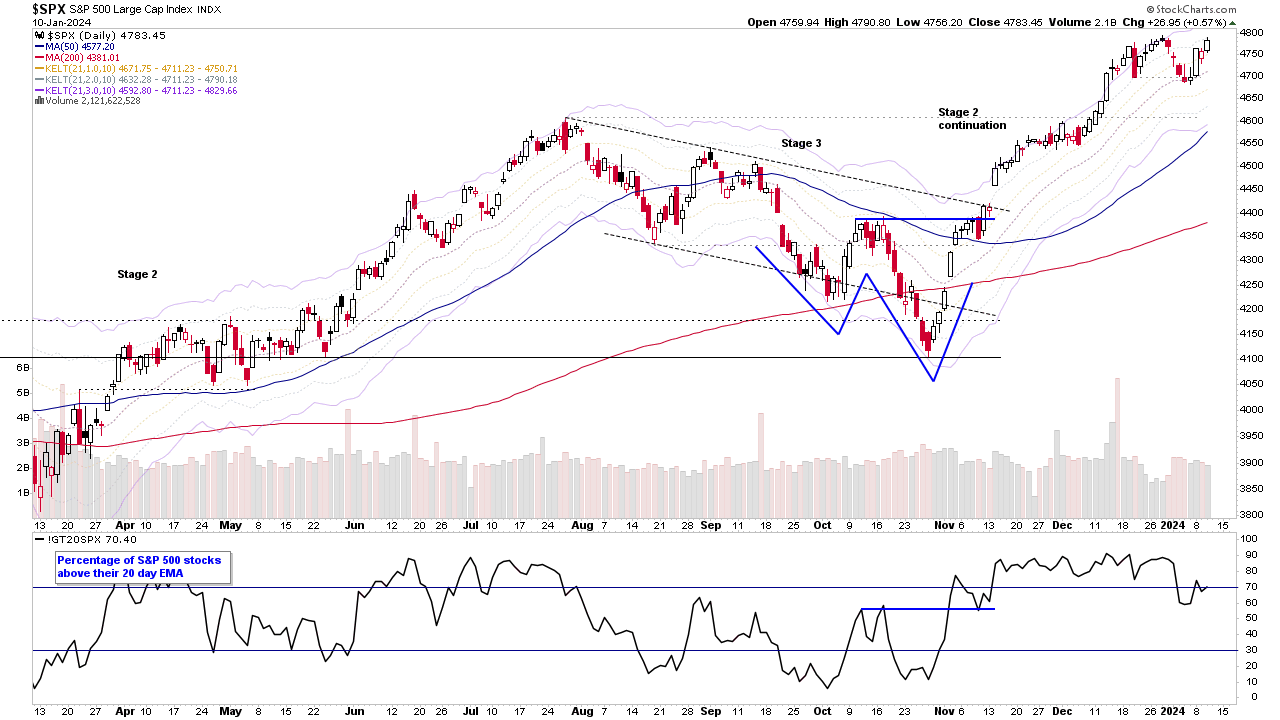
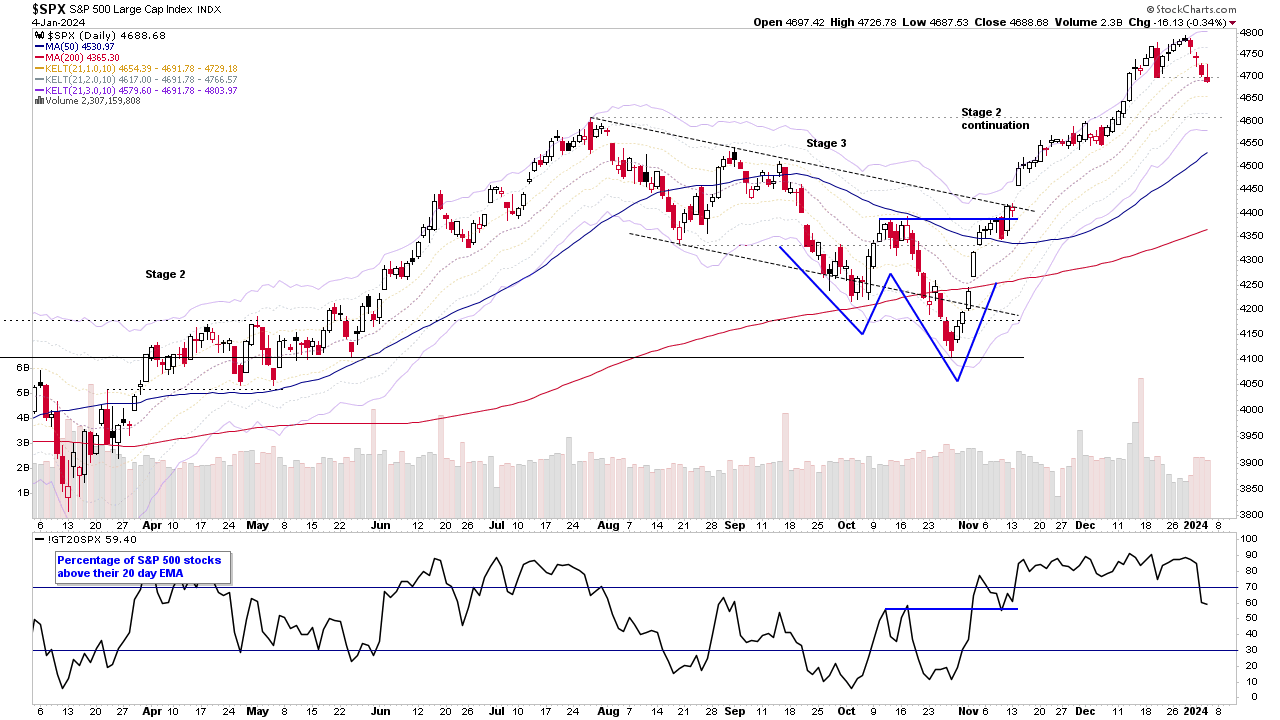
Pullback Continues in the S&P 500 and the US Stocks Watchlist – 4 January 2024
The S&P 500 has continued to pullback since the start of the year, and is currently -2.21% below the high set on the 28th December, and today closed below its 21 day EMA for the first time since the beginning of November. So it's a Change of Behaviour compared to the prior pullbacks since the October low...
Read More
01 January, 2024
Stage Analysis Members Video – 1 January 2024 (1hr)
Stage Analysis members video discussing the Major US Stock Market Indexes, Futures charts, Industry Groups Relative Strength (RS) Rankings, IBD Industry Group Bell Curve – Bullish Percent, the key Market Breadth Charts to determine the Weight of Evidence, Bitcoin and Ethereum Stages and the most recent US watchlist stocks in detail on multiple timeframes.
Read More
29 December, 2023
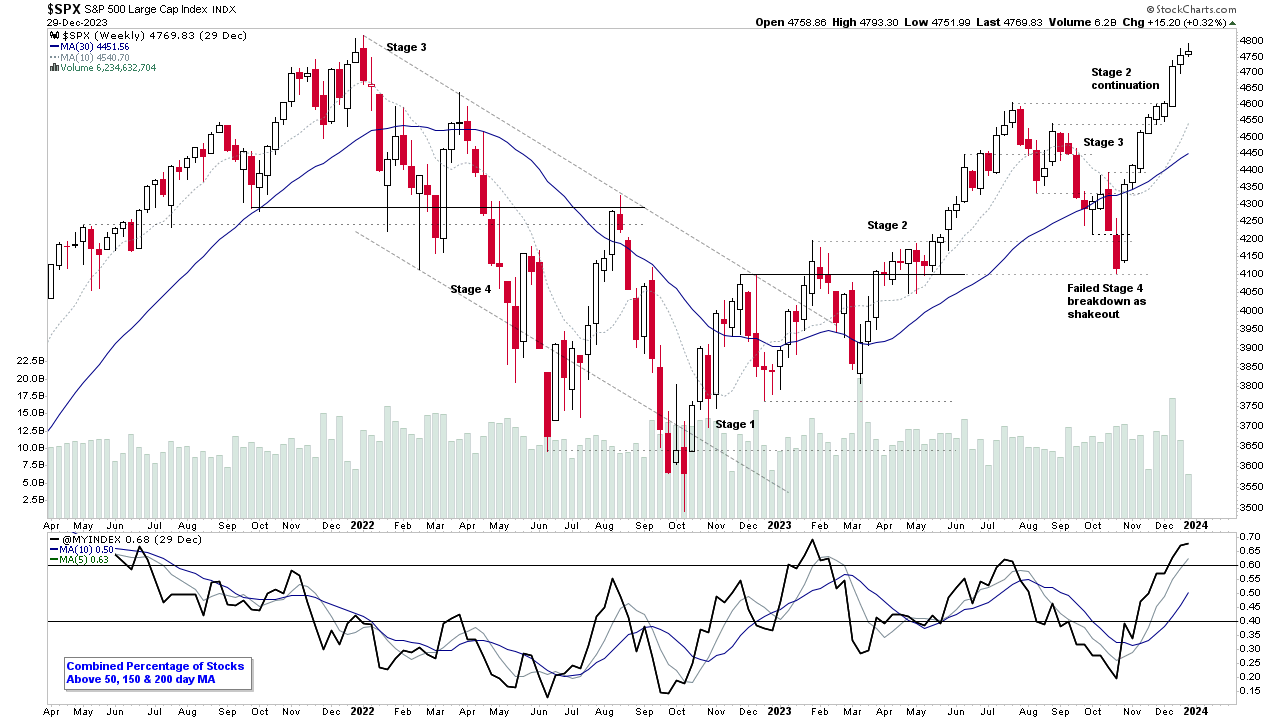
Market Breadth: Percentage of Stocks Above their 50 Day, 150 Day & 200 Day Moving Averages Combined
Custom Percentage of Stocks Above Their 50 Day, 150 Day & 200 Day Moving Averages Combined Market Breadth Charts for the Overall US Market, NYSE and Nasdaq for Market Timing and Strategy.
Read More

22 December, 2023
Market Breadth: Percentage of Stocks Above their 50 Day, 150 Day & 200 Day Moving Averages Combined
Custom Percentage of Stocks Above Their 50 Day, 150 Day & 200 Day Moving Averages Combined Market Breadth Charts for the Overall US Market, NYSE and Nasdaq for Market Timing and Strategy.
Read More
21 December, 2023
US Stocks Watchlist – 21 December 2023
There were 24 stocks highlighted from the US stocks watchlist scans today...
Read More