Stage Analysis members video discussing the Major US Stock Market Indexes, the Futures charts, Industry Groups Relative Strength (RS) Rankings, IBD Industry Group Bell Curve – Bullish Percent, the key Market Breadth Charts to determine the Weight of Evidence, Significant Weekly Bars and the most recent US watchlist stocks in detail on multiple timeframes.
Read More

Blog
28 January, 2024
Stage Analysis Members Video – 28 January 2024 (1hr 15mins)
27 January, 2024
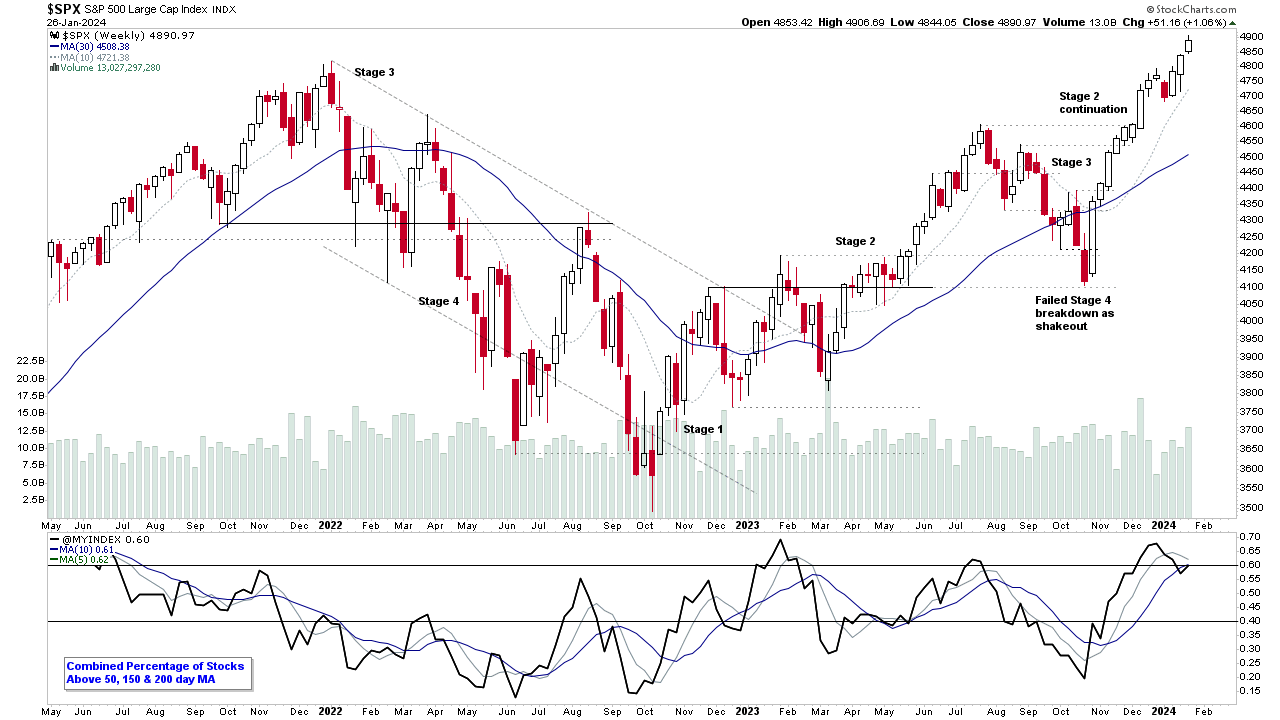
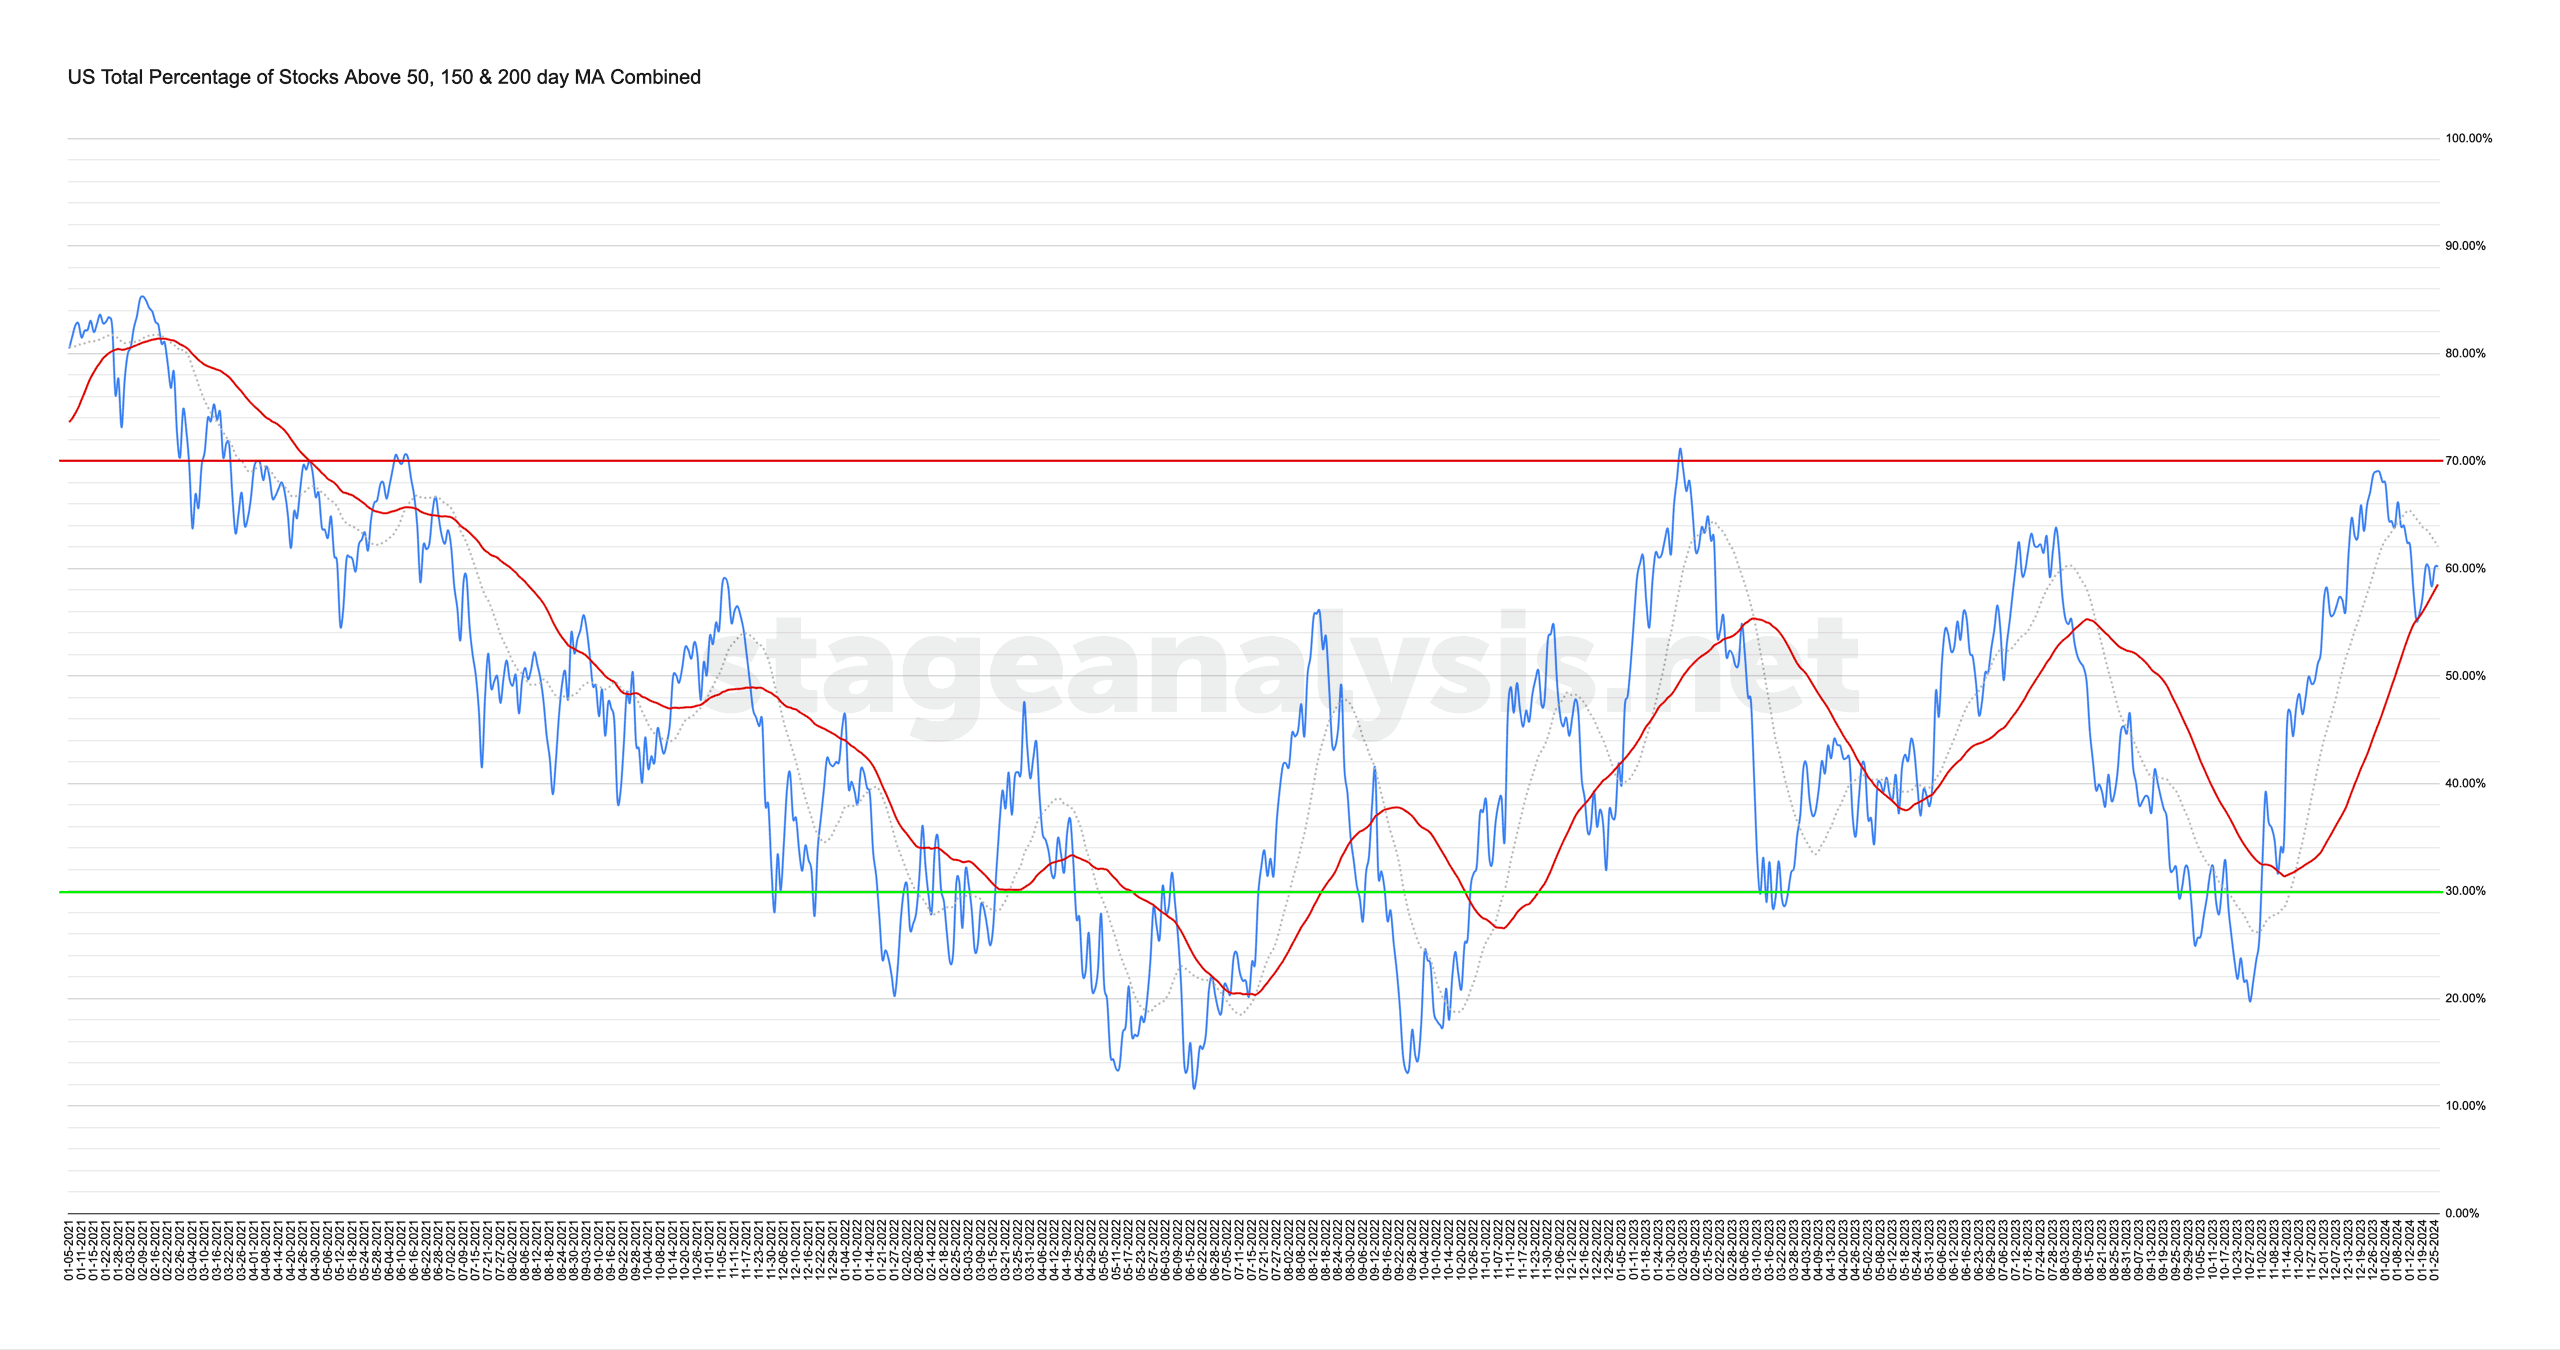
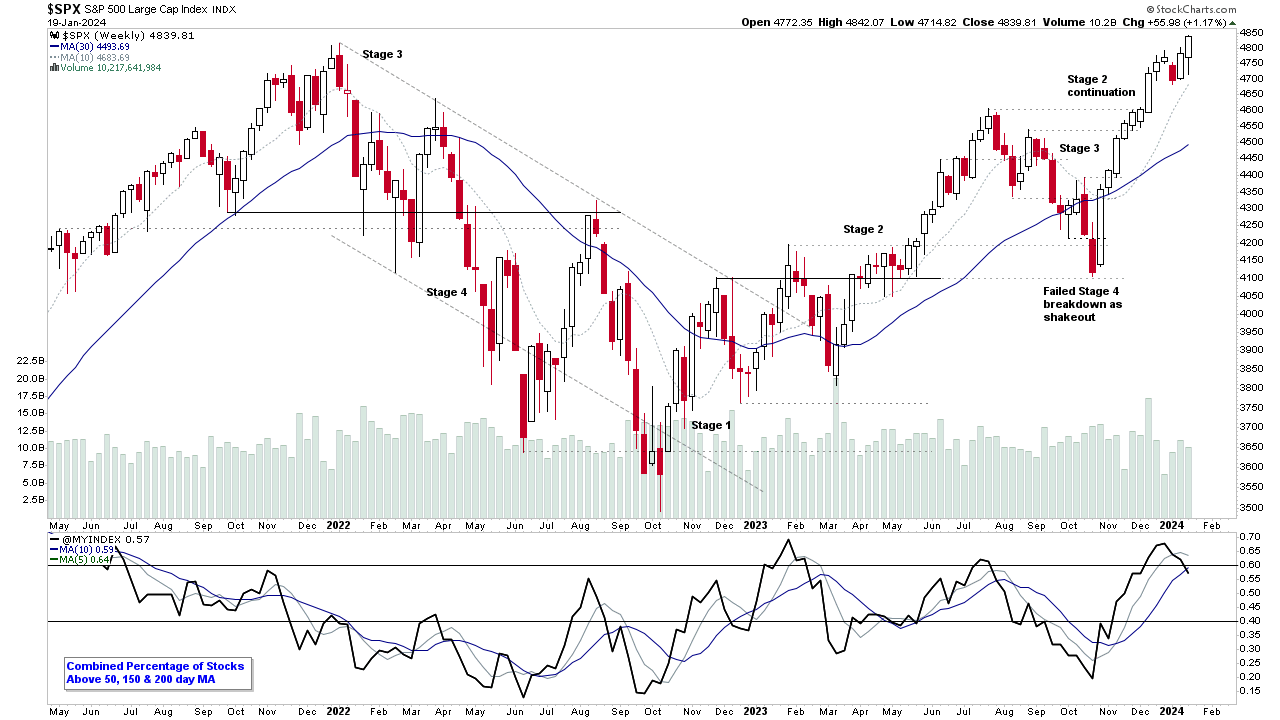
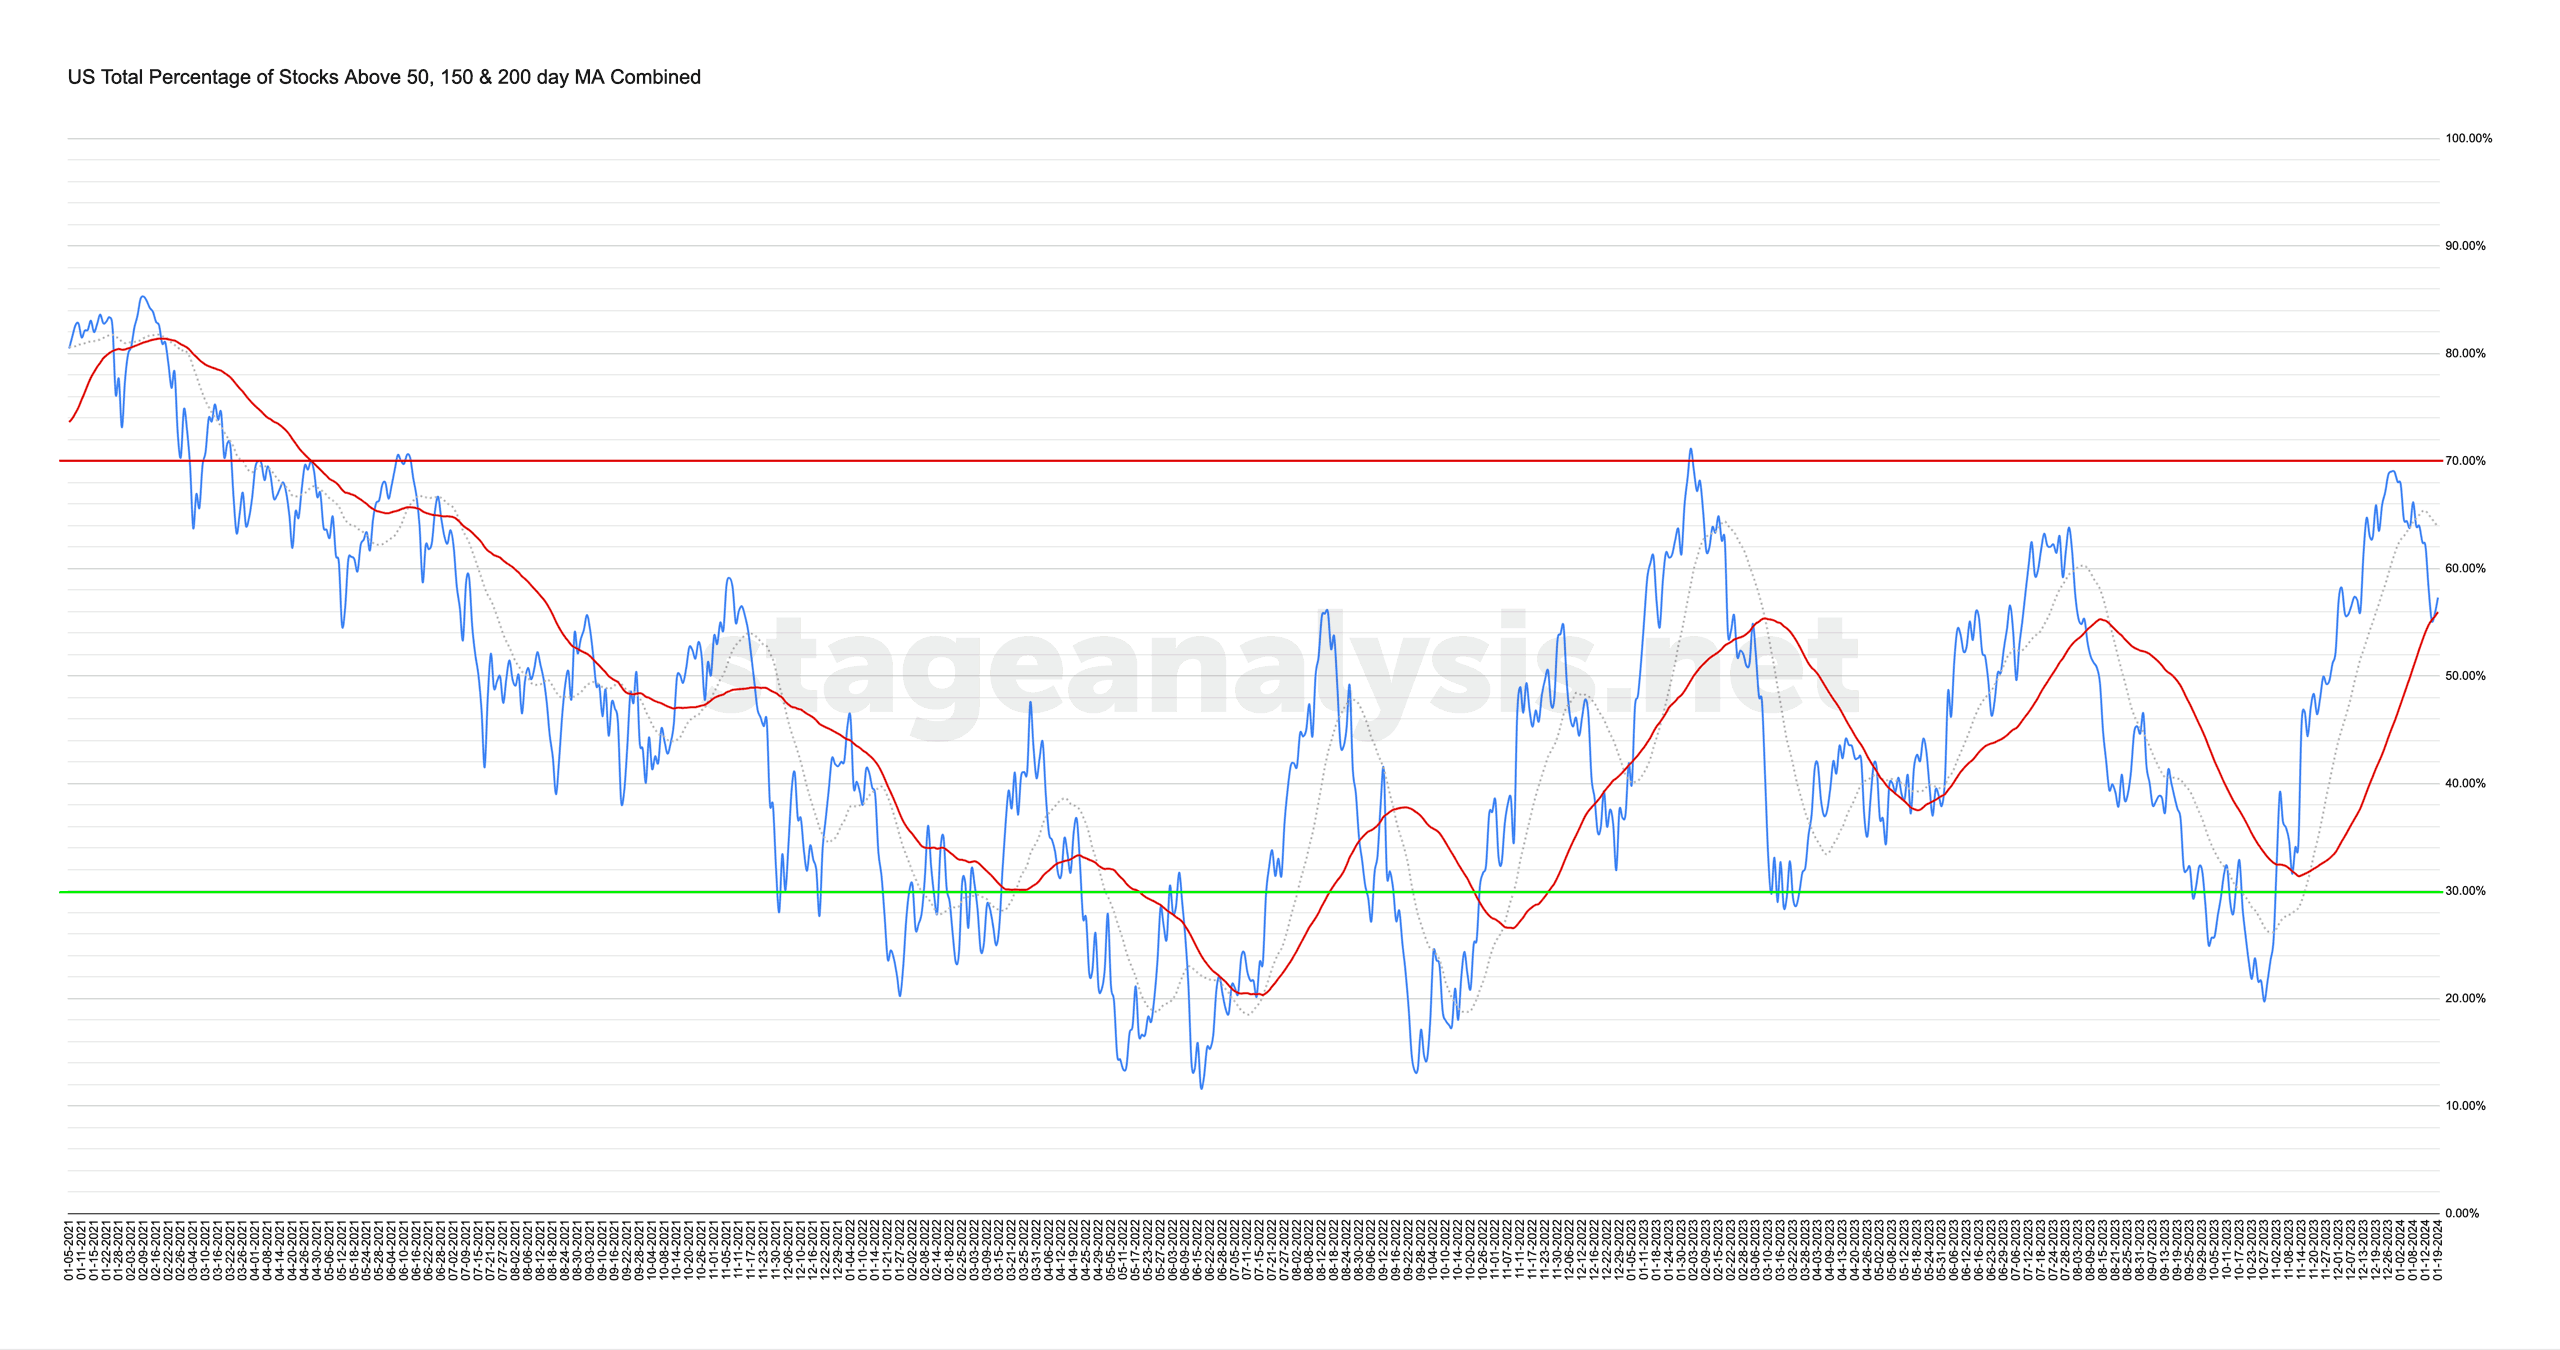
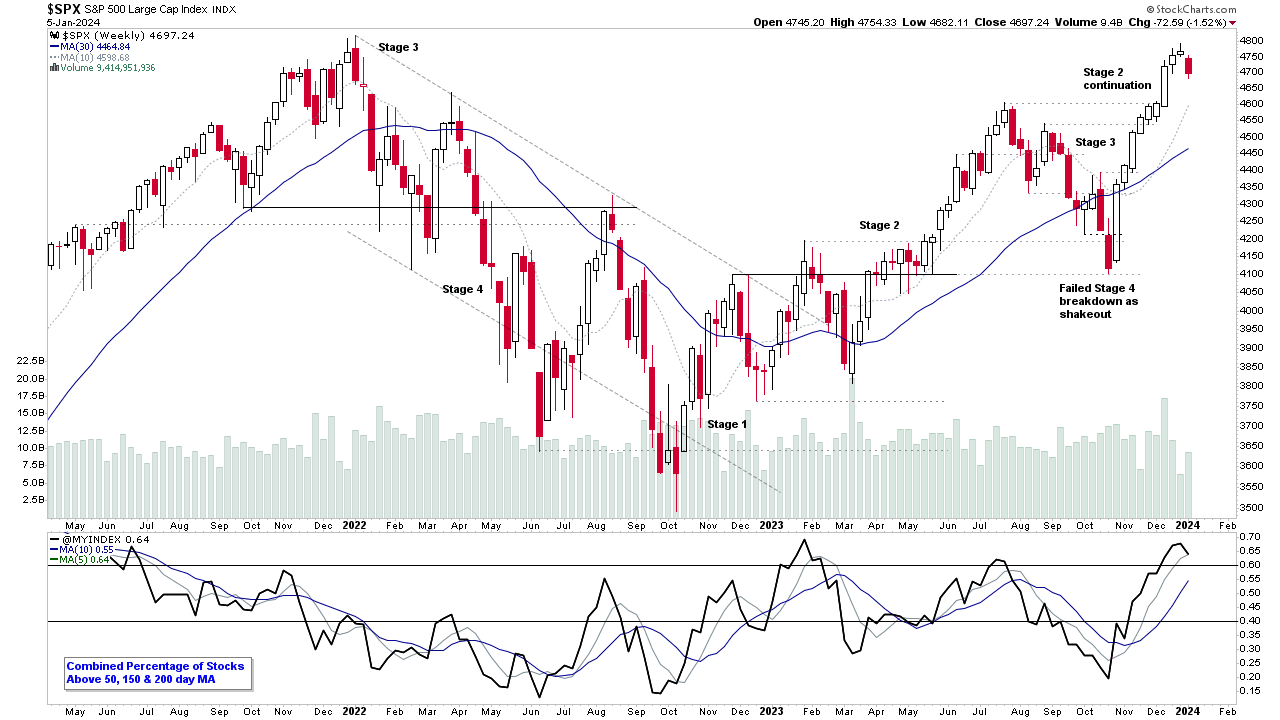
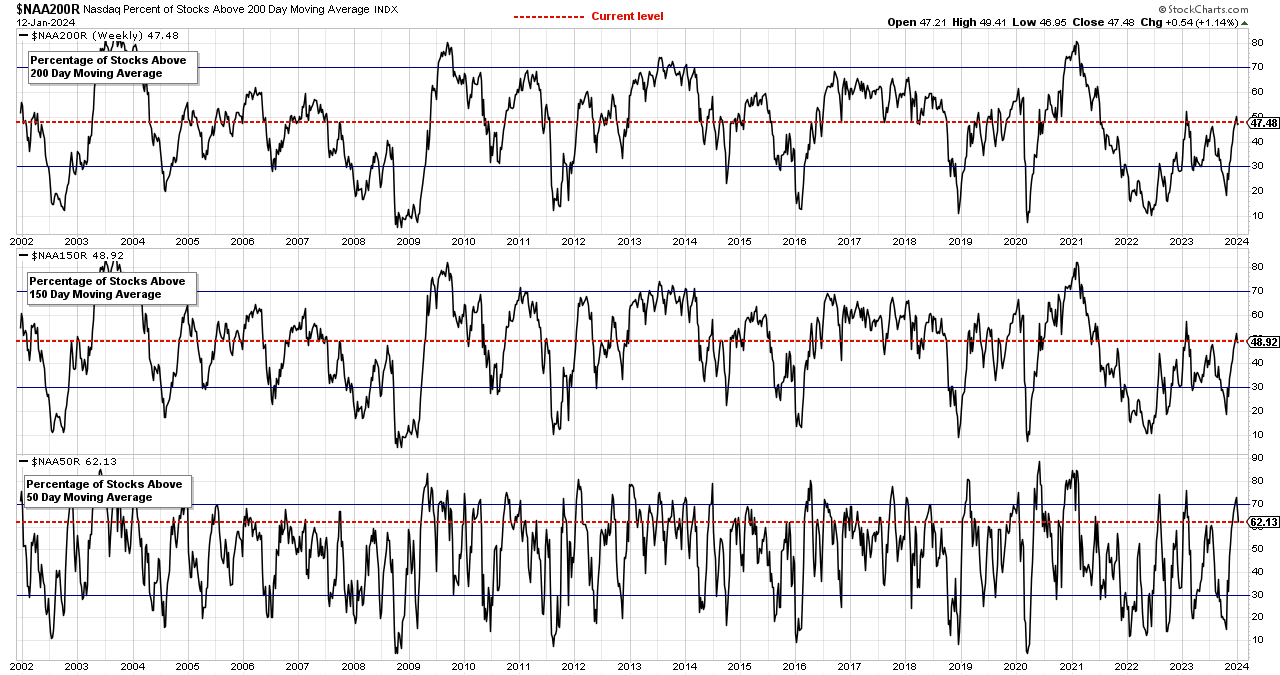
Market Breadth: Percentage of Stocks Above their 50 Day, 150 Day & 200 Day Moving Averages Combined
The US Total Percentage of Stocks above their 50 Day, 150 Day & 200 Day Moving Averages (shown above) decreased by +2.85% this week. Therefore, the overall combined average is at 60.15% in the US market (NYSE and Nasdaq markets combined) above their short, medium and long term moving averages...
Read More
25 January, 2024
US Stocks Watchlist – 25 January 2024
There were 30 stocks highlighted from the US stocks watchlist scans today...
Read More
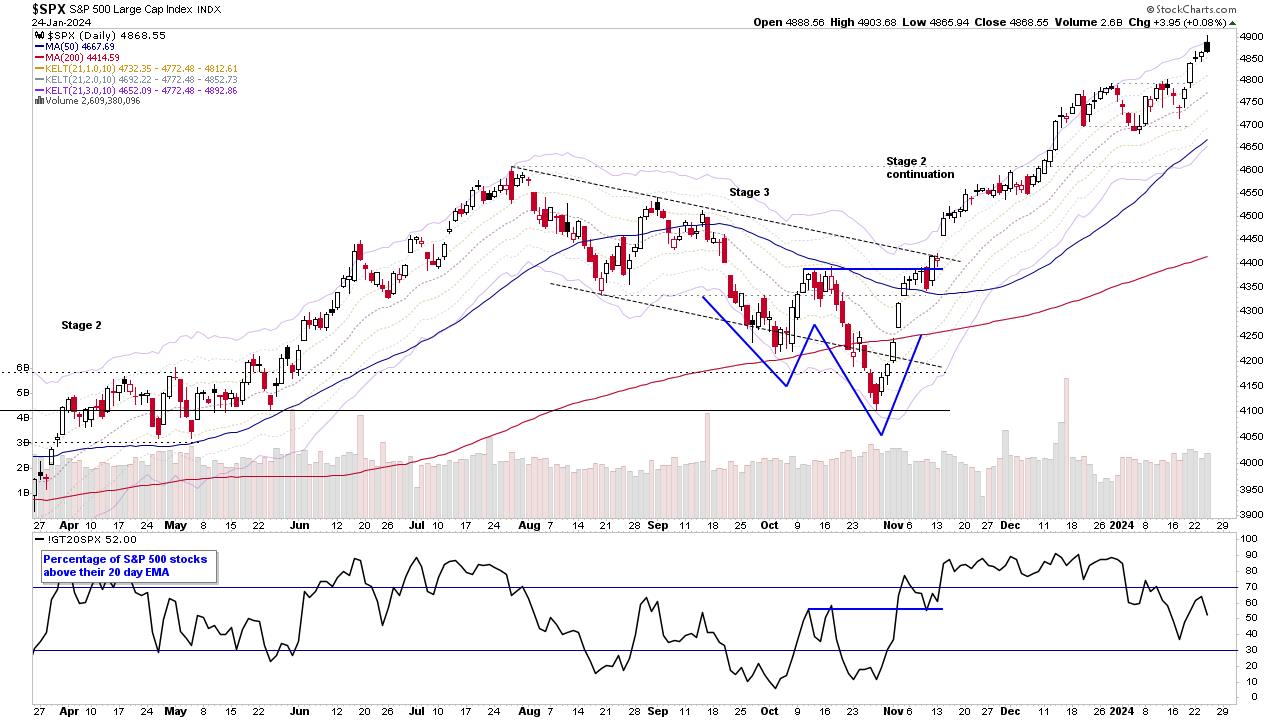
24 January, 2024
Stage Analysis Members Video – 24 January 2024 (53mins)
Stage Analysis midweek video discussing of the major US stock market indexes, short-term market breadth measures, and finishing with a look at the most recent watchlist stocks on multiple timeframes...
Read More
22 January, 2024
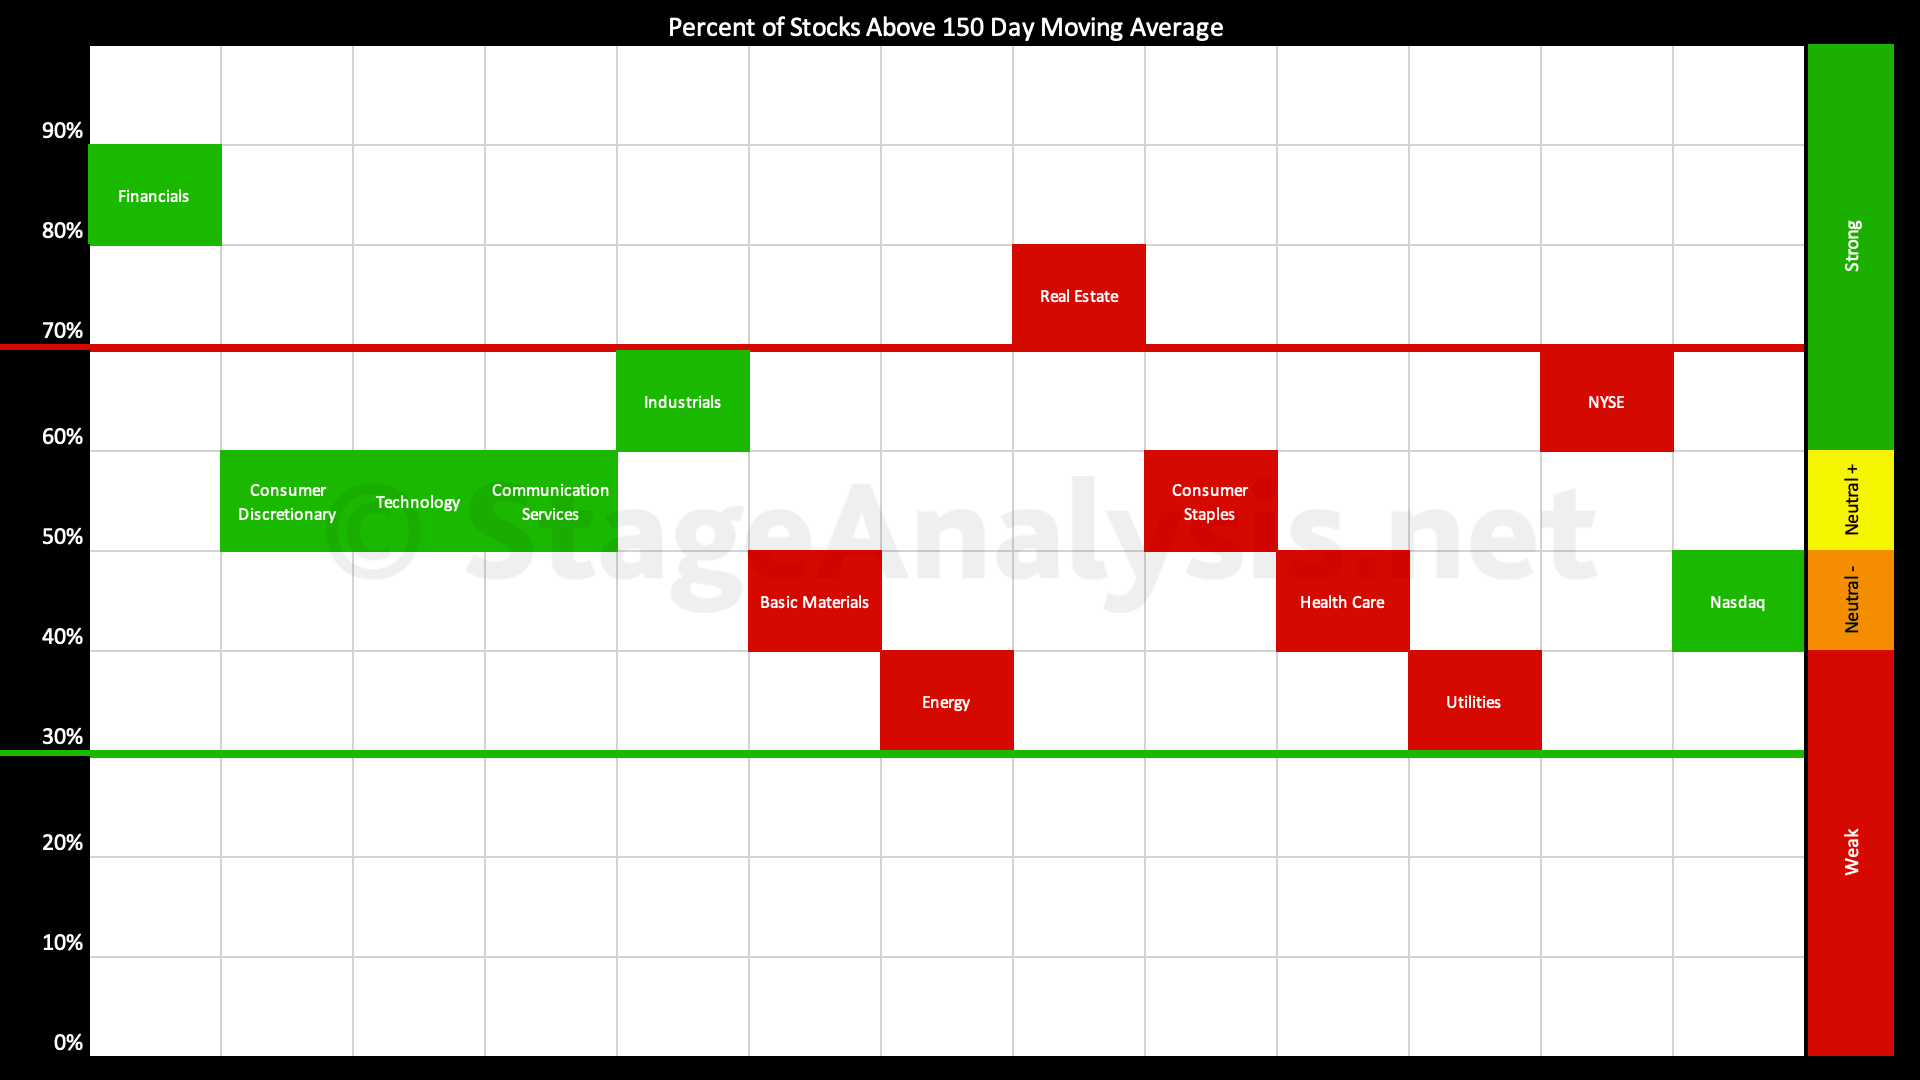
Sector Breadth: Percentage of US Stocks Above Their 150 day (30 Week) Moving Averages
The percentage of US stocks above their 150 day moving averages in the 11 major sectors decreased by -5.95% since the previous post on the 8th January 2024, moving the overall average to 54.08%, which is in the Neutral+ zone (50% to 59.99% range)...
Read More
21 January, 2024
Stage Analysis Members Video – 21 January 2024 (1hr 26mins)
Stage Analysis members weekend video discussing the Major US Stock Market Indexes, the Futures charts, Industry Groups Relative Strength (RS) Rankings, IBD Industry Group Bell Curve – Bullish Percent, the key Market Breadth Charts to determine the Weight of Evidence, Significant Weekly Bars and the most recent US watchlist stocks in detail on multiple timeframes...
Read More
20 January, 2024
Market Breadth: Percentage of Stocks Above their 50 Day, 150 Day & 200 Day Moving Averages Combined
The US Total Percentage of Stocks above their 50 Day, 150 Day & 200 Day Moving Averages (shown above) decreased by -4.75% this week. Therefore, the overall combined average is at 57.30% in the US market (NYSE and Nasdaq markets combined) above their short, medium and long term moving averages...
Read More
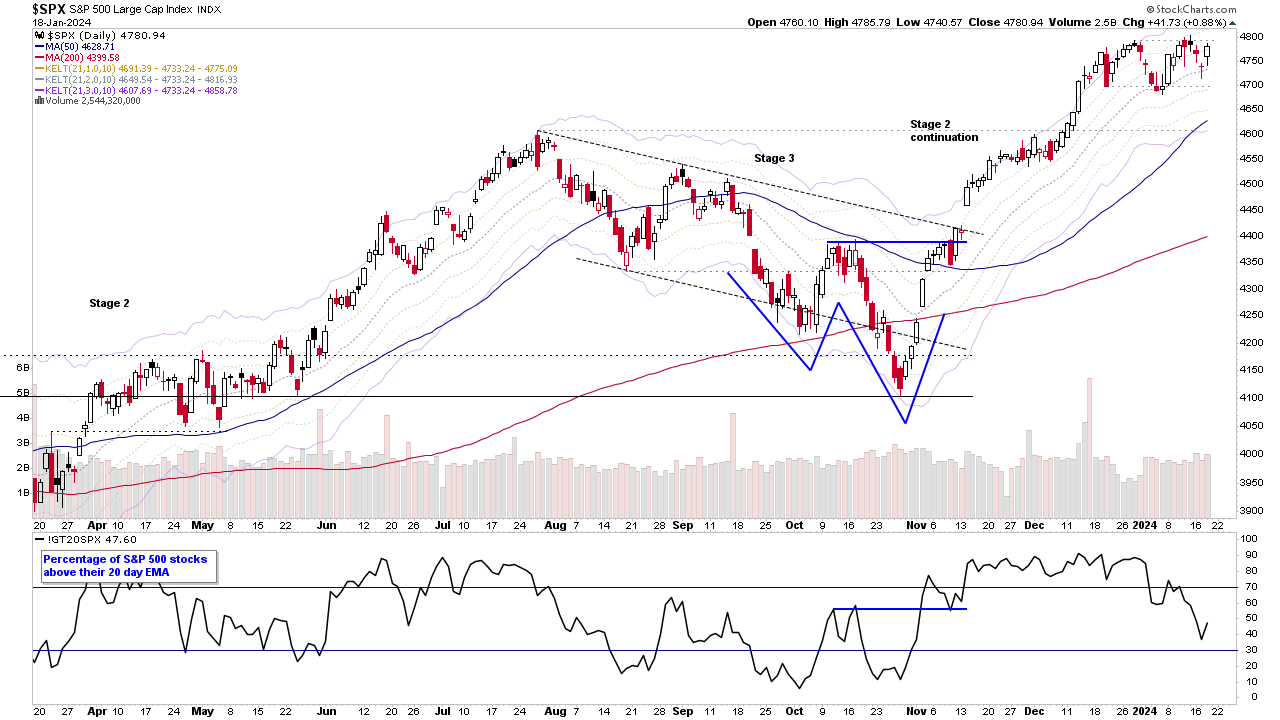
18 January, 2024
US Stocks Watchlist – 18 January 2024
There were 28 stocks highlighted from the US stocks watchlist scans today...
Read More
14 January, 2024
Stage Analysis Members Video – 14 January 2024 (59mins)
Stage Analysis members weekend video discussing the Major US Stock Market Indexes, and then in the members only content – the Futures charts, Industry Groups Relative Strength (RS) Rankings, IBD Industry Group Bell Curve – Bullish Percent, the key Market Breadth Charts to determine the Weight of Evidence, Significant Weekly Bars and the most recent US watchlist stocks in detail on multiple timeframes.
Read More
13 January, 2024
Market Breadth: Percentage of Stocks Above their 50 Day, 150 Day & 200 Day Moving Averages Combined
Custom Percentage of Stocks Above Their 50 Day, 150 Day & 200 Day Moving Averages Combined Market Breadth Charts for the Overall US Market, NYSE and Nasdaq for Market Timing and Strategy.
Read More