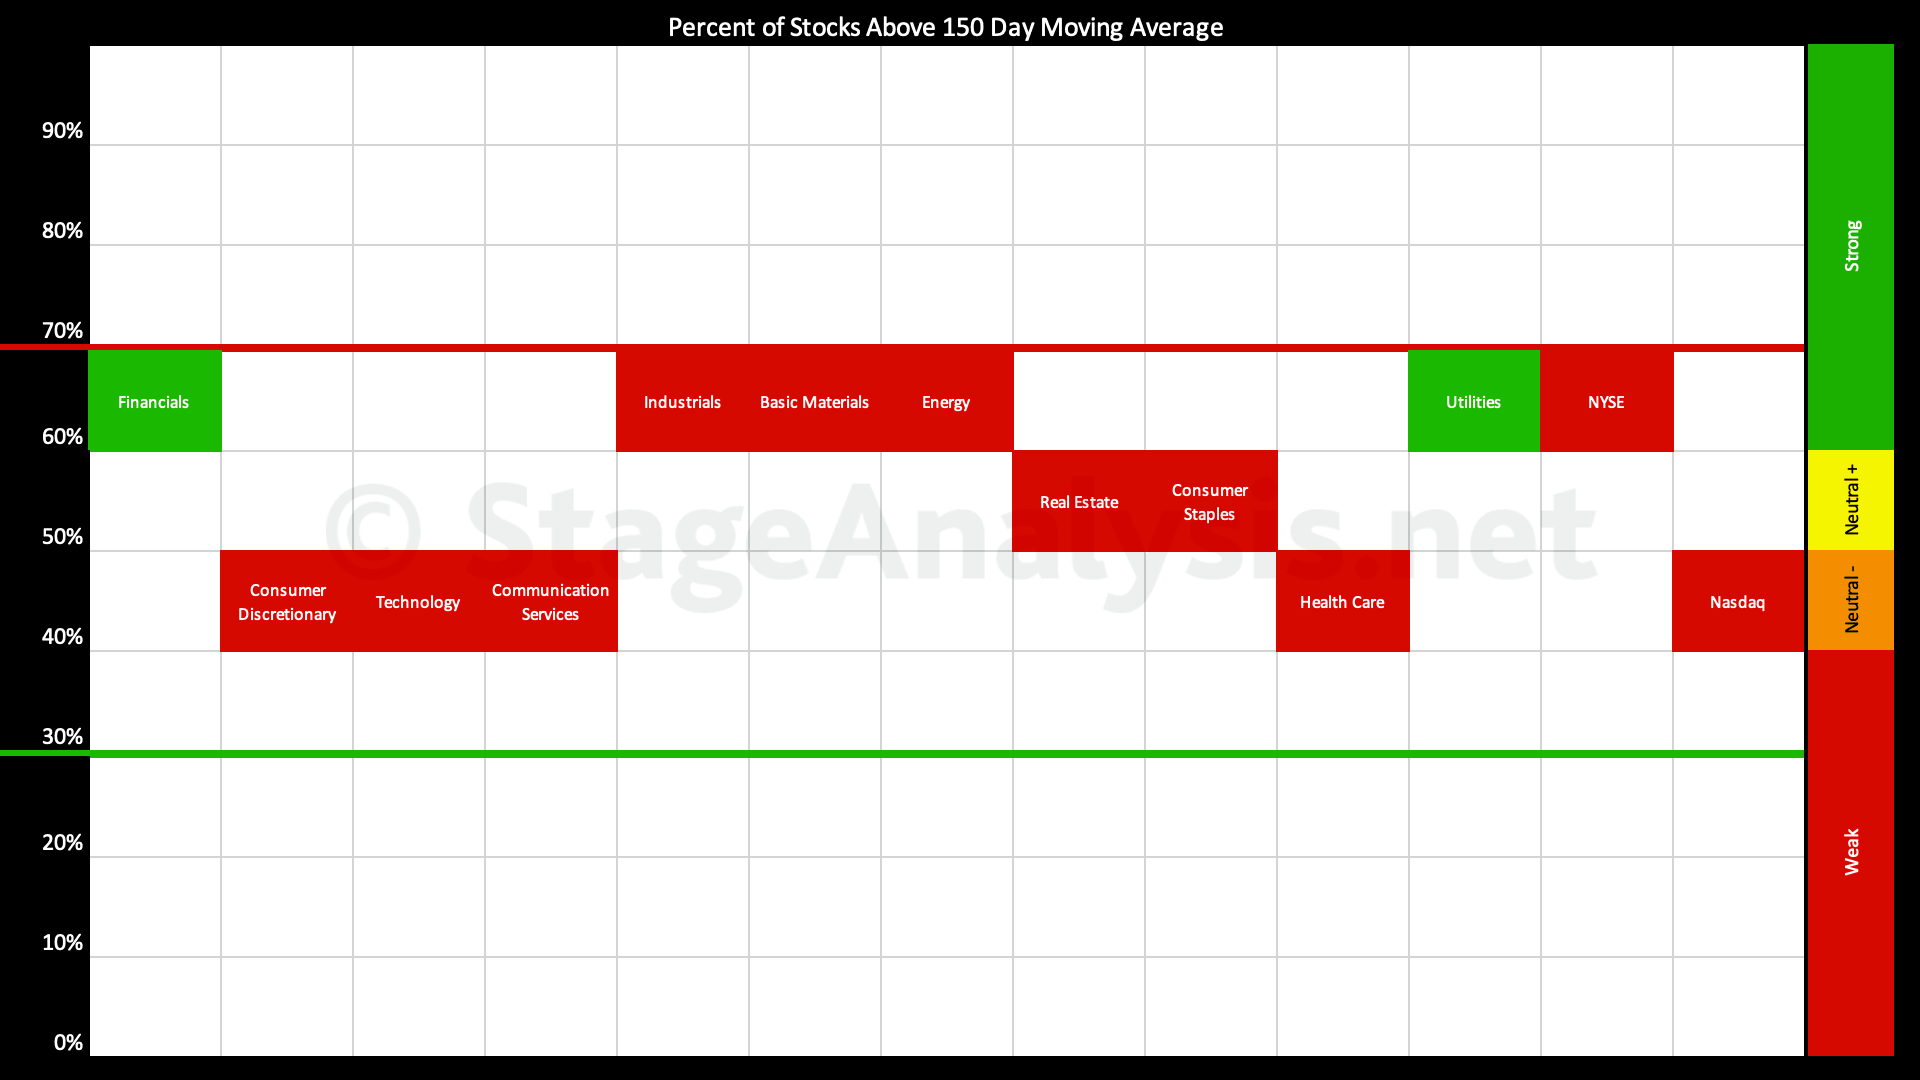
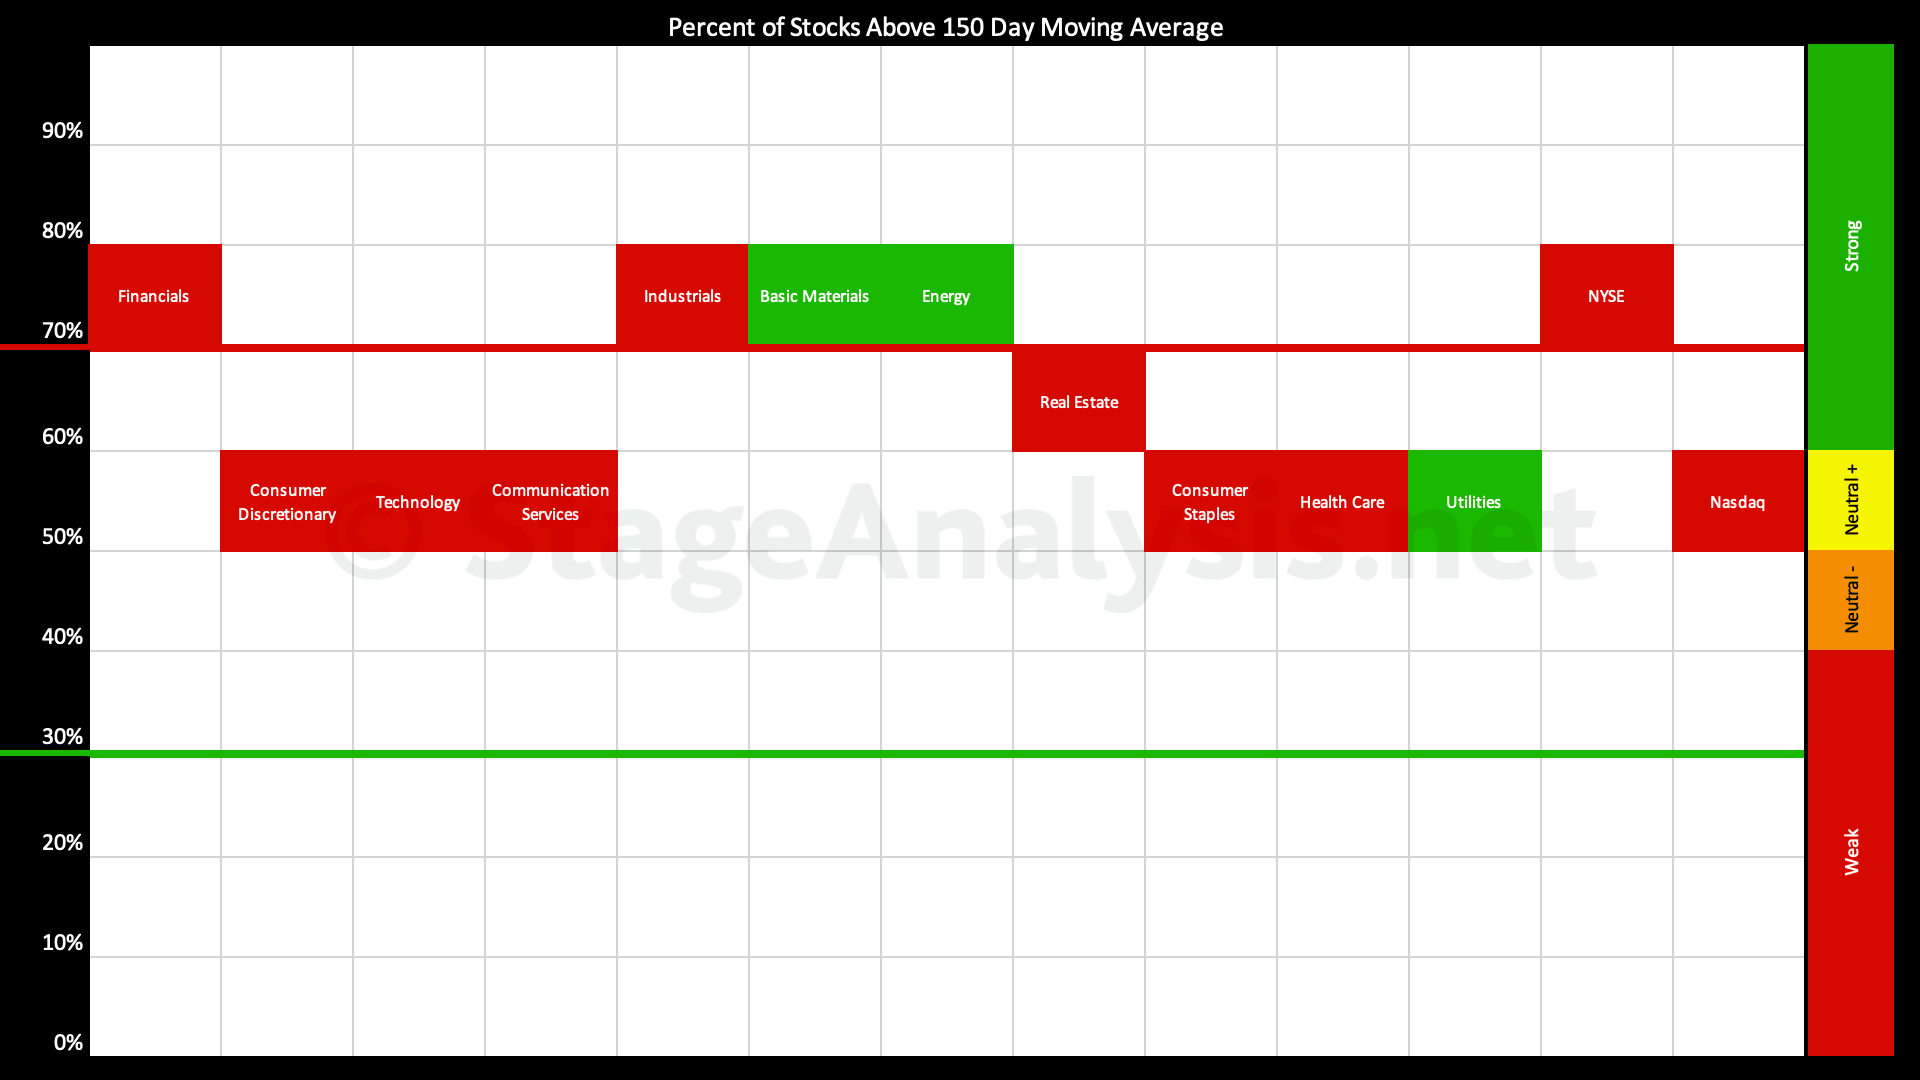
The percentage of US stocks above their 150 day moving averages in the 11 major sectors decreased by -9.03% since the previous post, moving the overall average to 54.07%, which is the Neutral zone (40% to 60% range).
Read More

Blog
21 April, 2024
Stage Analysis Members Video – 21 April 2024 (56mins)
Stage Analysis members weekend video discussing the US watchlist stocks, Significant Weekly Bars moving on volume, the new interactive GICS Sub-industries Bell Curve, the Industry Groups Relative Strength (RS) Rankings, the key Market Breadth Charts to determine the Weight of Evidence, and the Major US Stock Market Indexes.
Read More
20 April, 2024
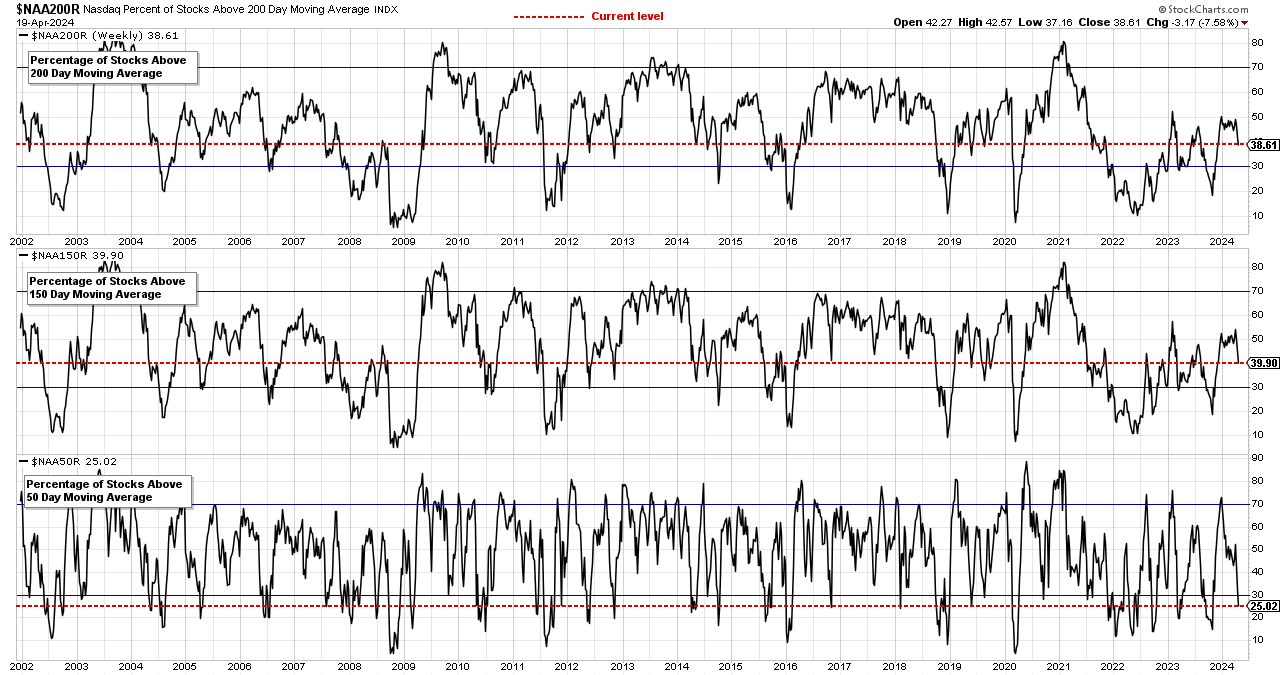
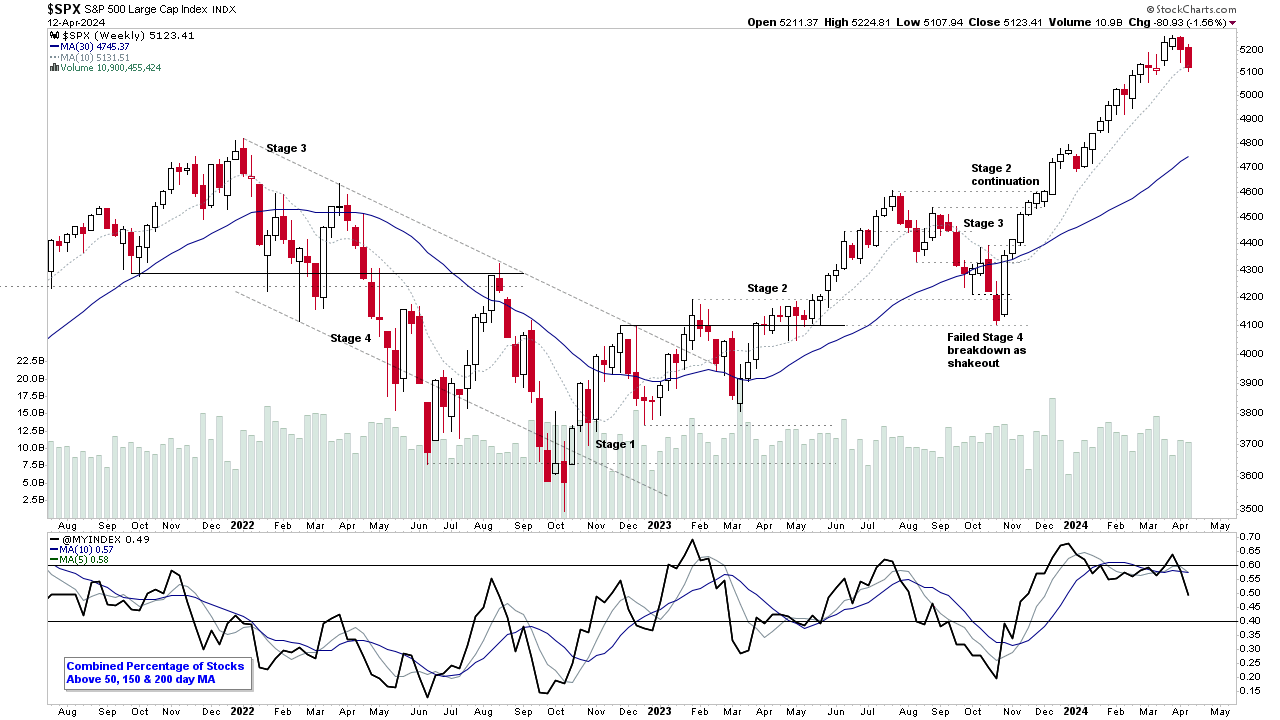
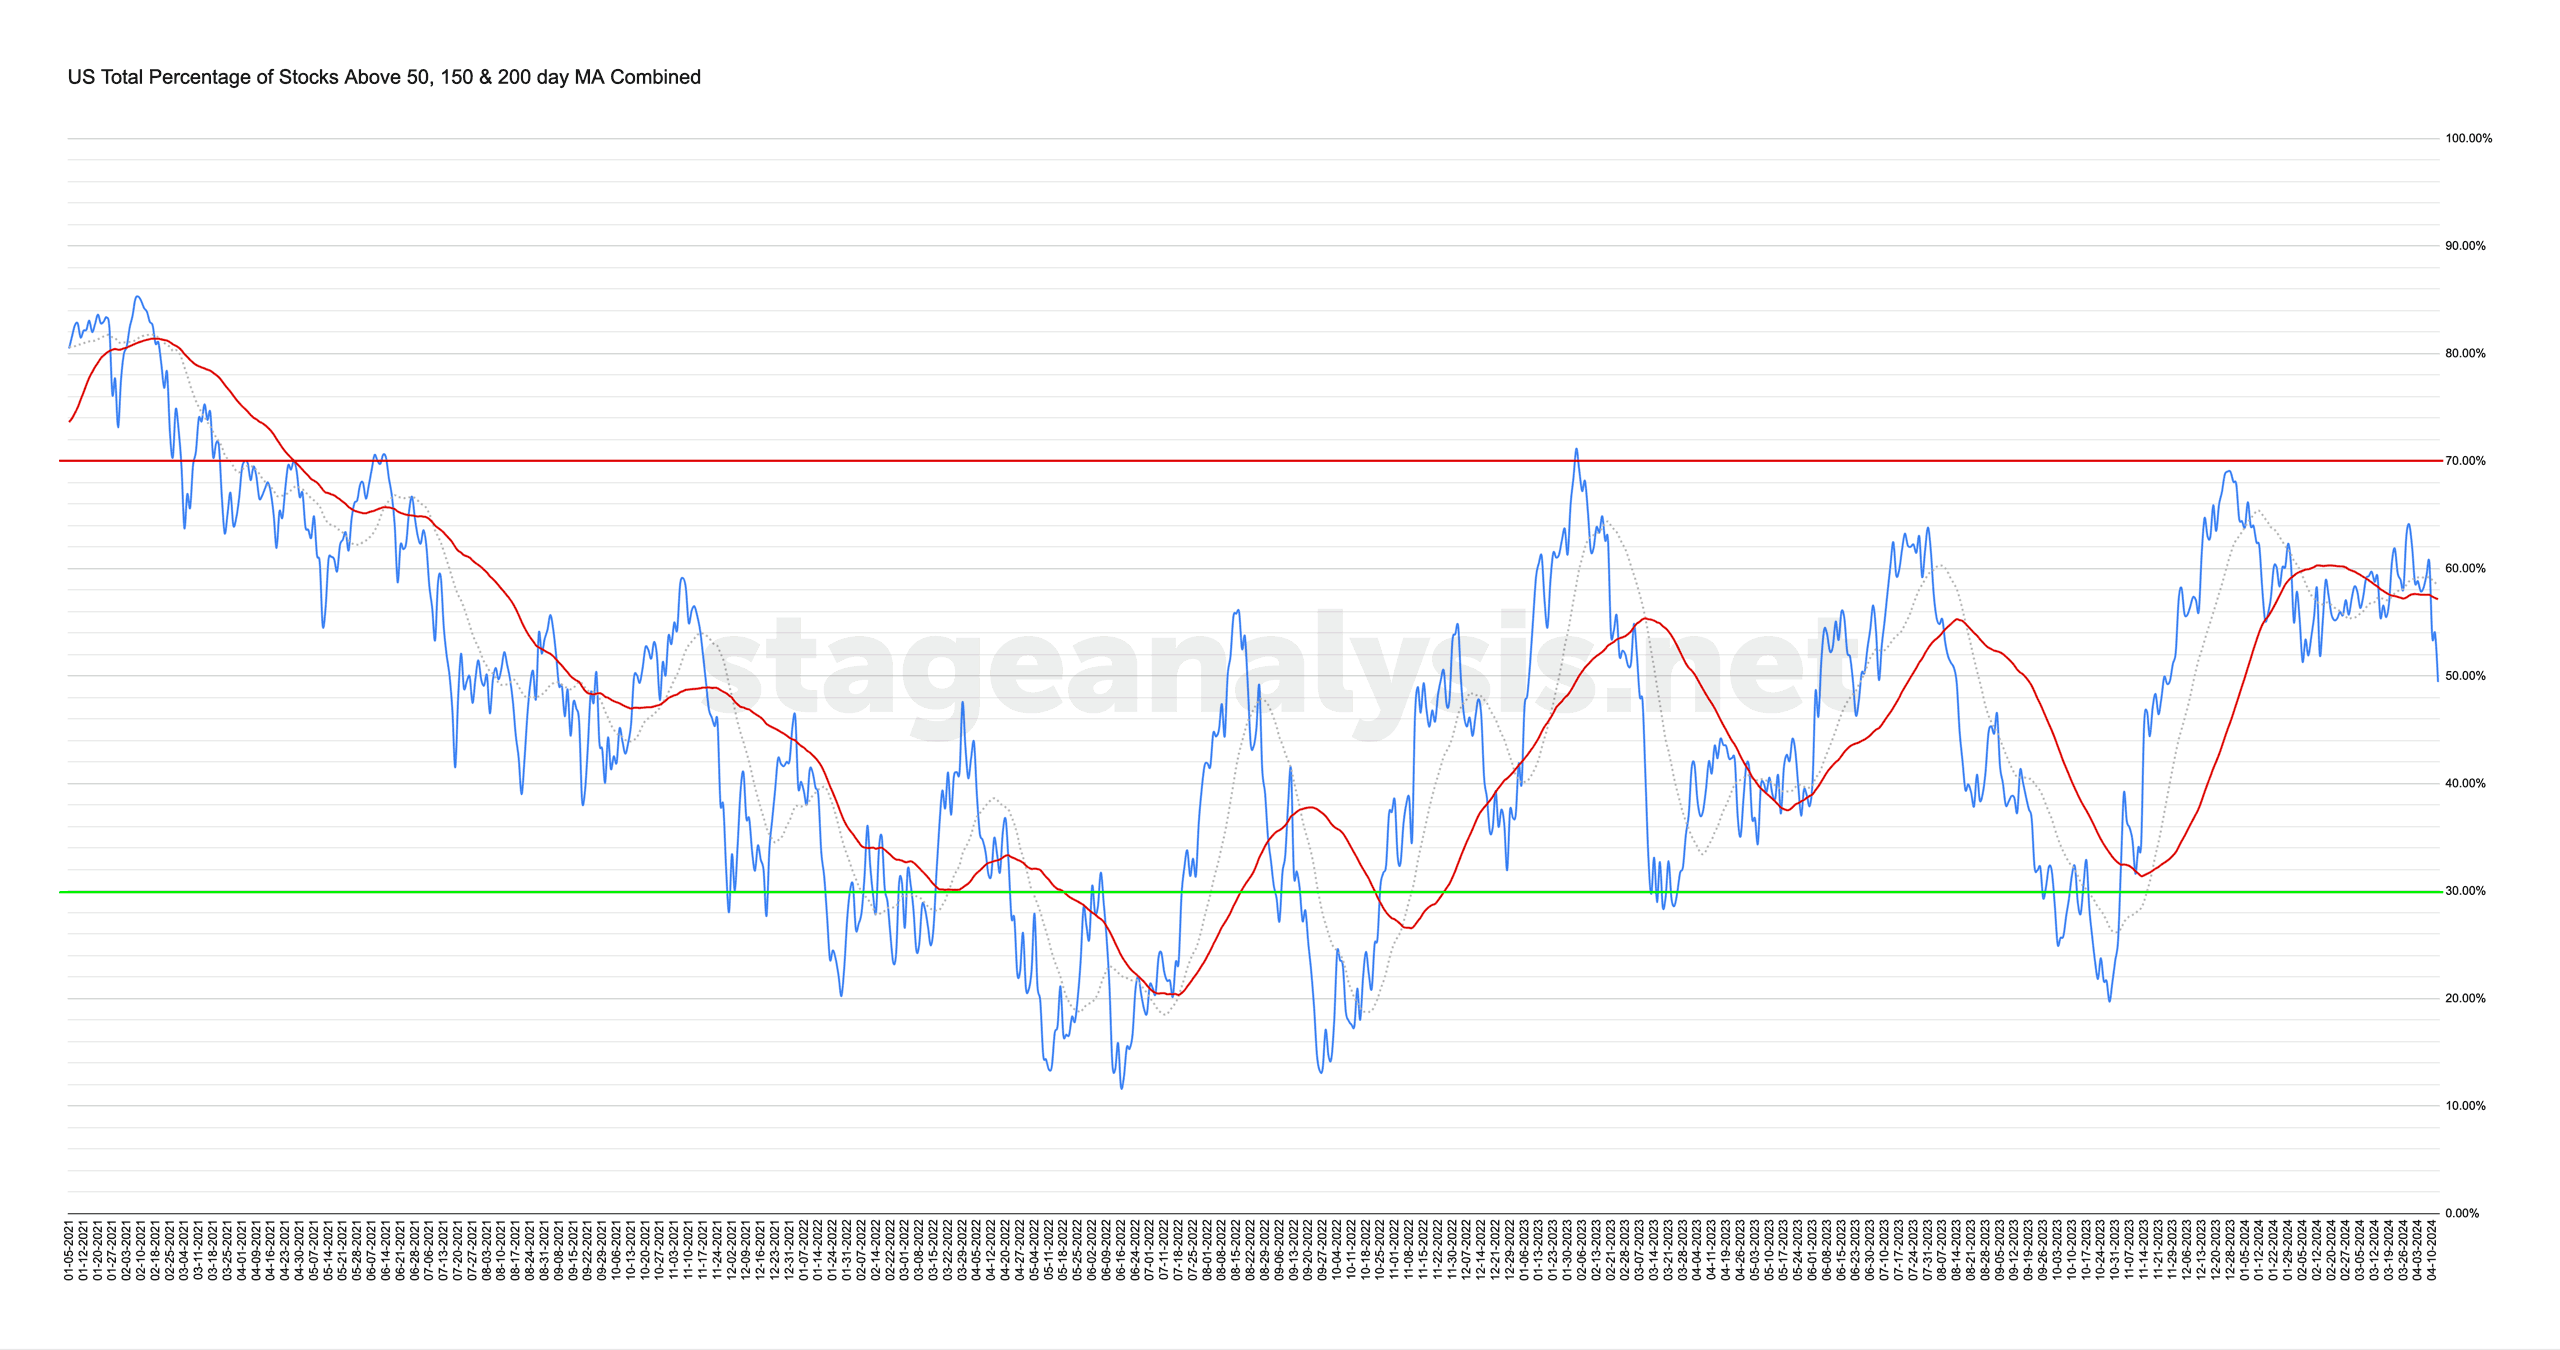
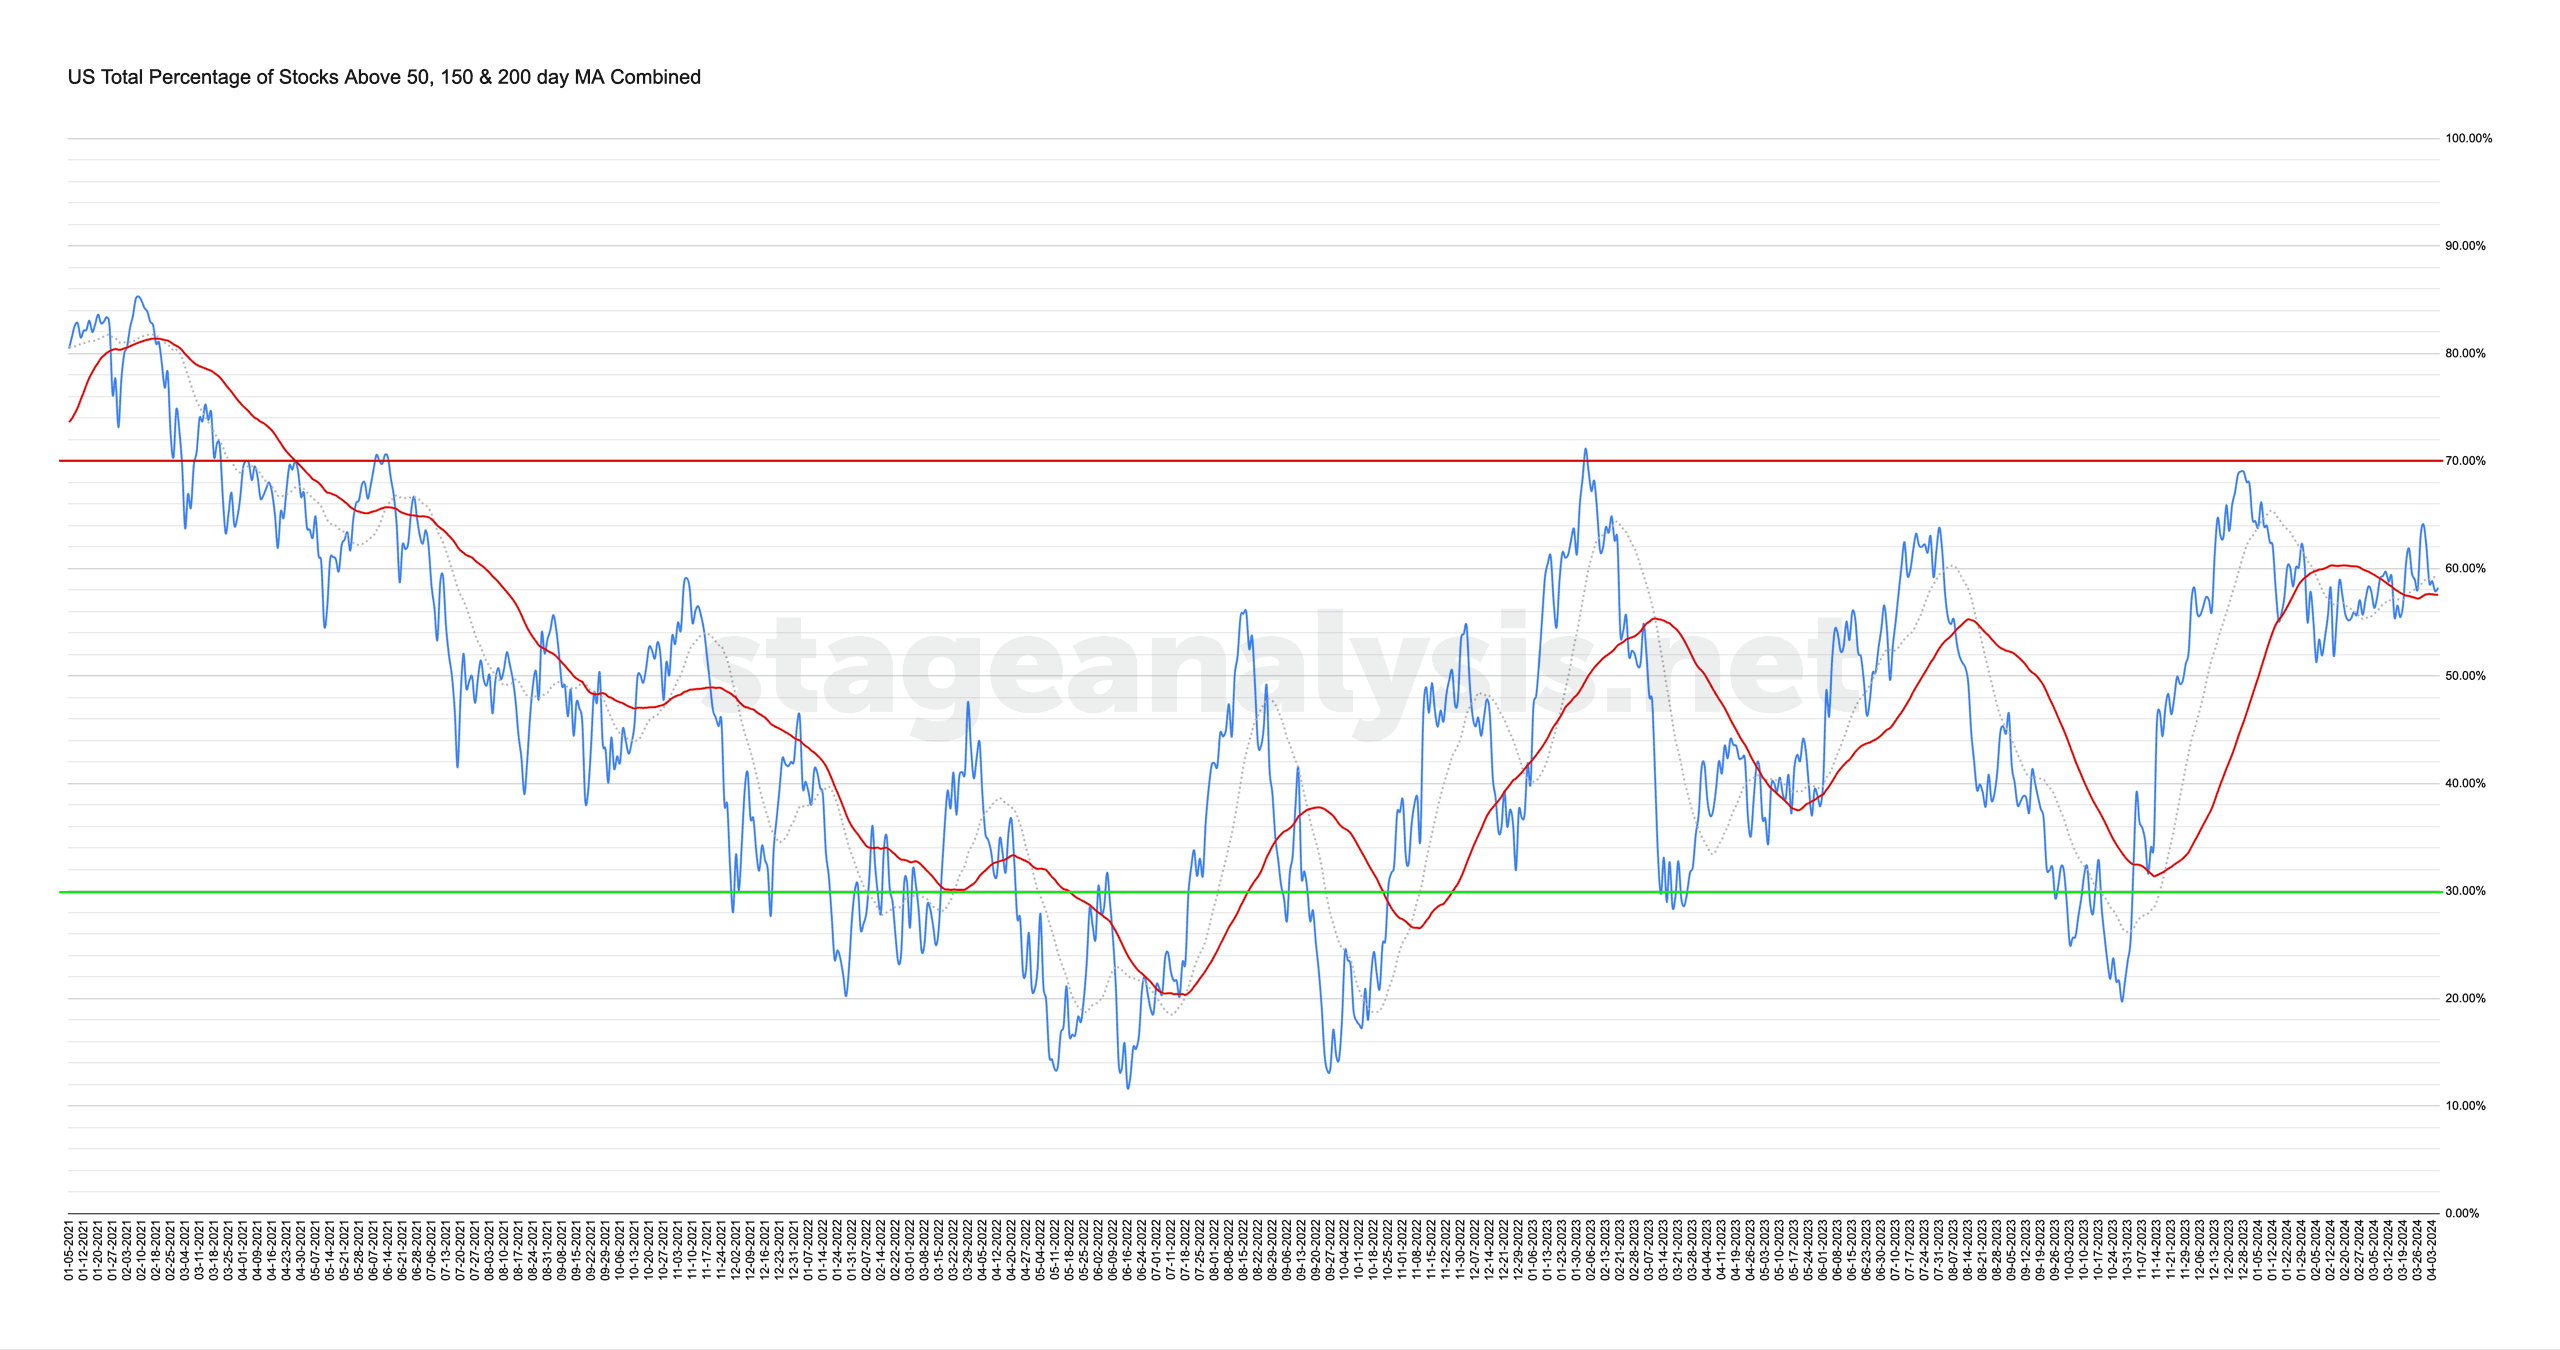
Market Breadth: Percentage of Stocks Above their 50 Day, 150 Day & 200 Day Moving Averages Combined
Custom percentage of stocks above their 50 day, 150 day & 200 day moving averages combined market breadth charts for the overall US market, NYSE and Nasdaq for market timing and strategy...
Read More
14 April, 2024
Stage Analysis Members Video – 14 April 2024 (46mins)
Stage Analysis members weekend video discussing the Major US Stock Market Indexes, the Industry Groups Relative Strength (RS) Rankings, IBD Industry Group Bell Curve – Bullish Percent and transitioning to the new GICS Sub-industries Bell Curve data, the key Market Breadth Charts to determine the Weight of Evidence, this weeks Significant Weekly Bars moving on volume, and the US watchlist stocks.
Read More
13 April, 2024
Market Breadth: Percentage of Stocks Above their 50 Day, 150 Day & 200 Day Moving Averages Combined
The US Total Percentage of Stocks above their 50 Day, 150 Day & 200 Day Moving Averages (shown above) decreased by -8.78% this week. Therefore, the overall combined average is at 49.45% in the US market (NYSE and Nasdaq markets combined) above their short, medium and long term moving averages.
Read More
11 April, 2024
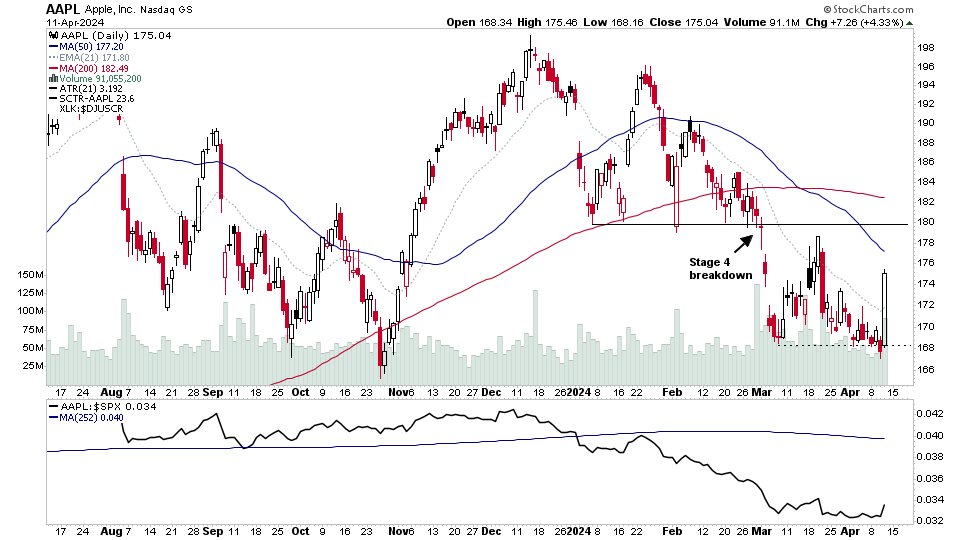
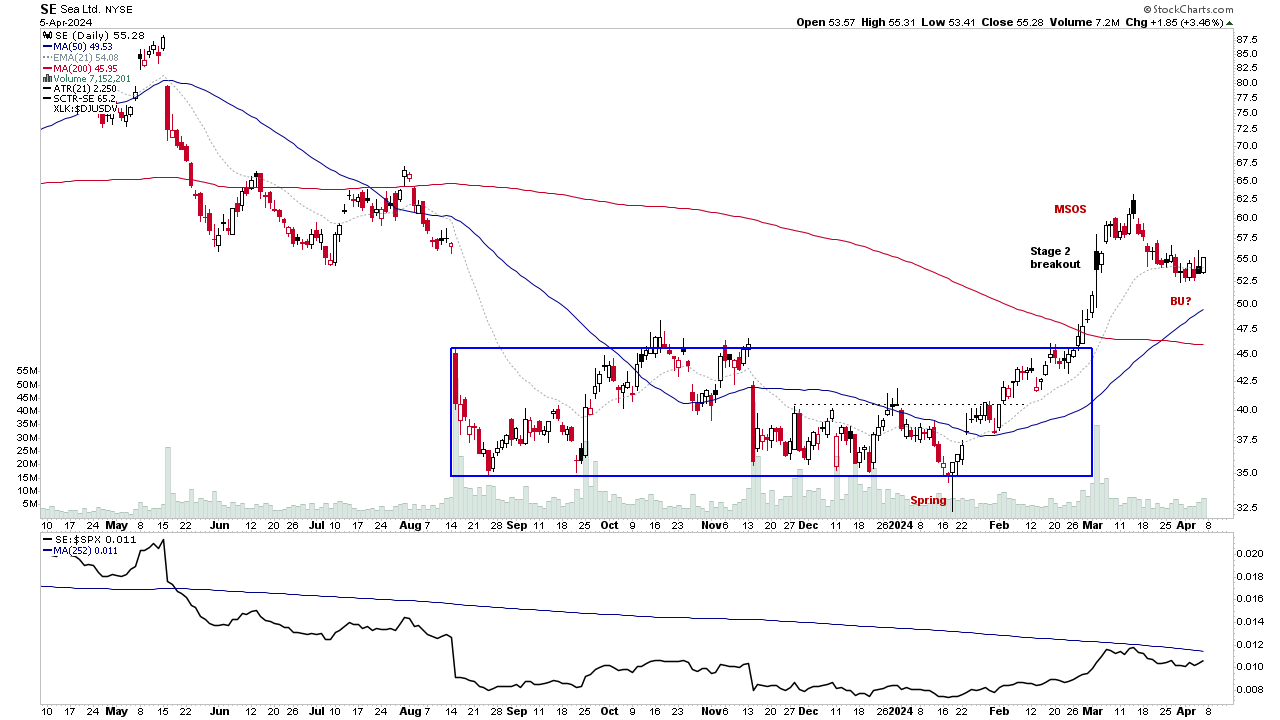
US Stocks Watchlist – 11 April 2024
There were 14 stocks highlighted from the US stocks watchlist scans today...
Read More
08 April, 2024
Sector Breadth: Percentage of US Stocks Above Their 150 day (30 Week) Moving Averages
The percentage of US stocks above their 150 day moving averages in the 11 major sectors increased by +3.08% since the previous post, moving the overall average to 63.10%, which is the Strong zone (60%+ range).
Read More
07 April, 2024
Stage Analysis Members Video – 7 April 2024 (59mins)
Stage Analysis members weekend video discussing the US watchlist stocks in detail on multiple timeframes, the Industry Groups Relative Strength (RS) Rankings, IBD Industry Group Bell Curve – Bullish Percent and transitioning to the new GICS Sub-industries Bell Curve data, the key Market Breadth Charts to determine the Weight of Evidence, this weeks Significant Weekly Bars moving on volume, and the Major US Stock Market Indexes, and then finishing by discussing the new features added to the Stage Analysis Technical Attributes (SATA) Tool this week, including the ETF Summary.
Read More
06 April, 2024
Market Breadth: Percentage of Stocks Above their 50 Day, 150 Day & 200 Day Moving Averages Combined
The US Total Percentage of Stocks above their 50 Day, 150 Day & 200 Day Moving Averages (shown above) decreased by -5.87% this week. Therefore, the overall combined average is at 58.23% in the US market (NYSE and Nasdaq markets combined) above their short, medium and long term moving averages.
Read More
03 April, 2024
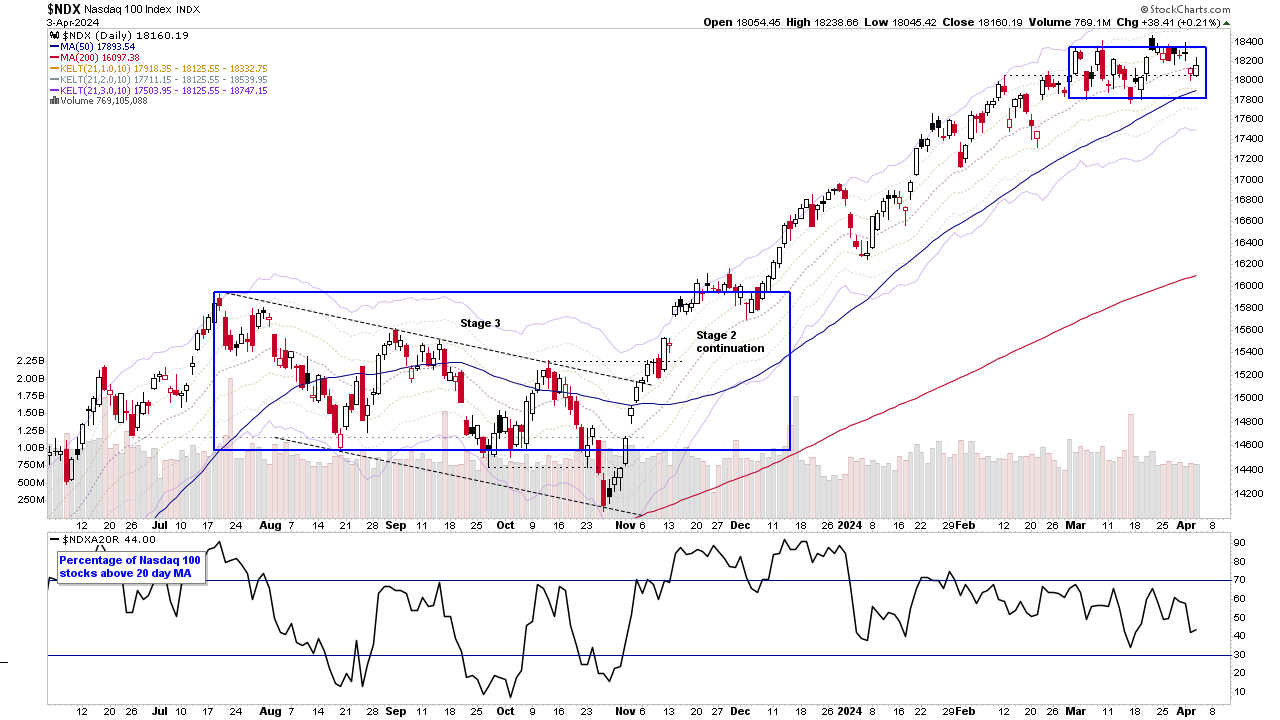
Stage Analysis Midweek Video – 3 April 2024 (34mins)
Midweek video discussing the major indexes, gold, silver, oil and copper. Plus the short-term market breadth data, and then a brief run through of some of the new features on the website.
Read More