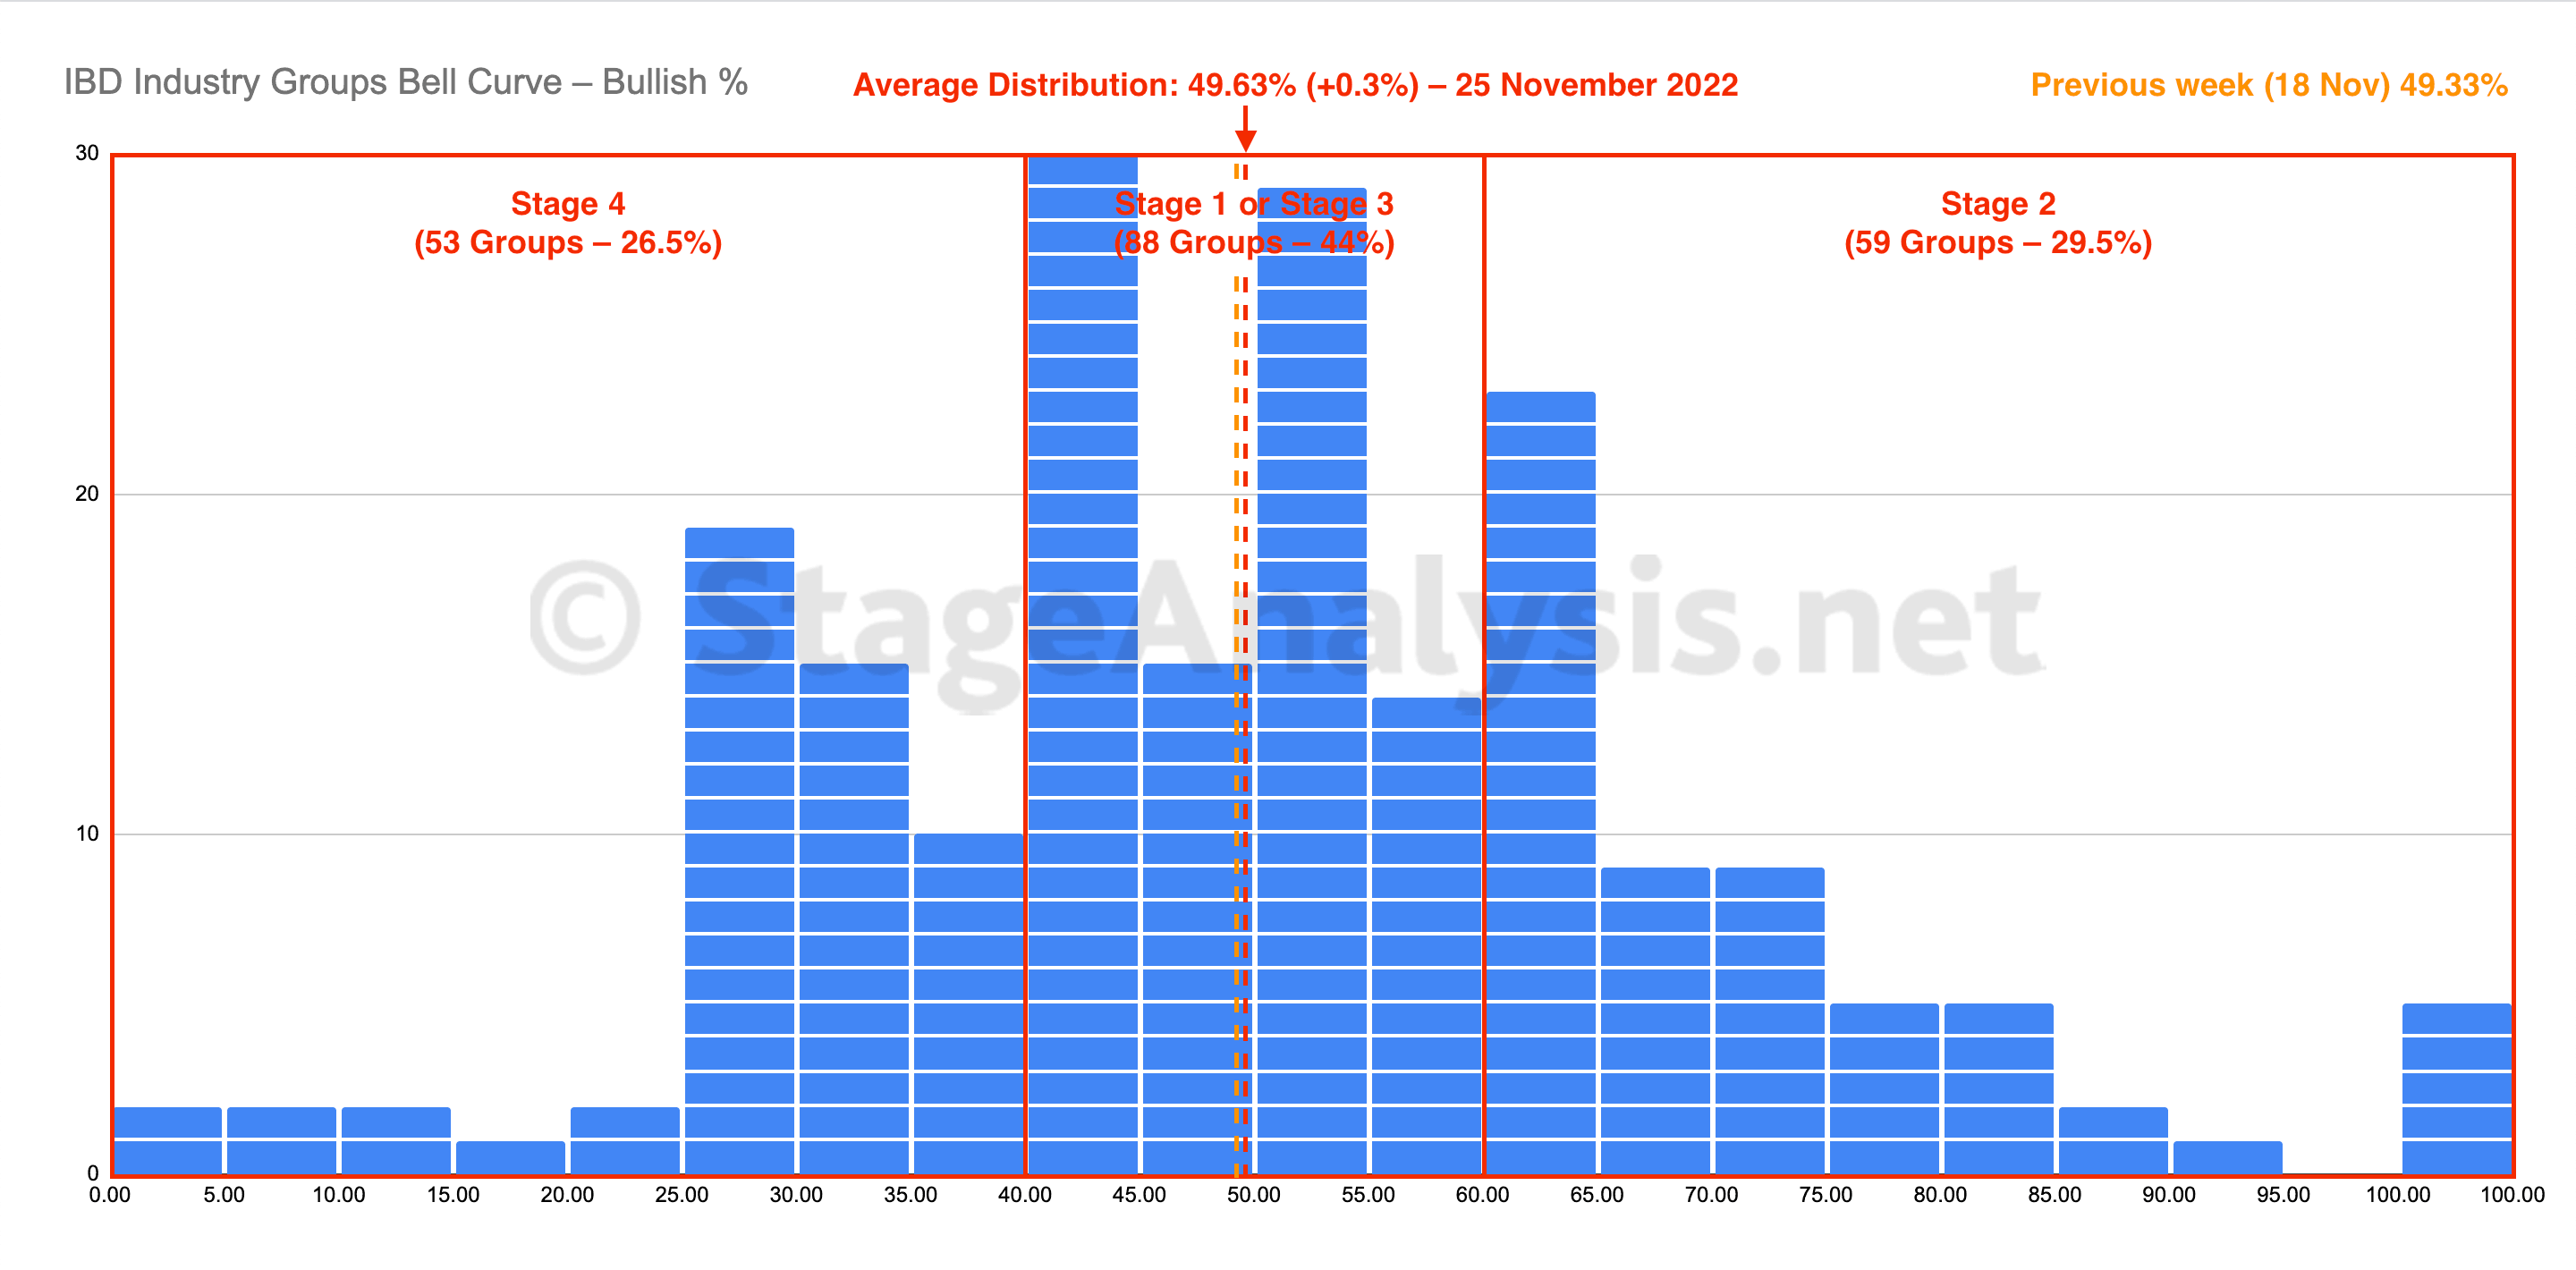
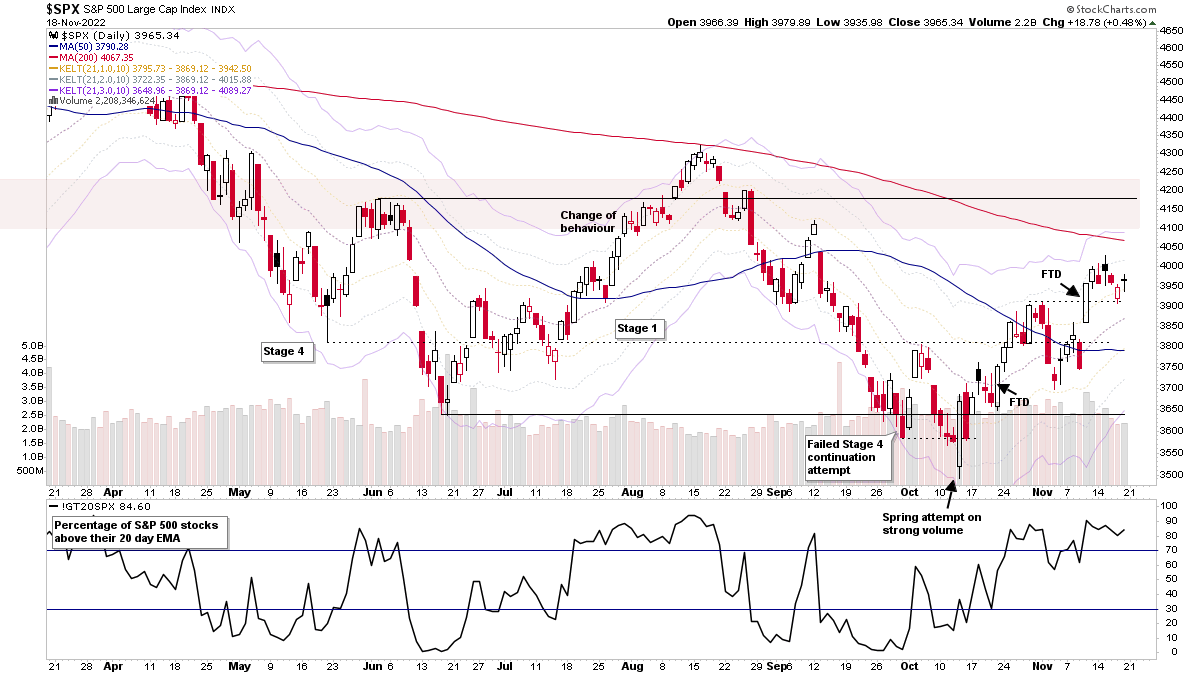
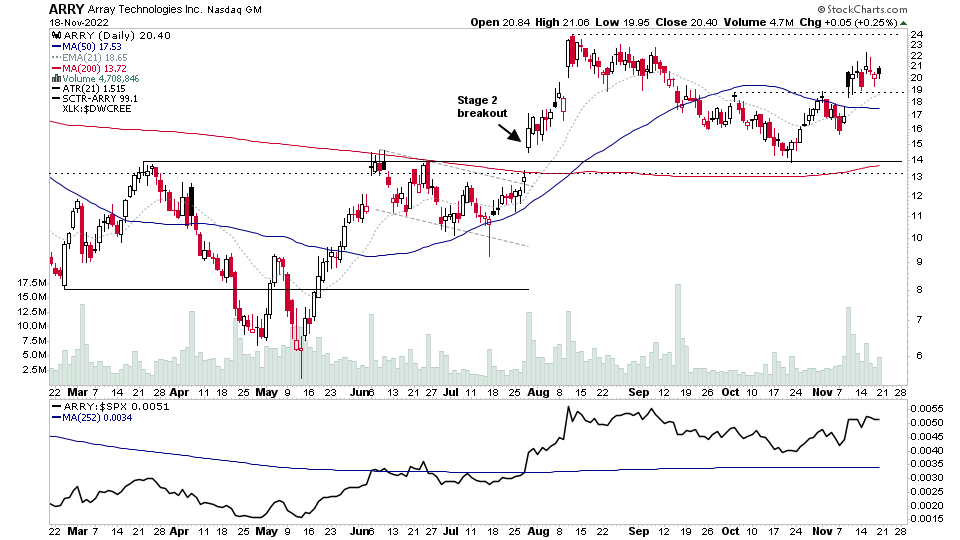
The IBD Industry Groups Bell Curve continued to consolidate for another week, with only a small gain of +0.30% to end the week at 49.63% over. So little change with it firmly in the middle of the range, and the majority of groups in the Stage 1 zone.
Read More
Blog
26 November, 2022
IBD Industry Groups Bell Curve – Bullish Percent
26 November, 2022
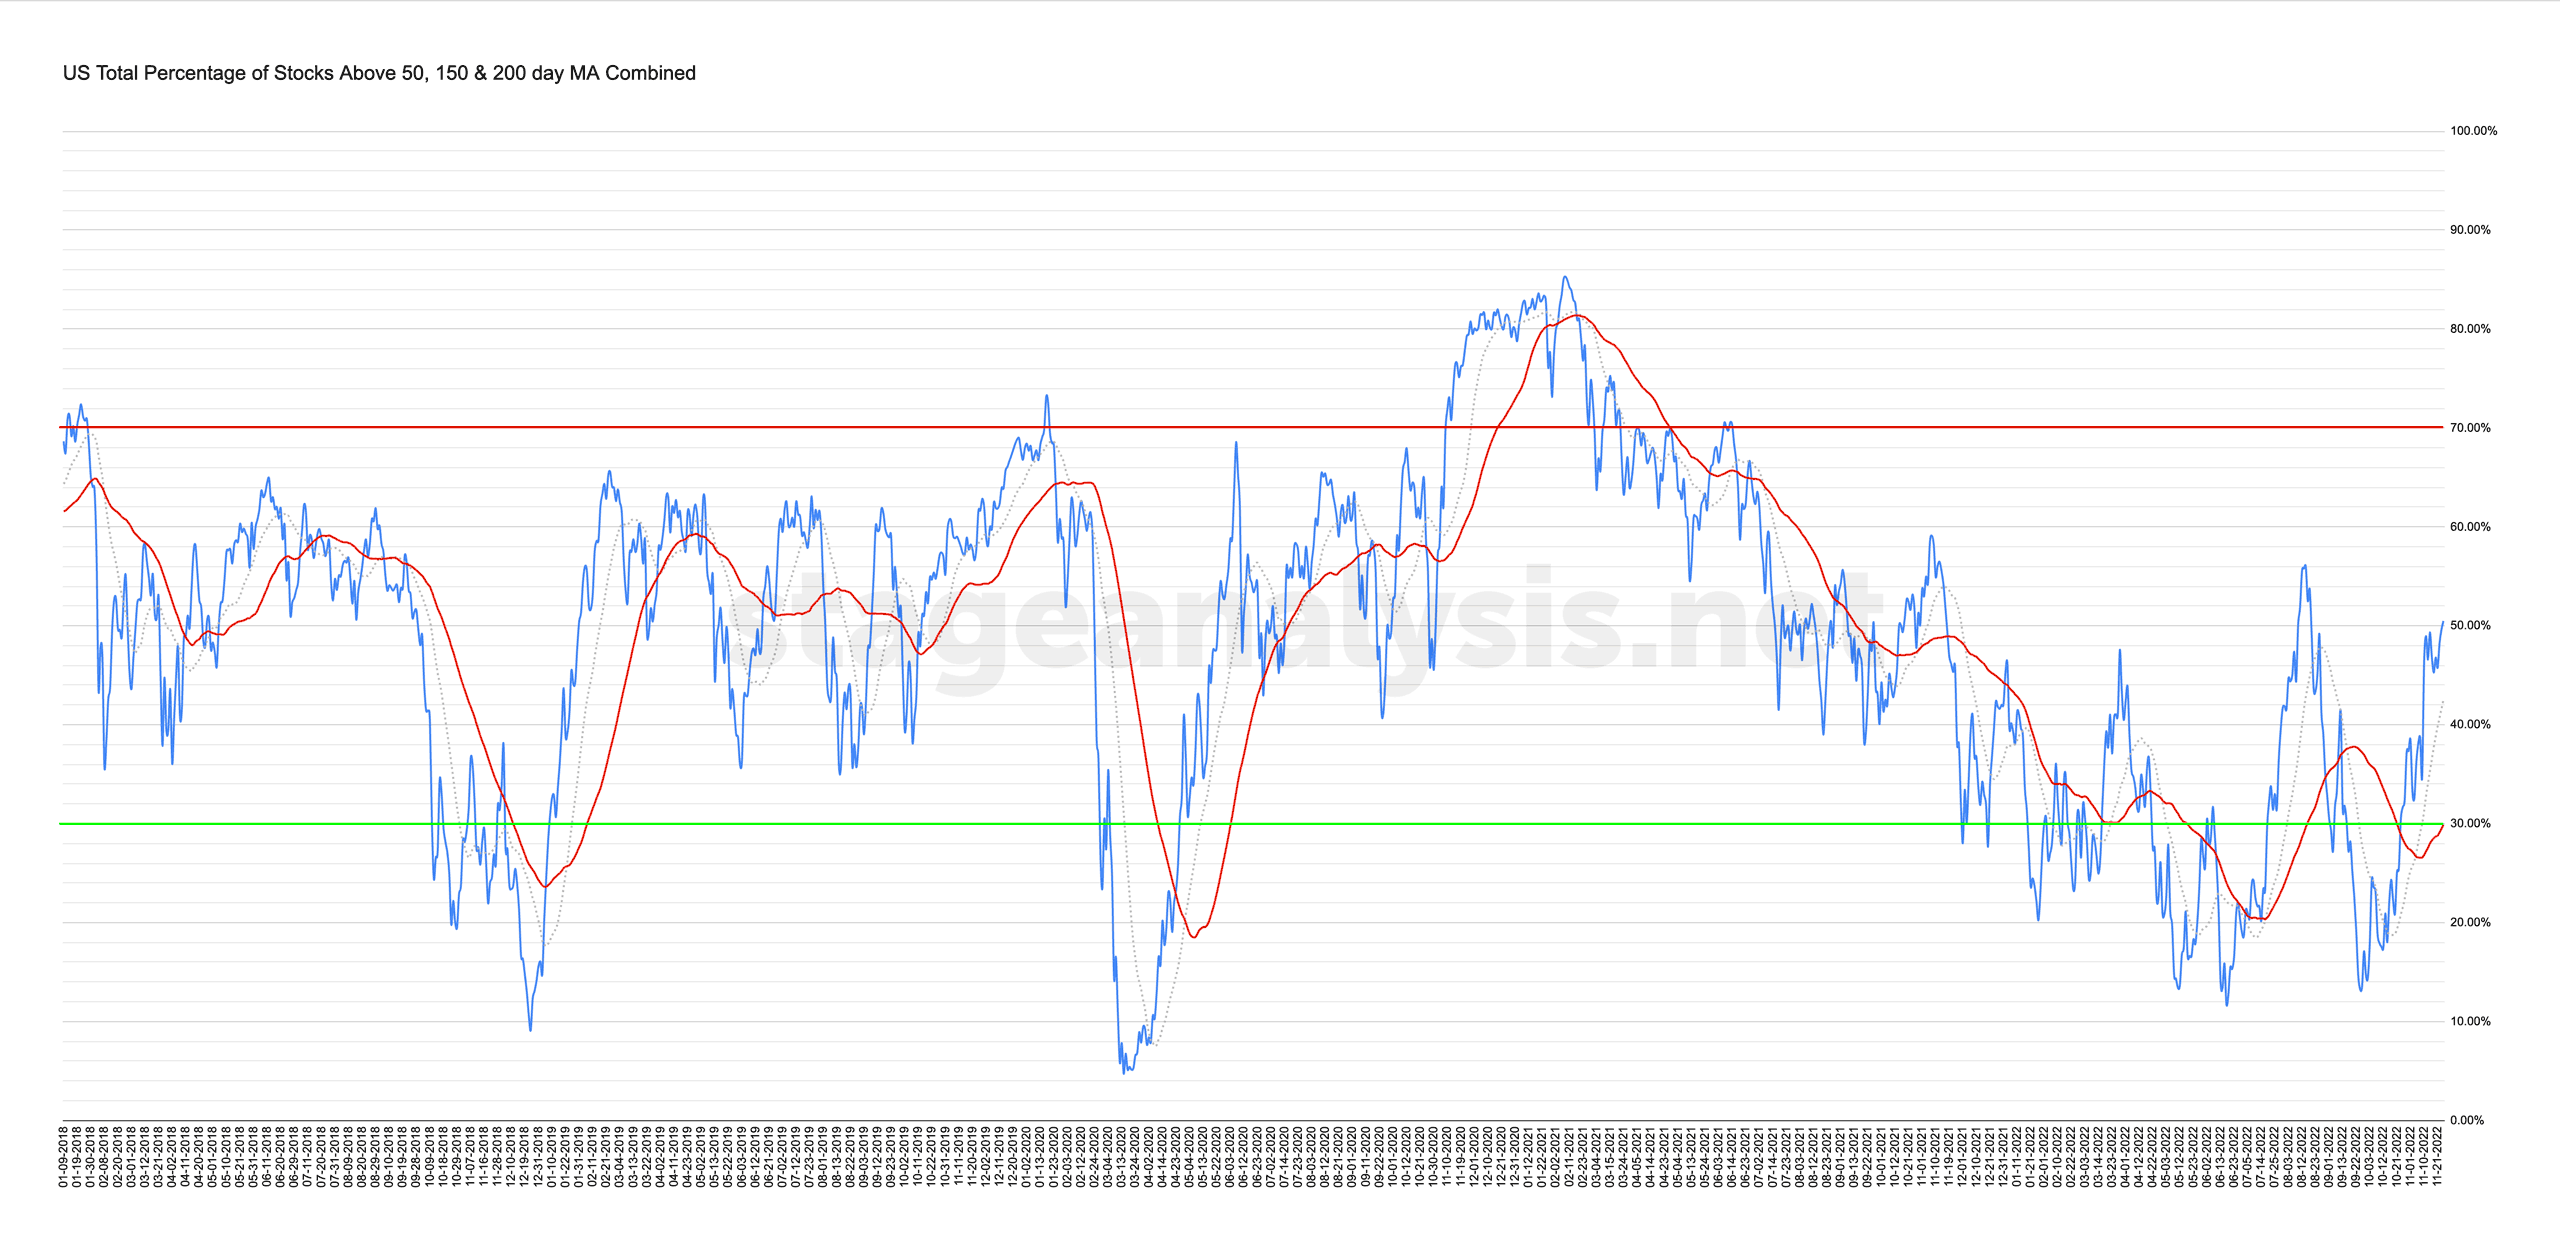
Market Breadth: Percentage of Stocks Above their 50 Day, 150 Day & 200 Day Moving Averages Combined
Custom Percentage of Stocks Above Their 50 Day, 150 Day & 200 Day Moving Averages Combined Market Breadth Charts for the Overall US Market, NYSE and Nasdaq for Market Timing and Strategy.
Read More
25 November, 2022
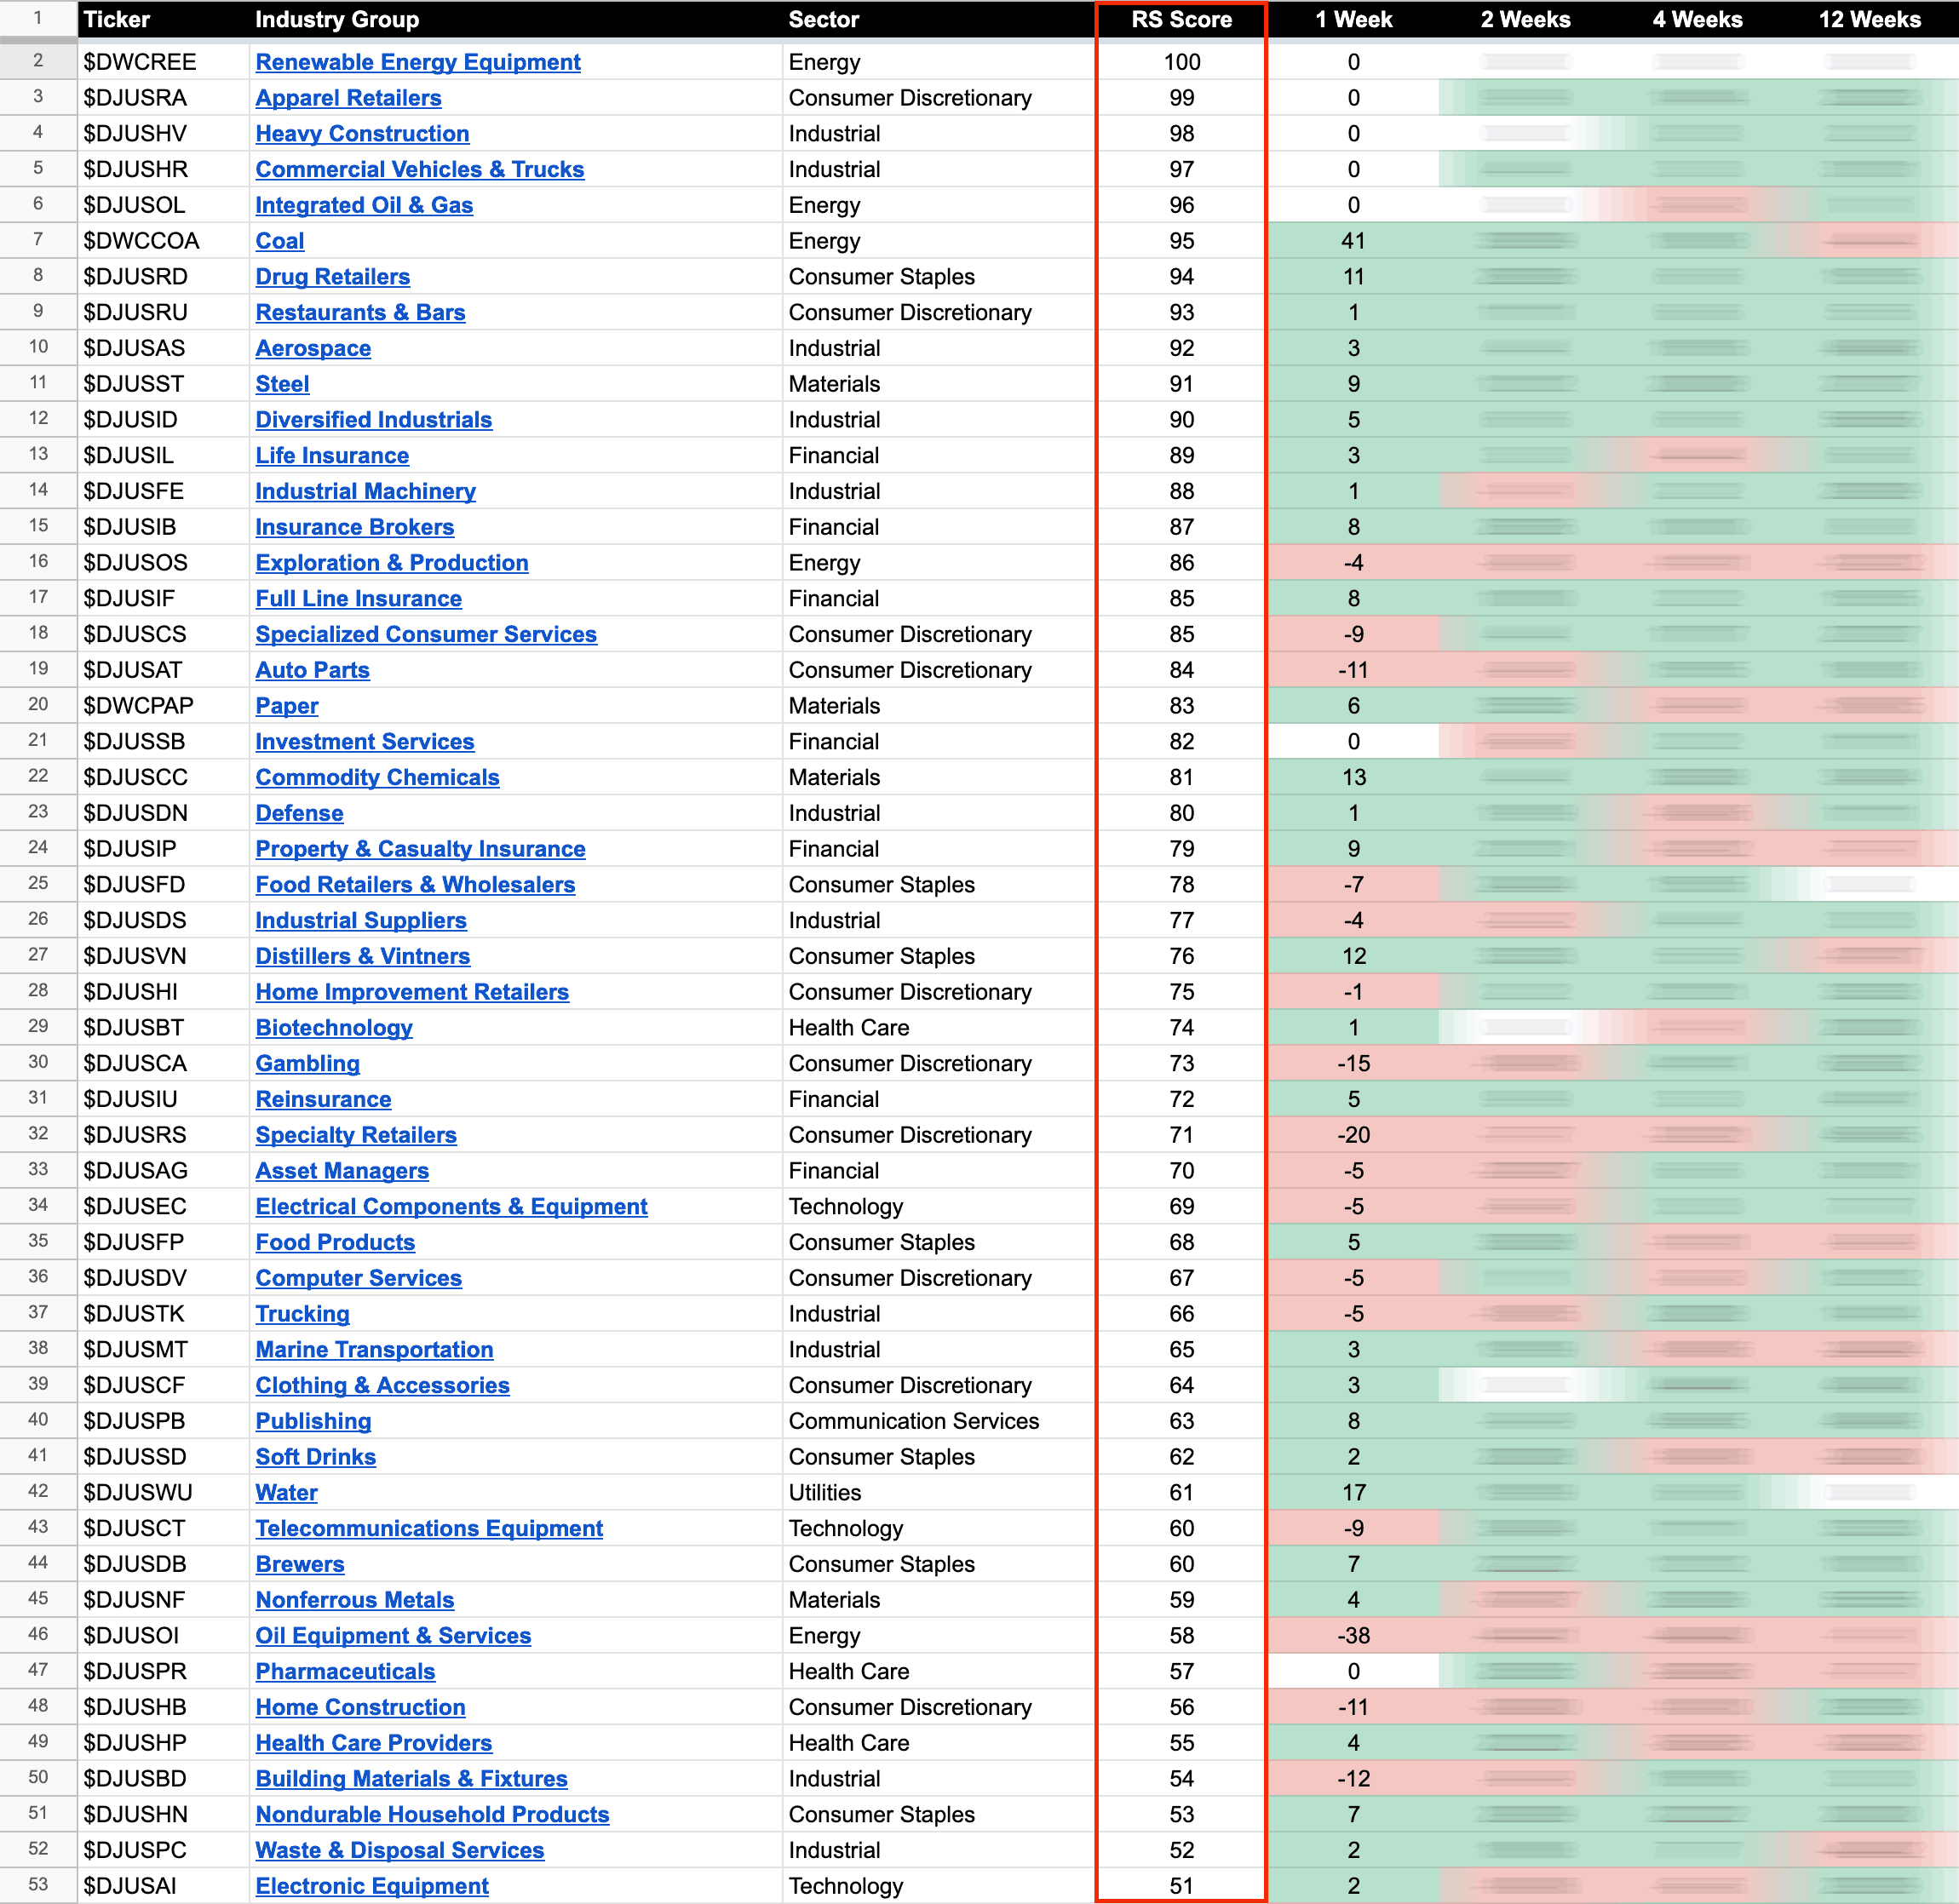
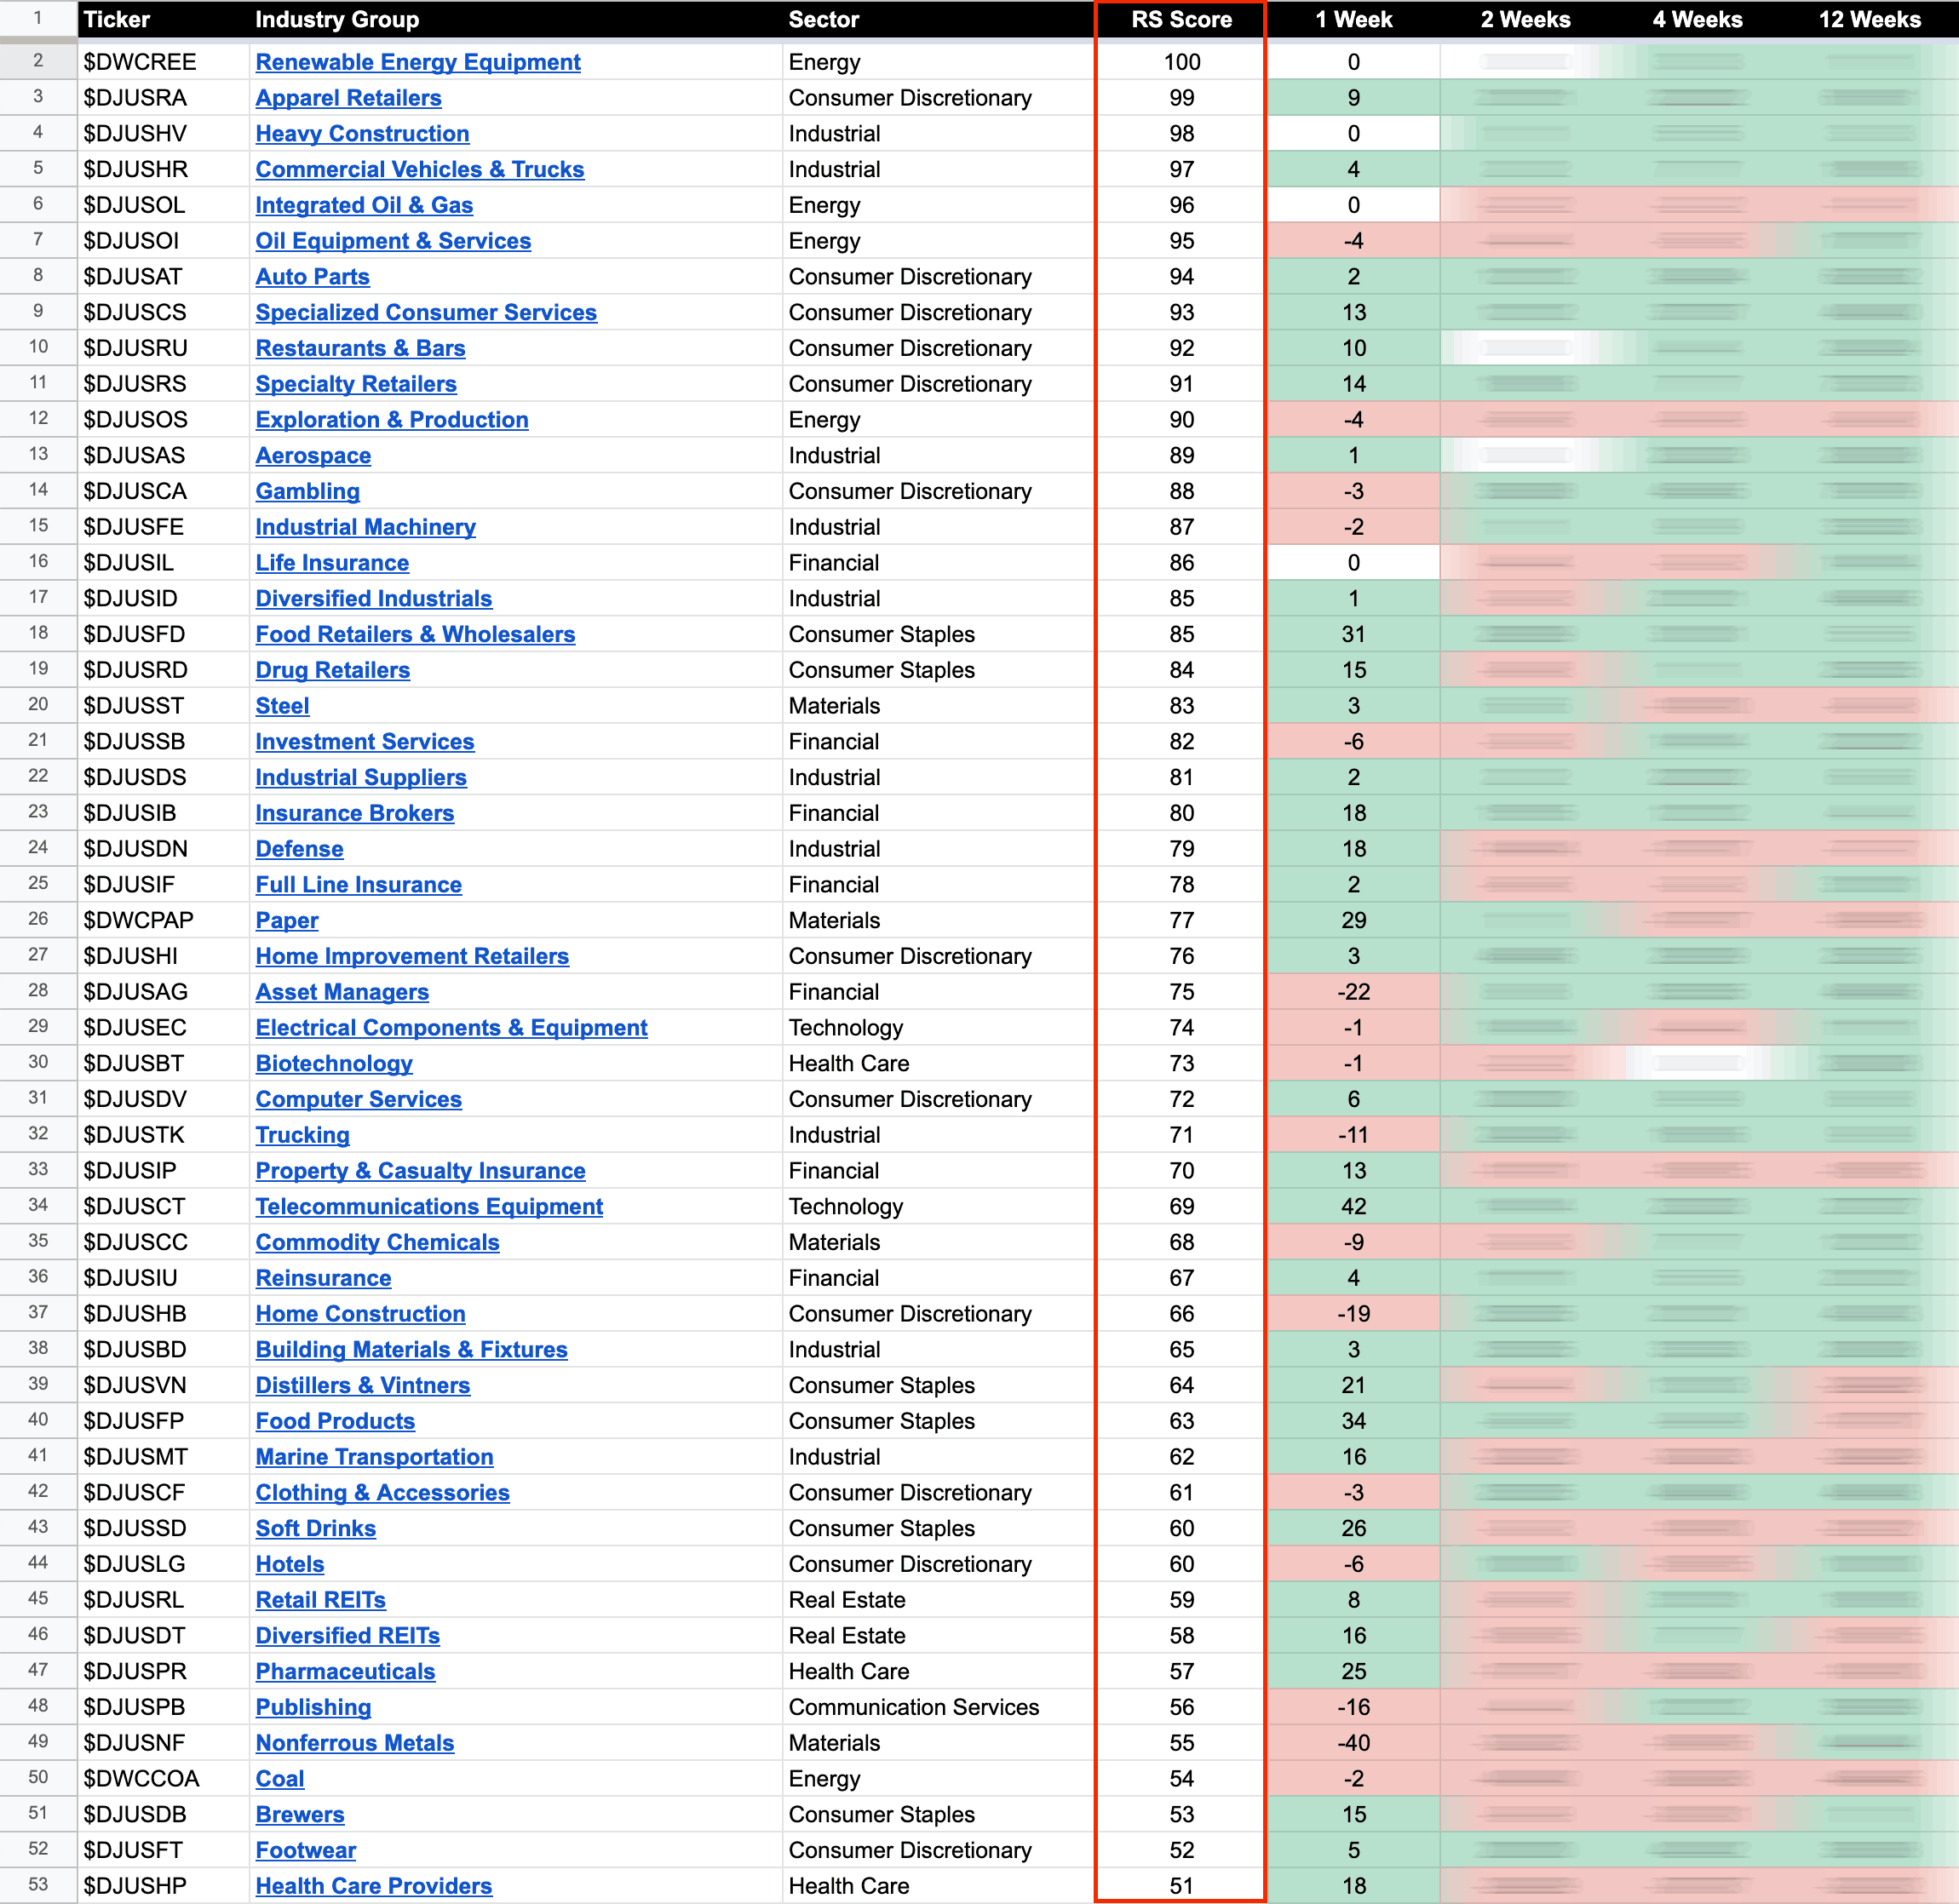
US Stocks Industry Groups Relative Strength Rankings
The purpose of the Relative Strength (RS) tables is to track the short, medium and long term RS changes of the individual groups to find the new leadership earlier than the crowd...
Read More
22 November, 2022
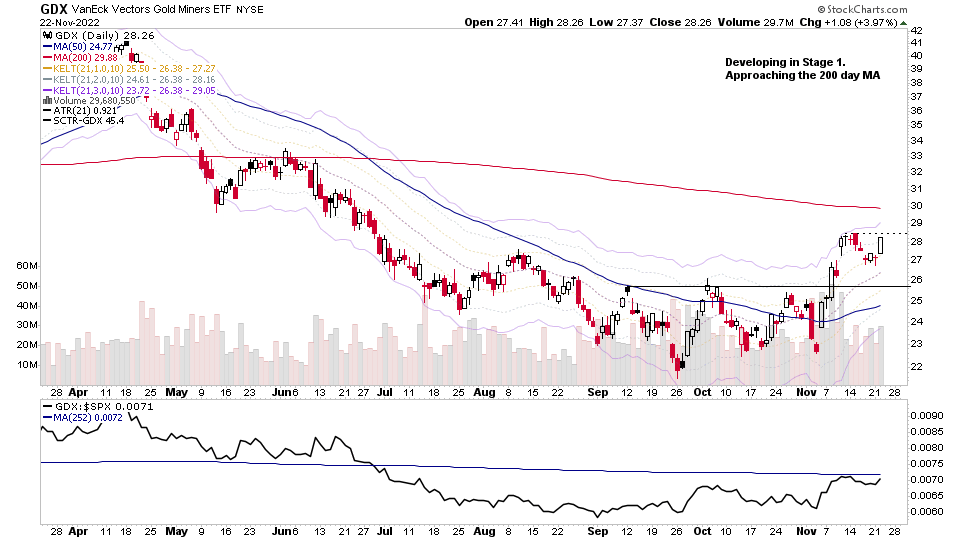
Gold & Silver Miners Developing in Stage 1 and the US Stocks Watchlist – 22 November 2022
The Gold and Silver Miners continue to improve in potential Stage 1 base structures as the US Dollar Index struggles to regain its 30 week MA, after the dramatic collapse into early Stage 3 three weeks ago, which boosted the precious metals, that the majority of the time move inversely to the Dollar Index...
Read More
20 November, 2022
Stage Analysis Members Video – 20 November 2022 (1hr 32mins)
The members weekend video discussing the market indexes, industry groups relative strength, IBD industry group bell curve – bullish percent, market breadth charts to determine the weight of evidence, Stage 2 breakout attempts in multiple stocks and the US watchlist stocks in more detail.
Read More
20 November, 2022
US Stocks Watchlist – 20 November 2022
For the watchlist from the weekend scans...
Read More
19 November, 2022
IBD Industry Groups Bell Curve – Bullish Percent
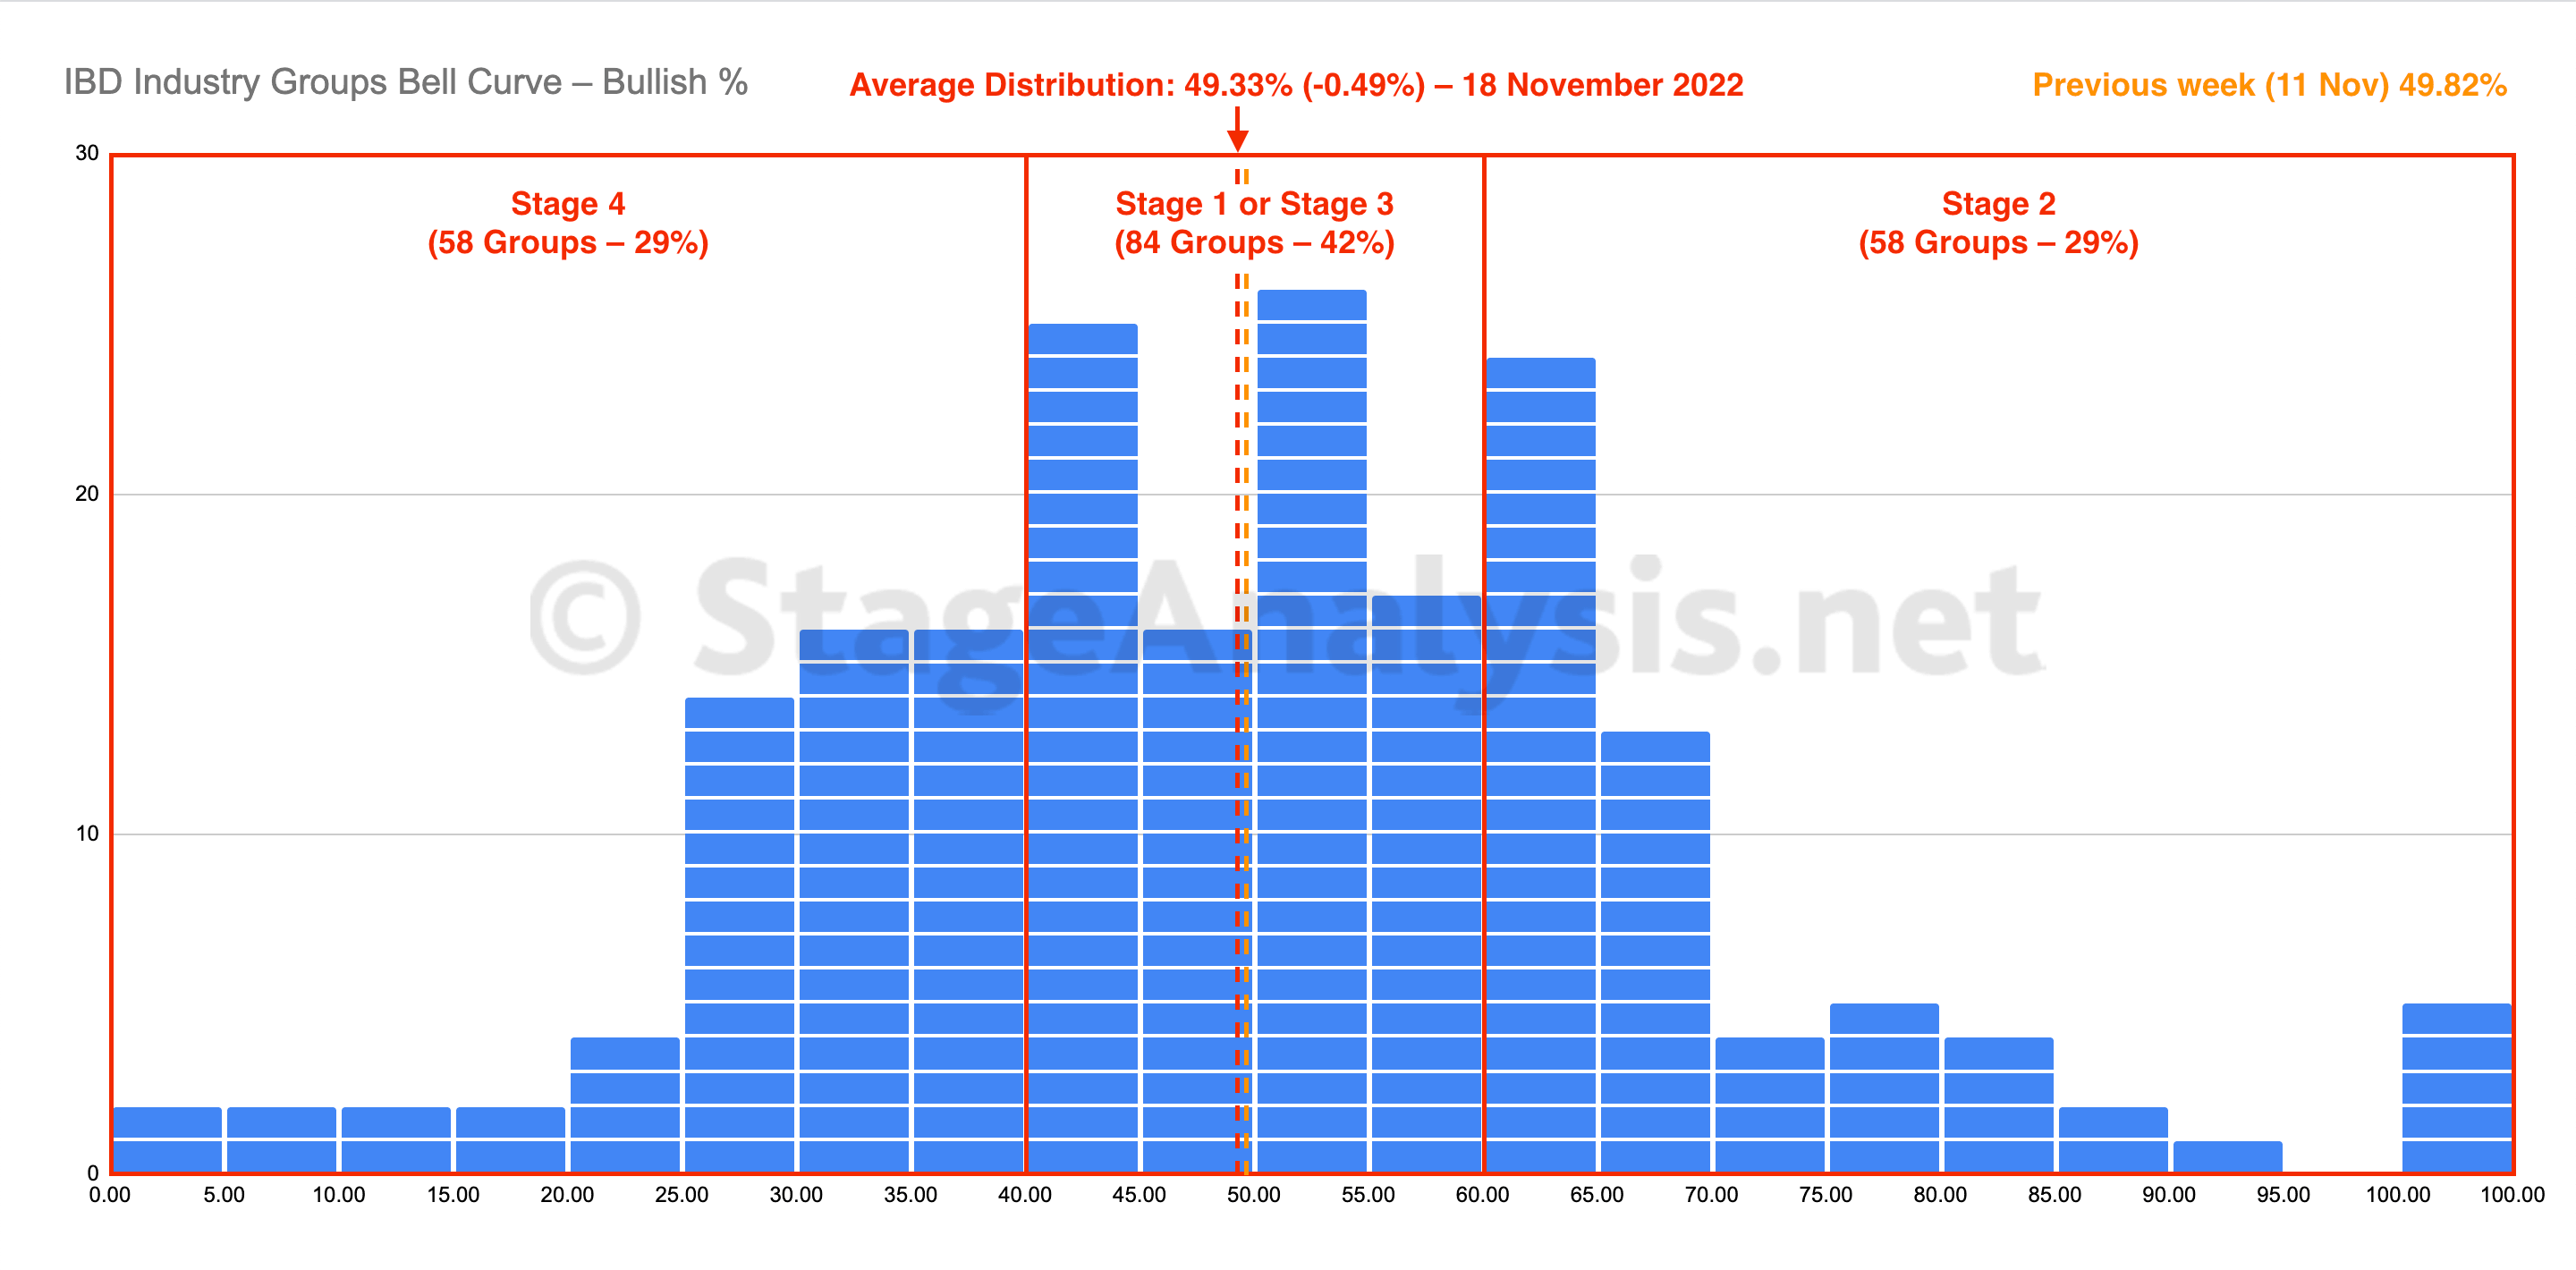
The IBD Industry Groups Bell Curve consolidated this week, with a slight decline of -0.49%, to end the week at 49.33%. So it remains firmly in the middle of the range, with the majority of groups in the Stage 1 zone.
Read More
19 November, 2022
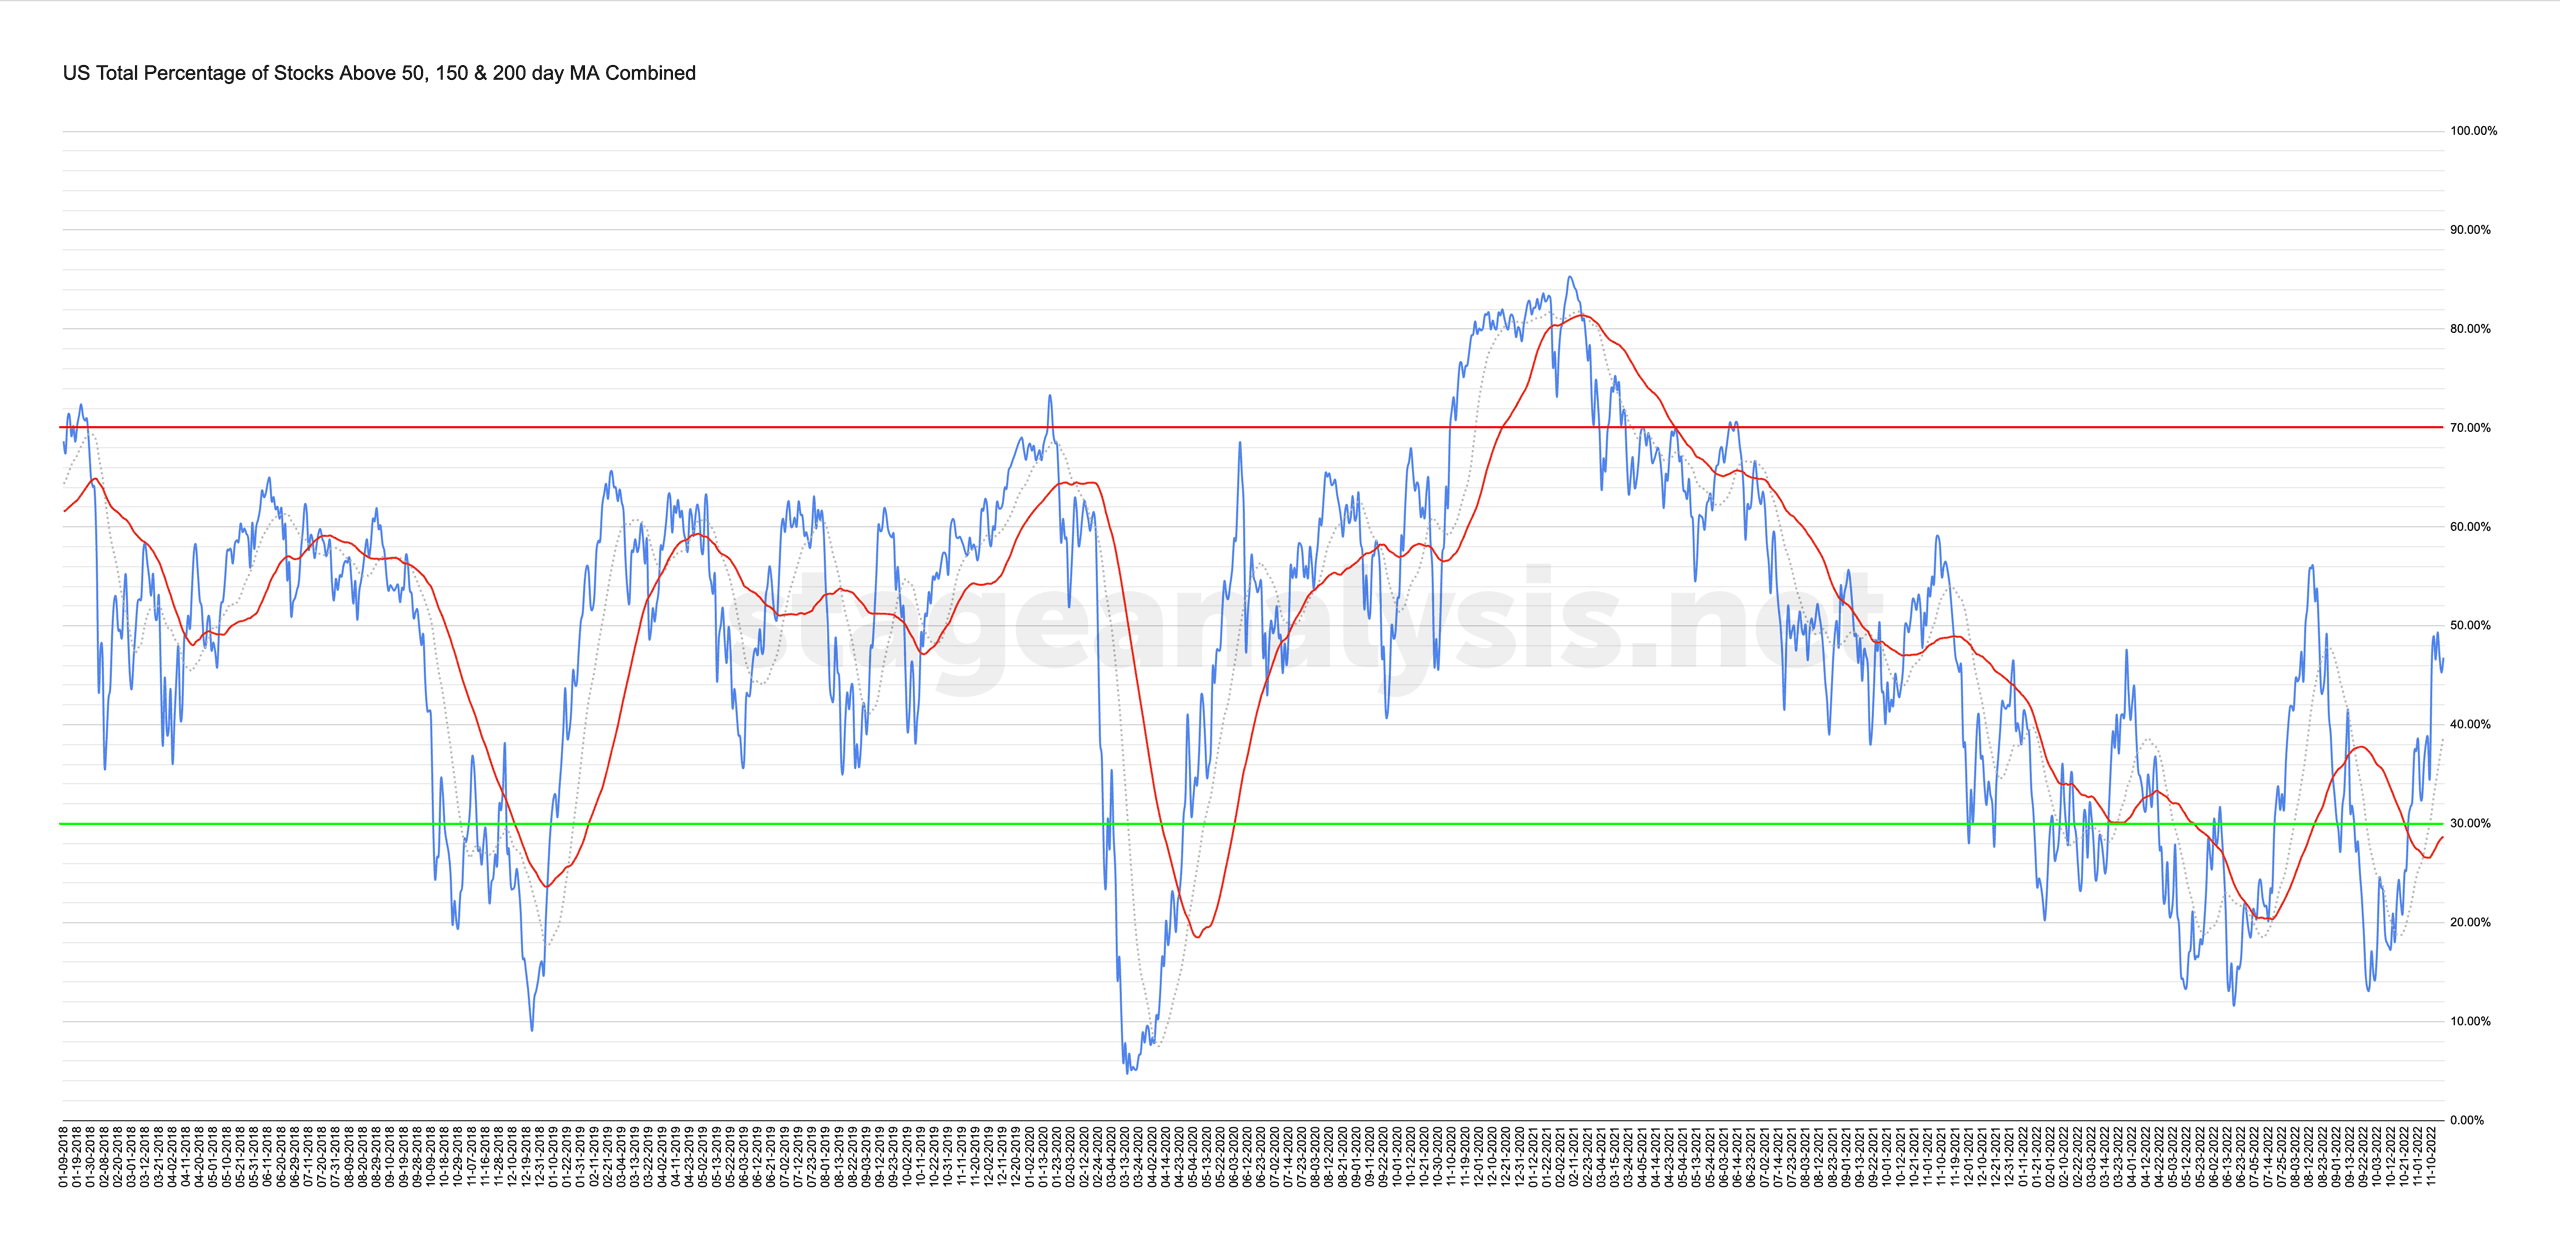
Market Breadth: Percentage of Stocks Above their 50 Day, 150 Day & 200 Day Moving Averages Combined
Custom Percentage of Stocks Above Their 50 Day, 150 Day & 200 Day Moving Averages Combined Market Breadth Charts for the Overall US Market, NYSE and Nasdaq for Market Timing and Strategy.
Read More
18 November, 2022
US Stocks Industry Groups Relative Strength Rankings
The purpose of the Relative Strength (RS) tables is to track the short, medium and long term RS changes of the individual groups to find the new leadership earlier than the crowd...
Read More
17 November, 2022
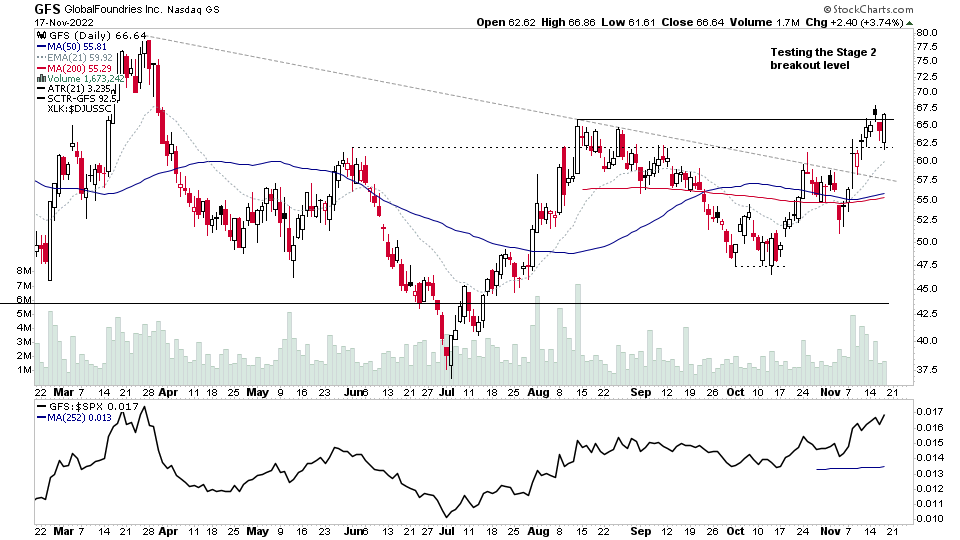
US Stocks Watchlist – 17 November 2022
There were 42 stocks highlighted in the US stocks watchlist scans today...
Read More

