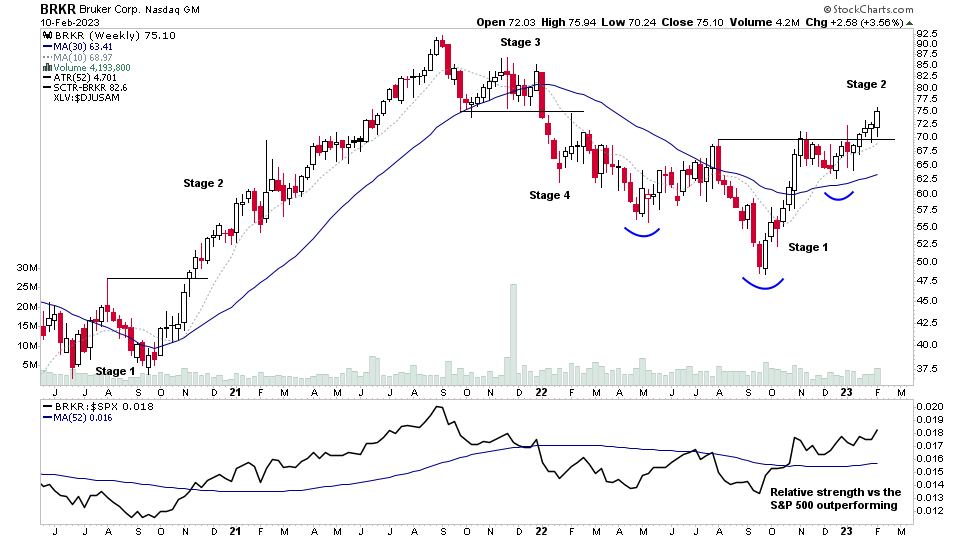
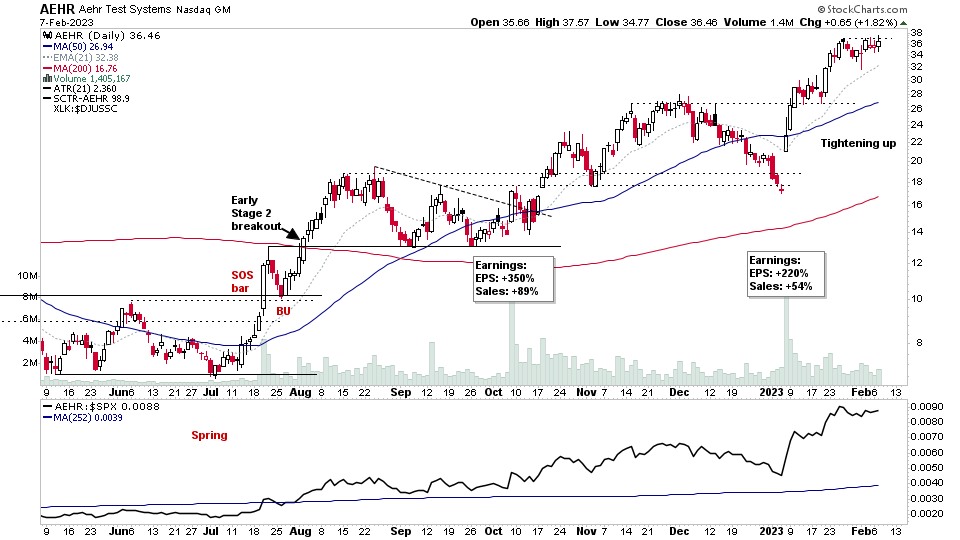
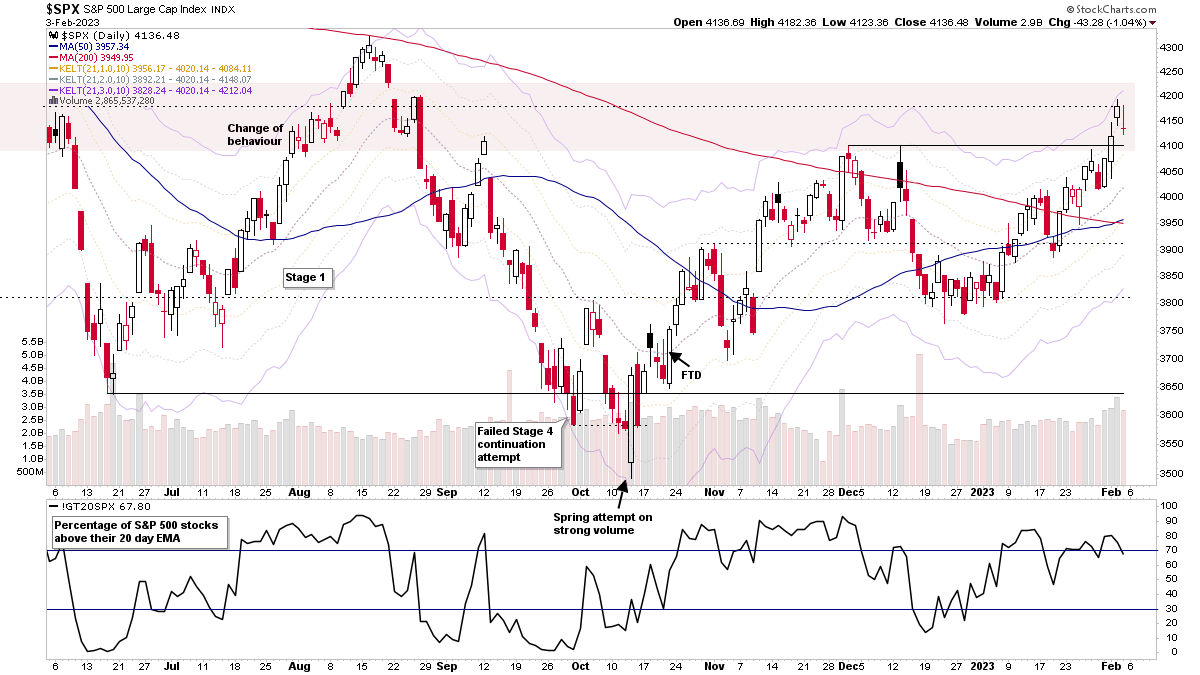
The Stage Analysis members weekend video featuring the regular content with the major US Indexes, the futures charts, US Industry Groups RS Rankings, IBD Industry Groups Bell Curve - Bullish Percent, the Market Breadth Update to help to determine the Weight of Evidence and finishing with the US Stocks Watchlist in detail on multiple timeframes.
Read More
Blog
12 February, 2023
Stage Analysis Members Video – 12 February 2023 (1hr)
12 February, 2023
Home Construction Group Focus Video – 12 February 2023 (13mins)
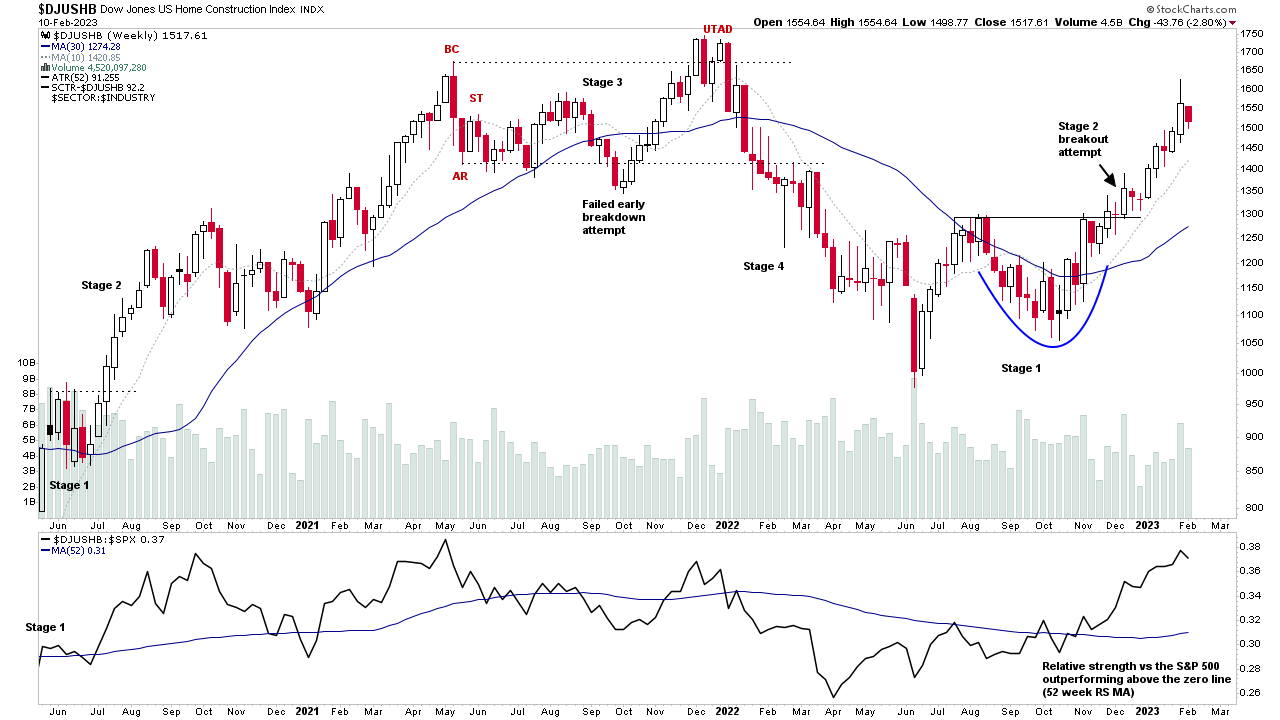
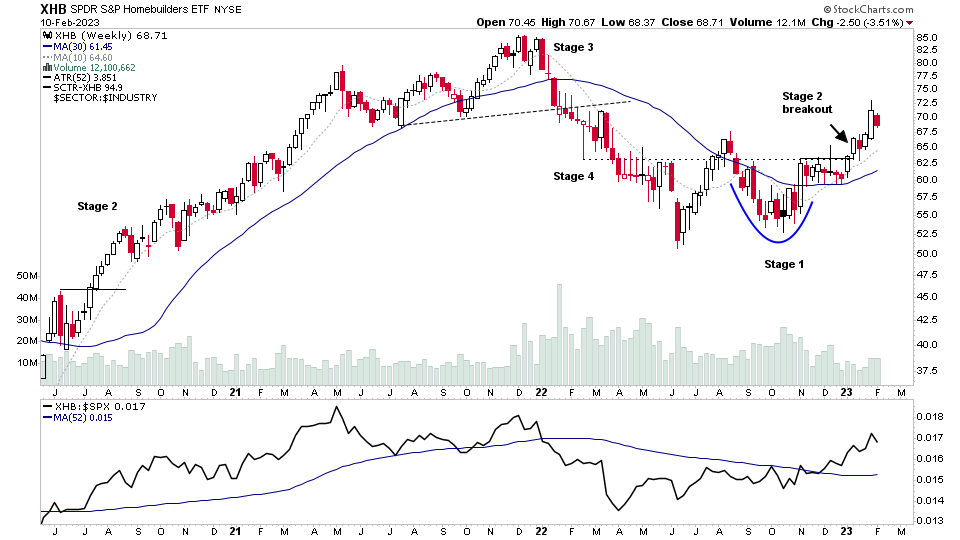
Special feature focusing on the Home Construction group, which has been in Stage 2 for a few months and is in the top 10 of the industry group relative strength rankings.
Read More
12 February, 2023
US Stocks Watchlist – 12 February 2023
There were 44 stocks highlighted from the US stocks watchlist scans today. Home Construction is coming back into focus with multiple stocks in the group starting to report earnings in the coming week(s)...
Read More
11 February, 2023
IBD Industry Groups Bell Curve – Bullish Percent
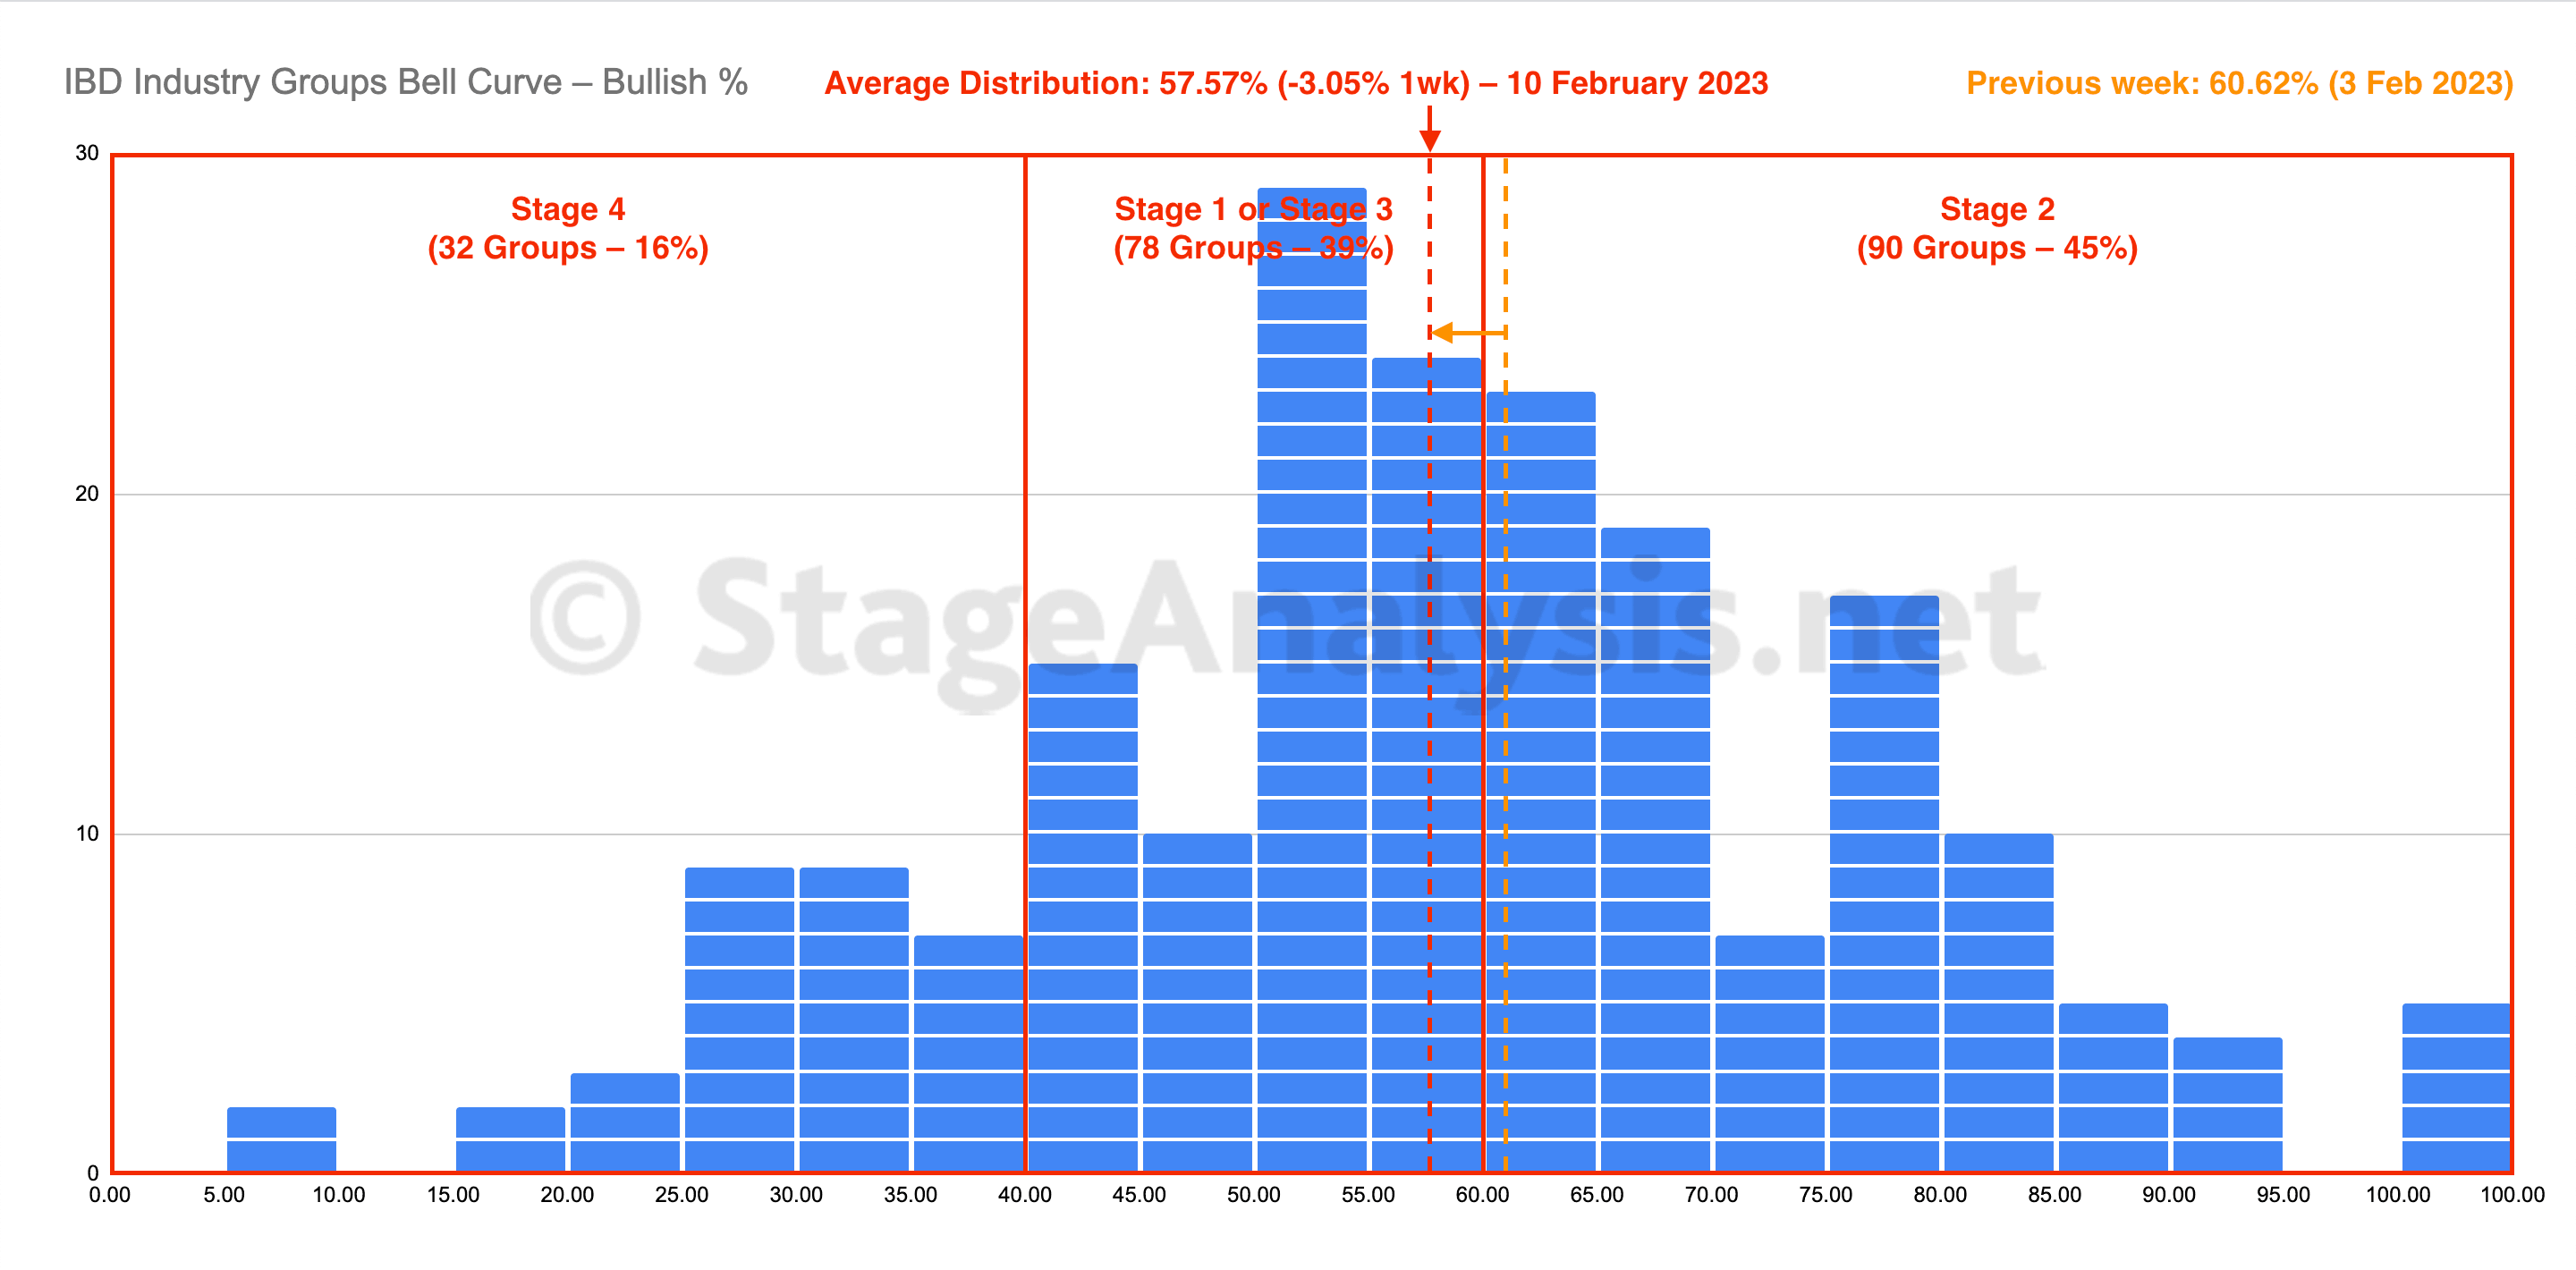
The IBD Industry Groups Bell Curve contracted by -3.05% this week, to close at 57.57% overall. The amount of groups in Stage 4 increased by +8 (+4%), and the amount of groups in Stage 2 decreased by -14 (-7%), while the amount groups in Stage 1 or Stage 3 increased by +6 (+3%).
Read More
10 February, 2023
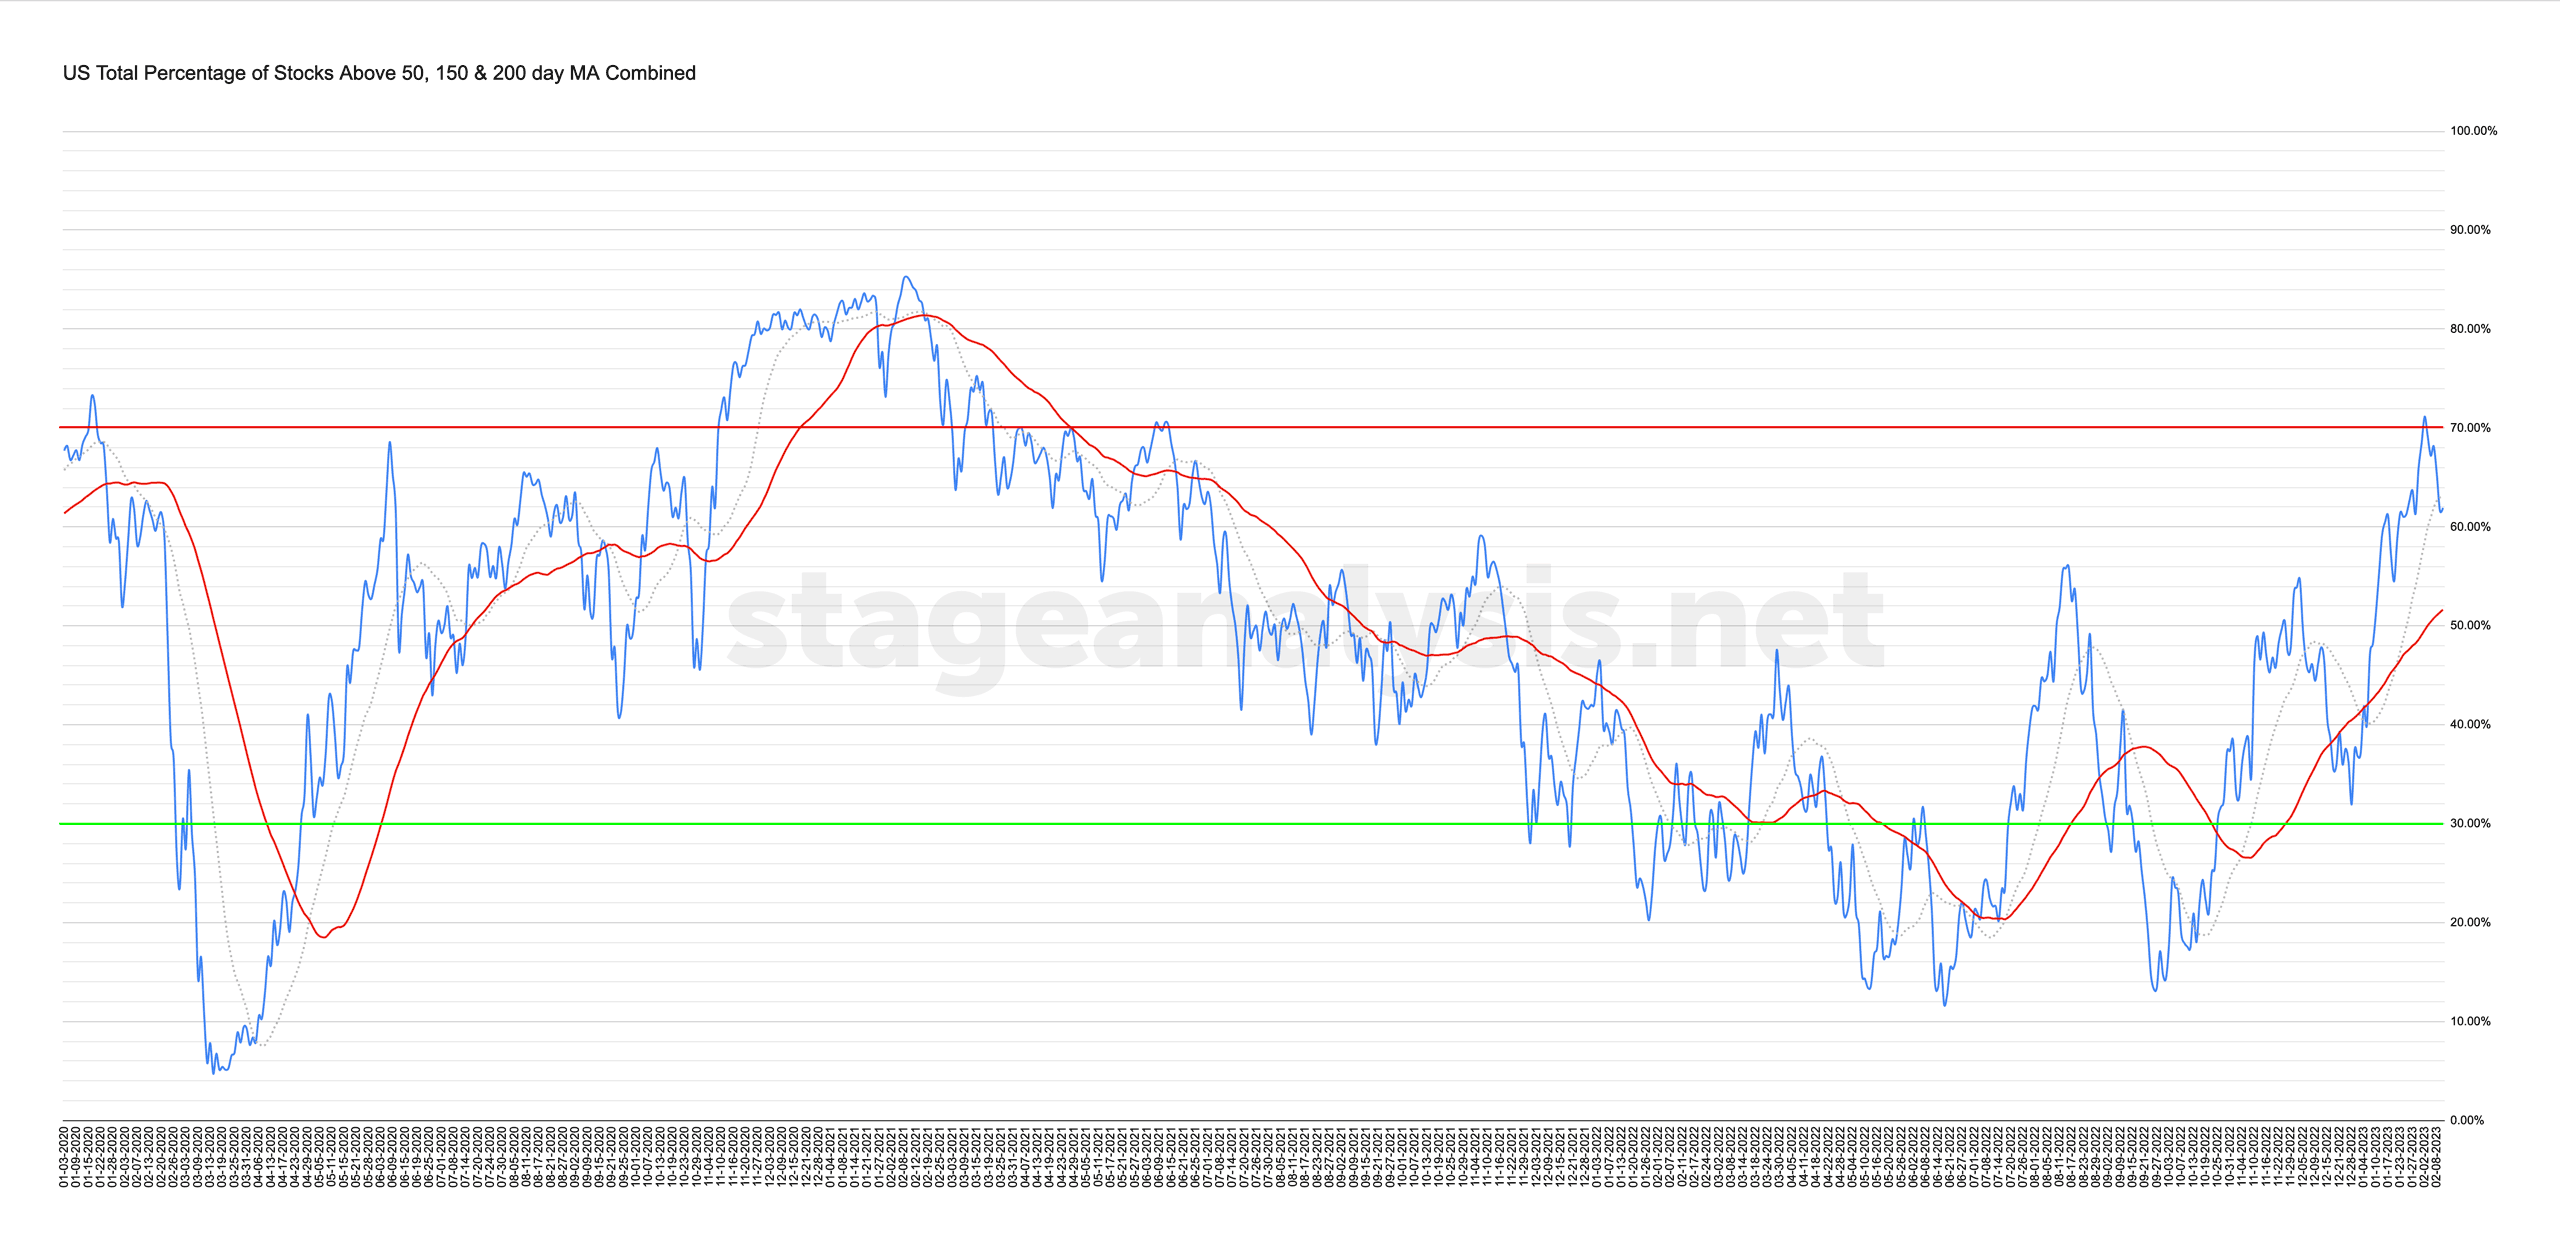
Market Breadth: Percentage of Stocks Above their 50 Day, 150 Day & 200 Day Moving Averages Combined
Custom Percentage of Stocks Above Their 50 Day, 150 Day & 200 Day Moving Averages Combined Market Breadth Charts for the Overall US Market, NYSE and Nasdaq for Market Timing and Strategy.
Read More
10 February, 2023
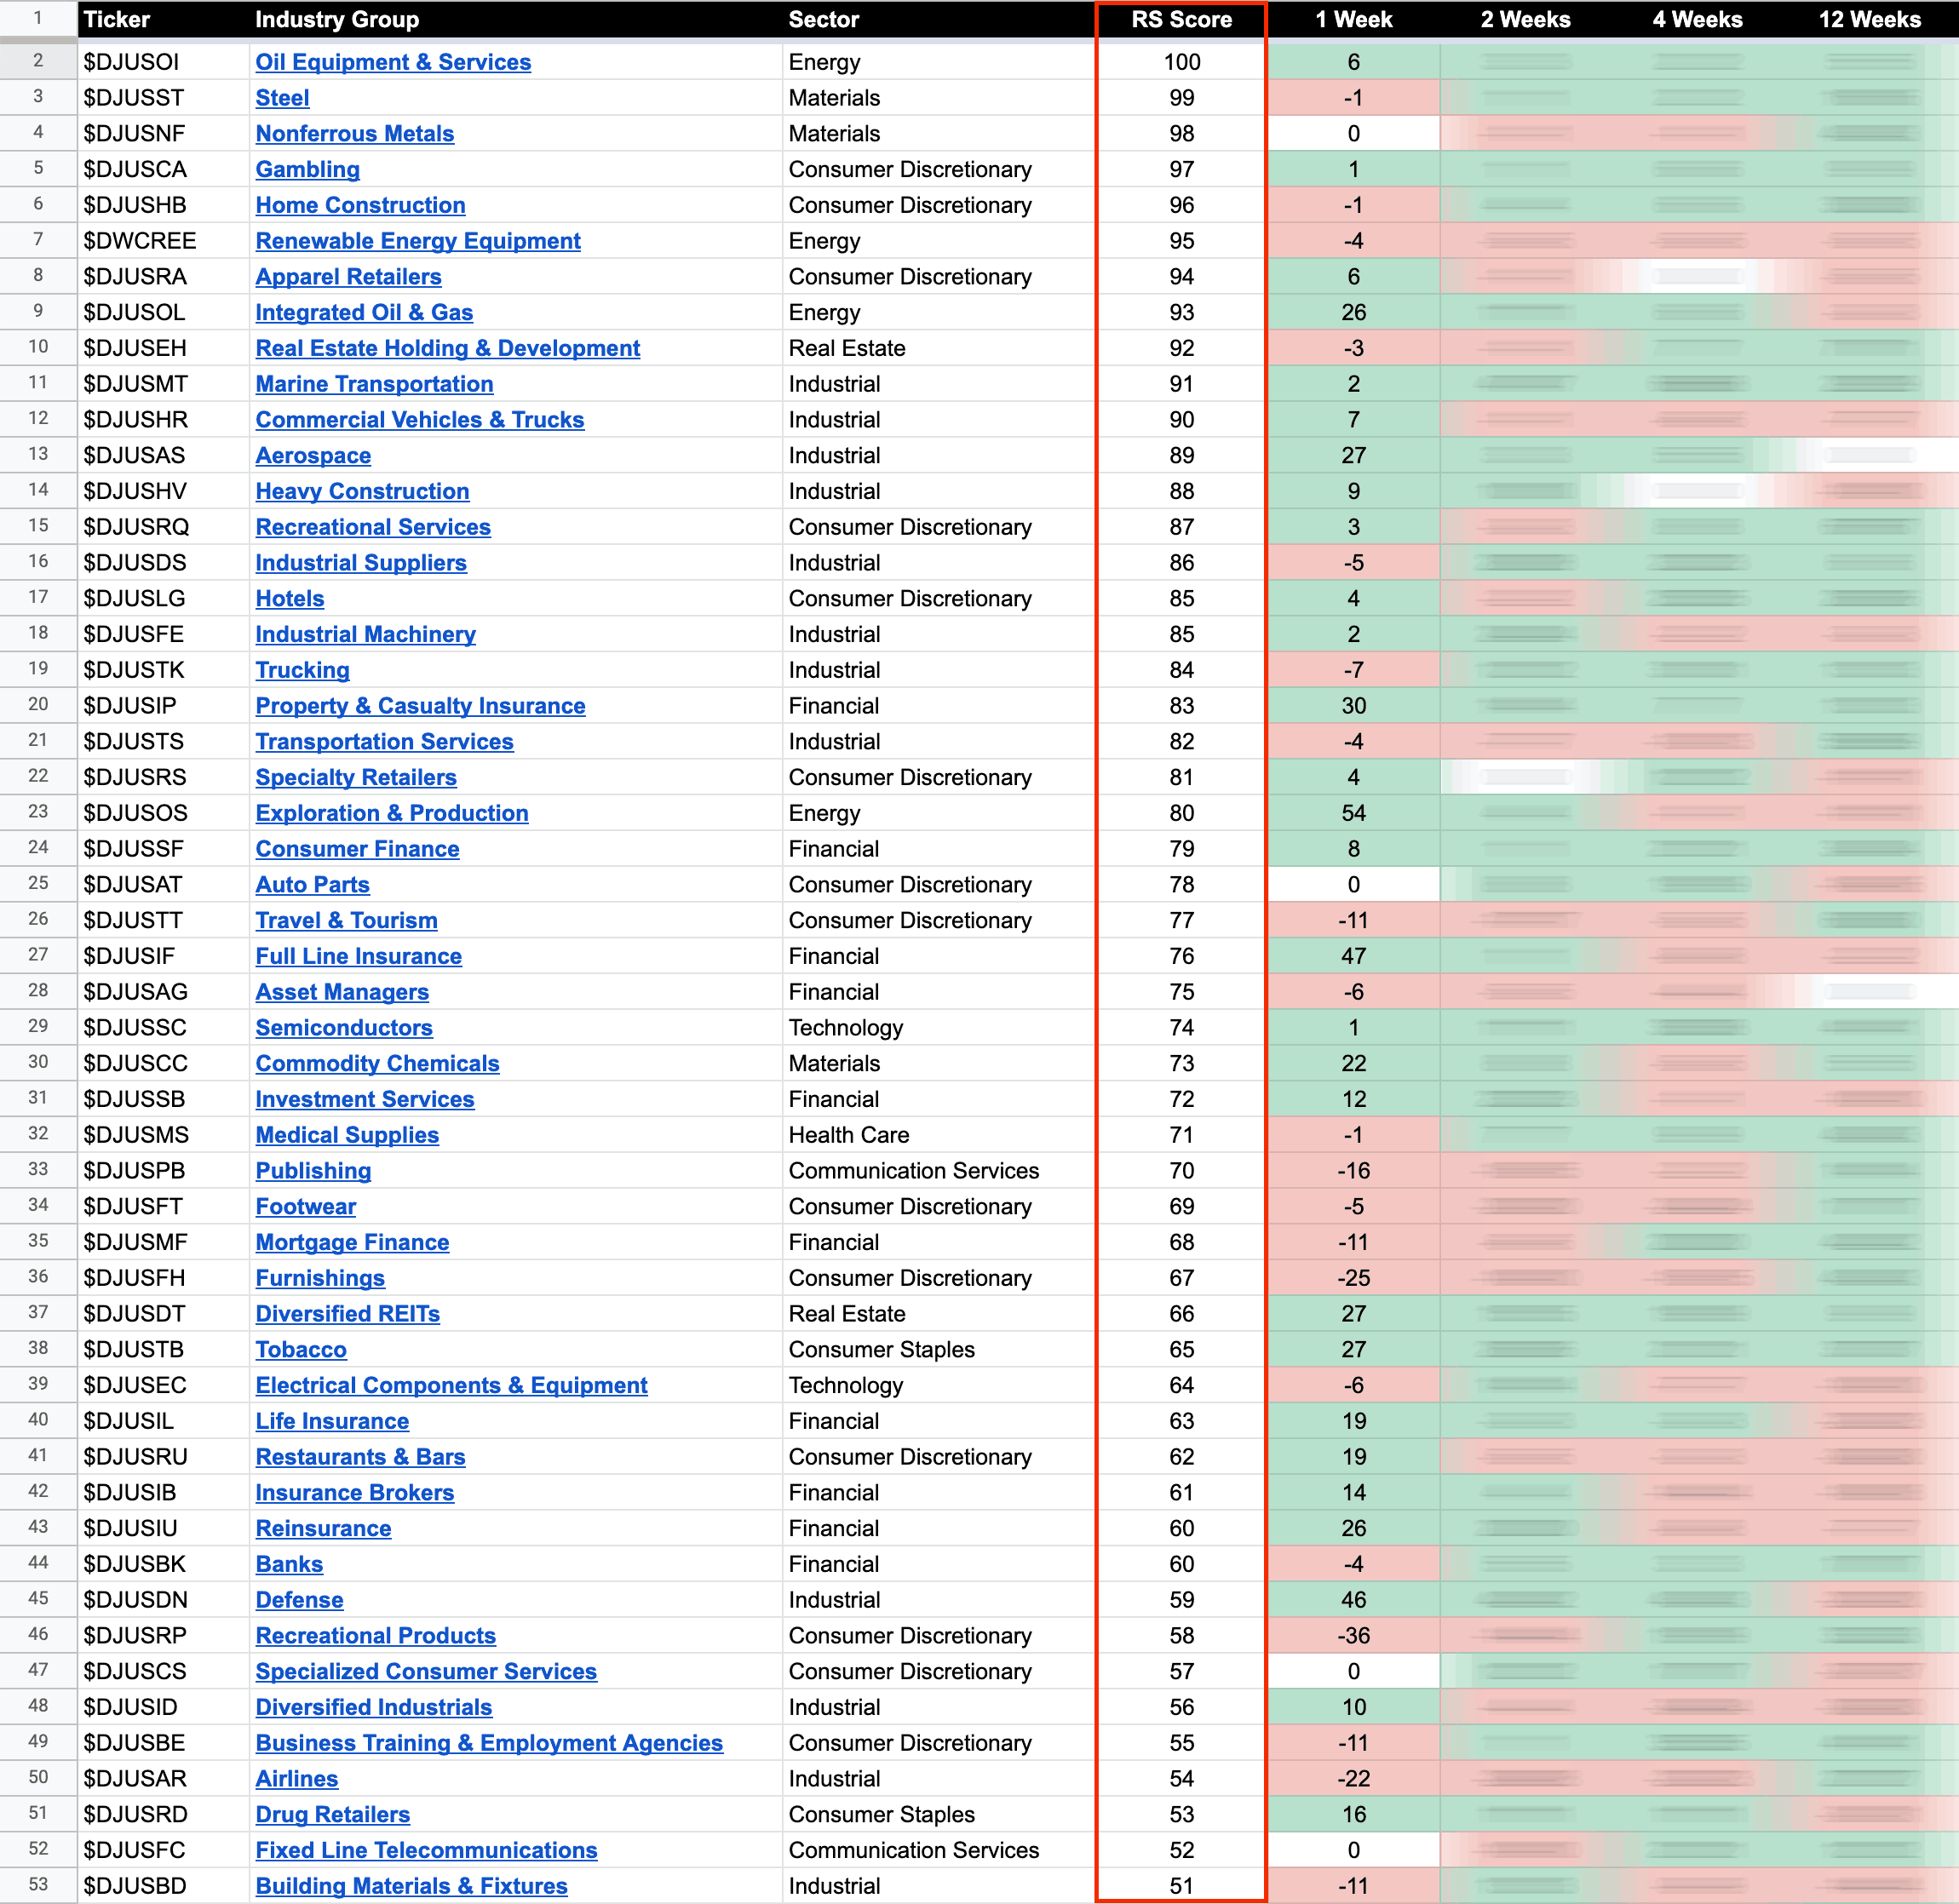
US Stocks Industry Groups Relative Strength Rankings
The purpose of the Relative Strength (RS) tables is to track the short, medium and long term RS changes of the individual groups to find the new leadership earlier than the crowd...
Read More
09 February, 2023
US Stocks Watchlist – 9 February 2023
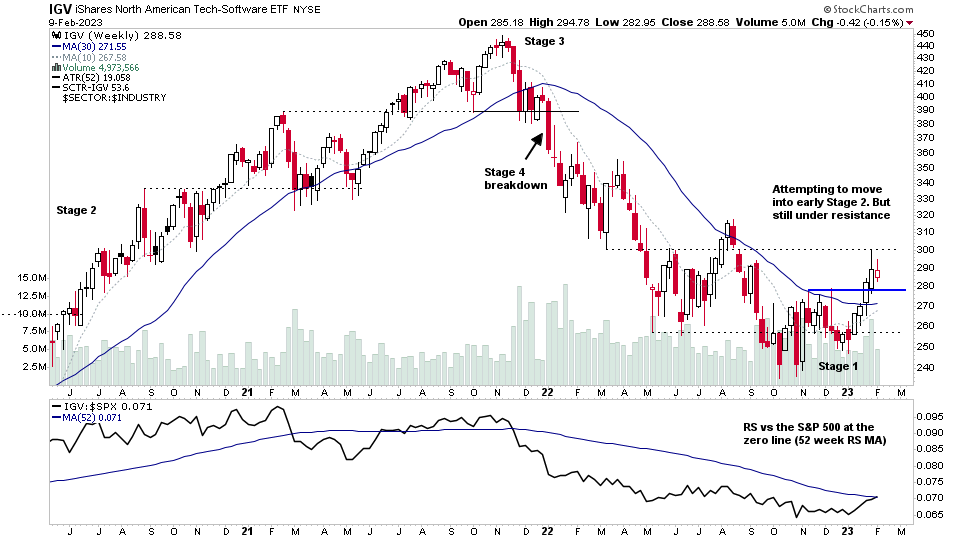
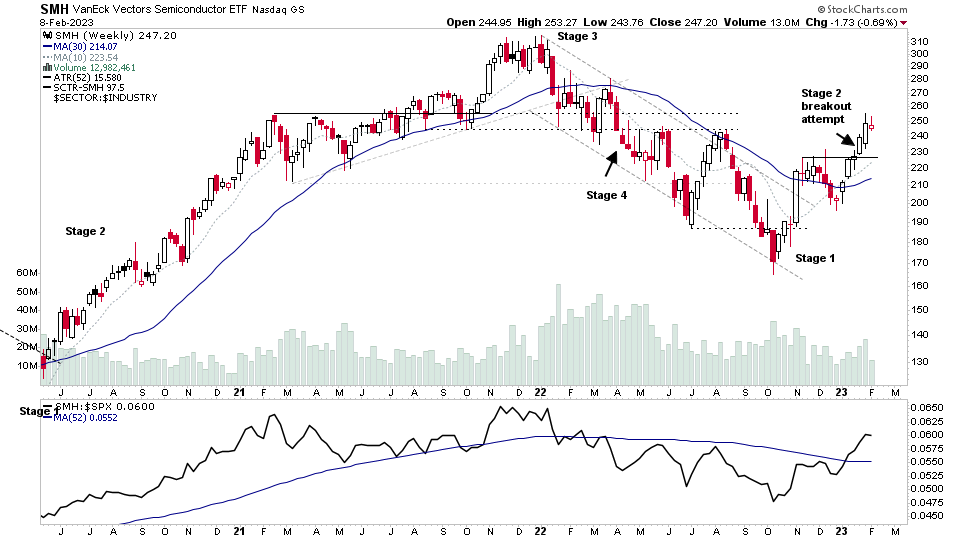
There were 36 stocks highlighted from the US stocks watchlist scans today. Semiconductors and Software continue to be dominate group themes in the short-term...
Read More
08 February, 2023
Semiconductors Group Focus Video – 8 February 2023 (33mins)
The Semiconductors group has featured heavily over the last few months. So the midweek video focuses on the group and some of the leading stocks within it.
Read More
08 February, 2023
US Stocks Watchlist – 7 February 2023
There were 44 stocks highlighted from the US stocks watchlist scans today...
Read More
05 February, 2023
Stage Analysis Members Video – 5 February 2023 (1hr 31mins)
The Stage Analysis members weekend video featuring the regular content with the major US Indexes, the futures charts, US Industry Groups RS Rankings, IBD Industry Groups Bell Curve - Bullish Percent, the Market Breadth Update to help to determine the Weight of Evidence and finishing with the US Stocks Watchlist in detail on multiple timeframes.
Read More

