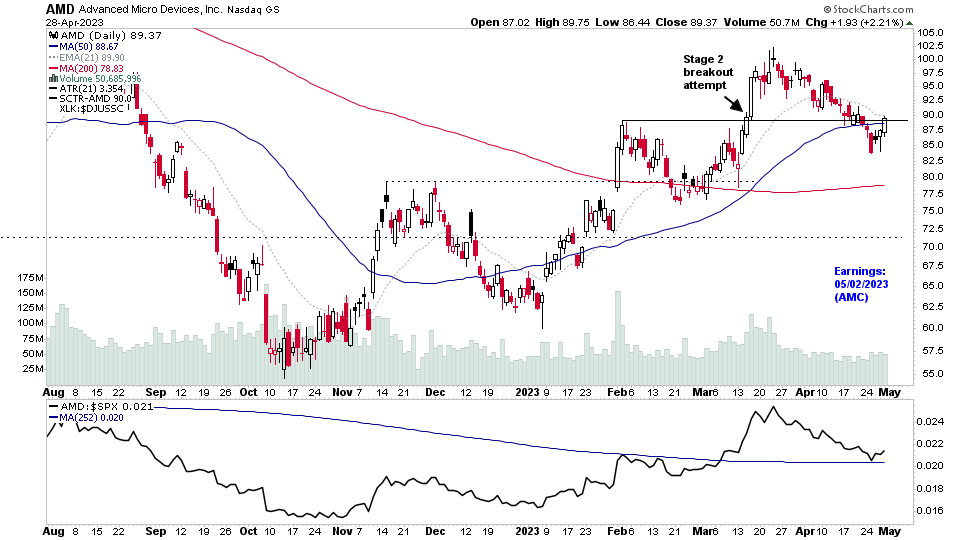
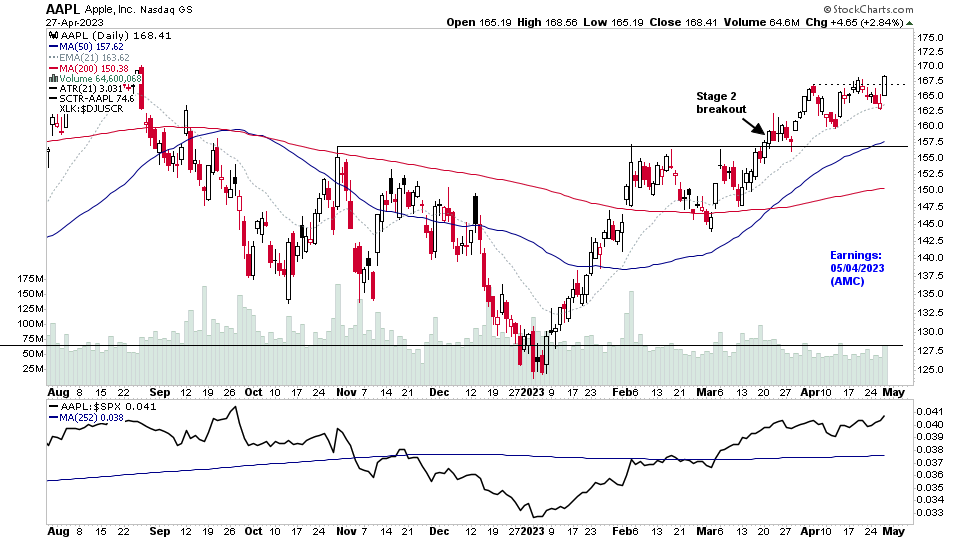
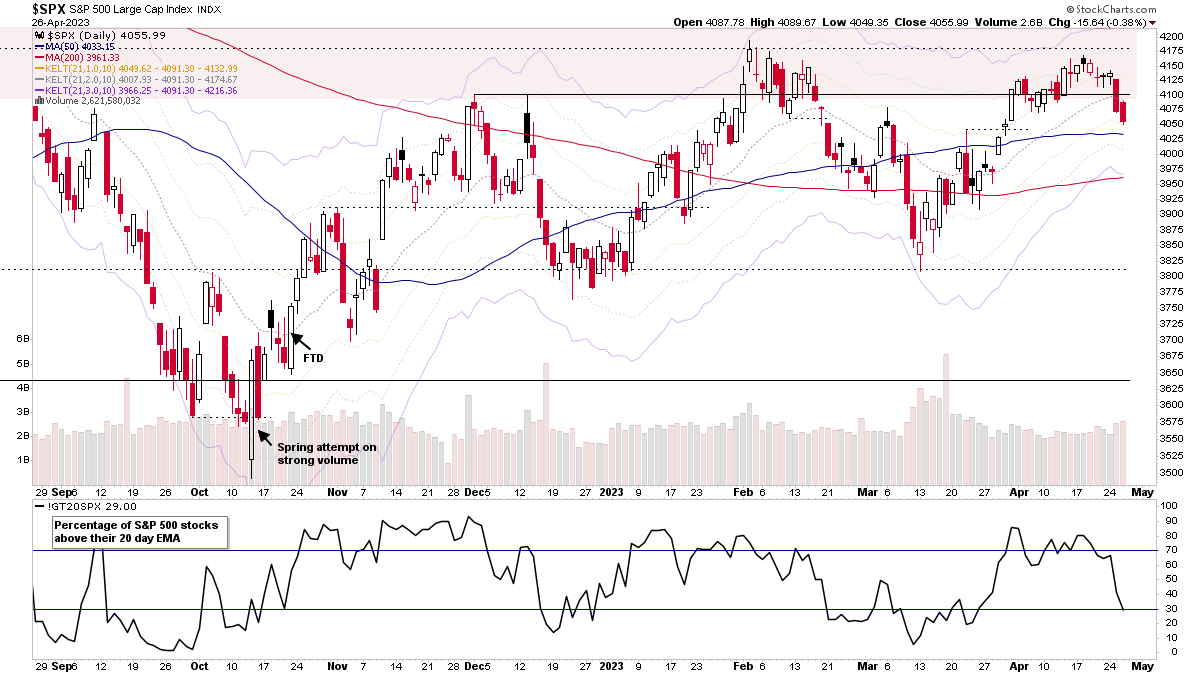
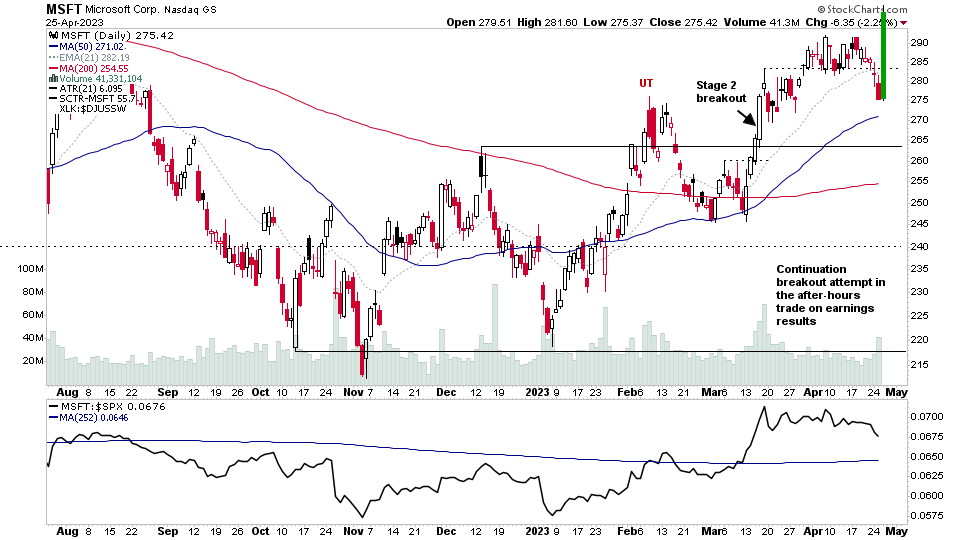
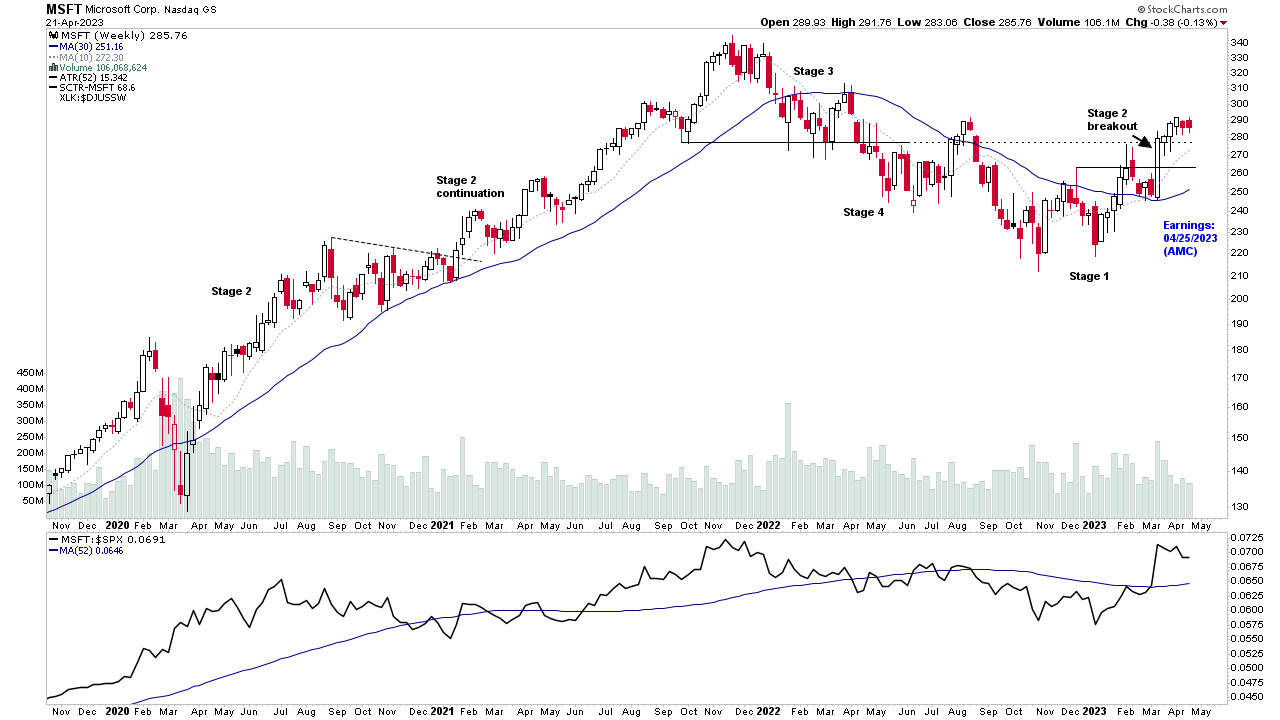
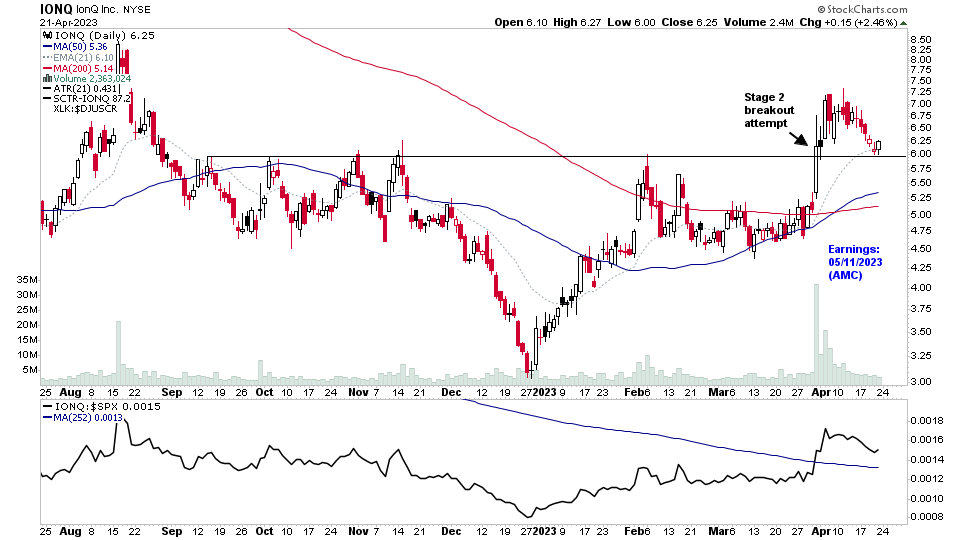
There were 20 stocks highlighted from the US stocks watchlist scans today. I'll discuss the watchlist stocks and group themes in detail in the members weekend video, which will posted later today (Sunday)...
Read More
Blog
30 April, 2023
US Stocks Watchlist – 30 April 2023
29 April, 2023
IBD Industry Groups Bell Curve – Bullish Percent
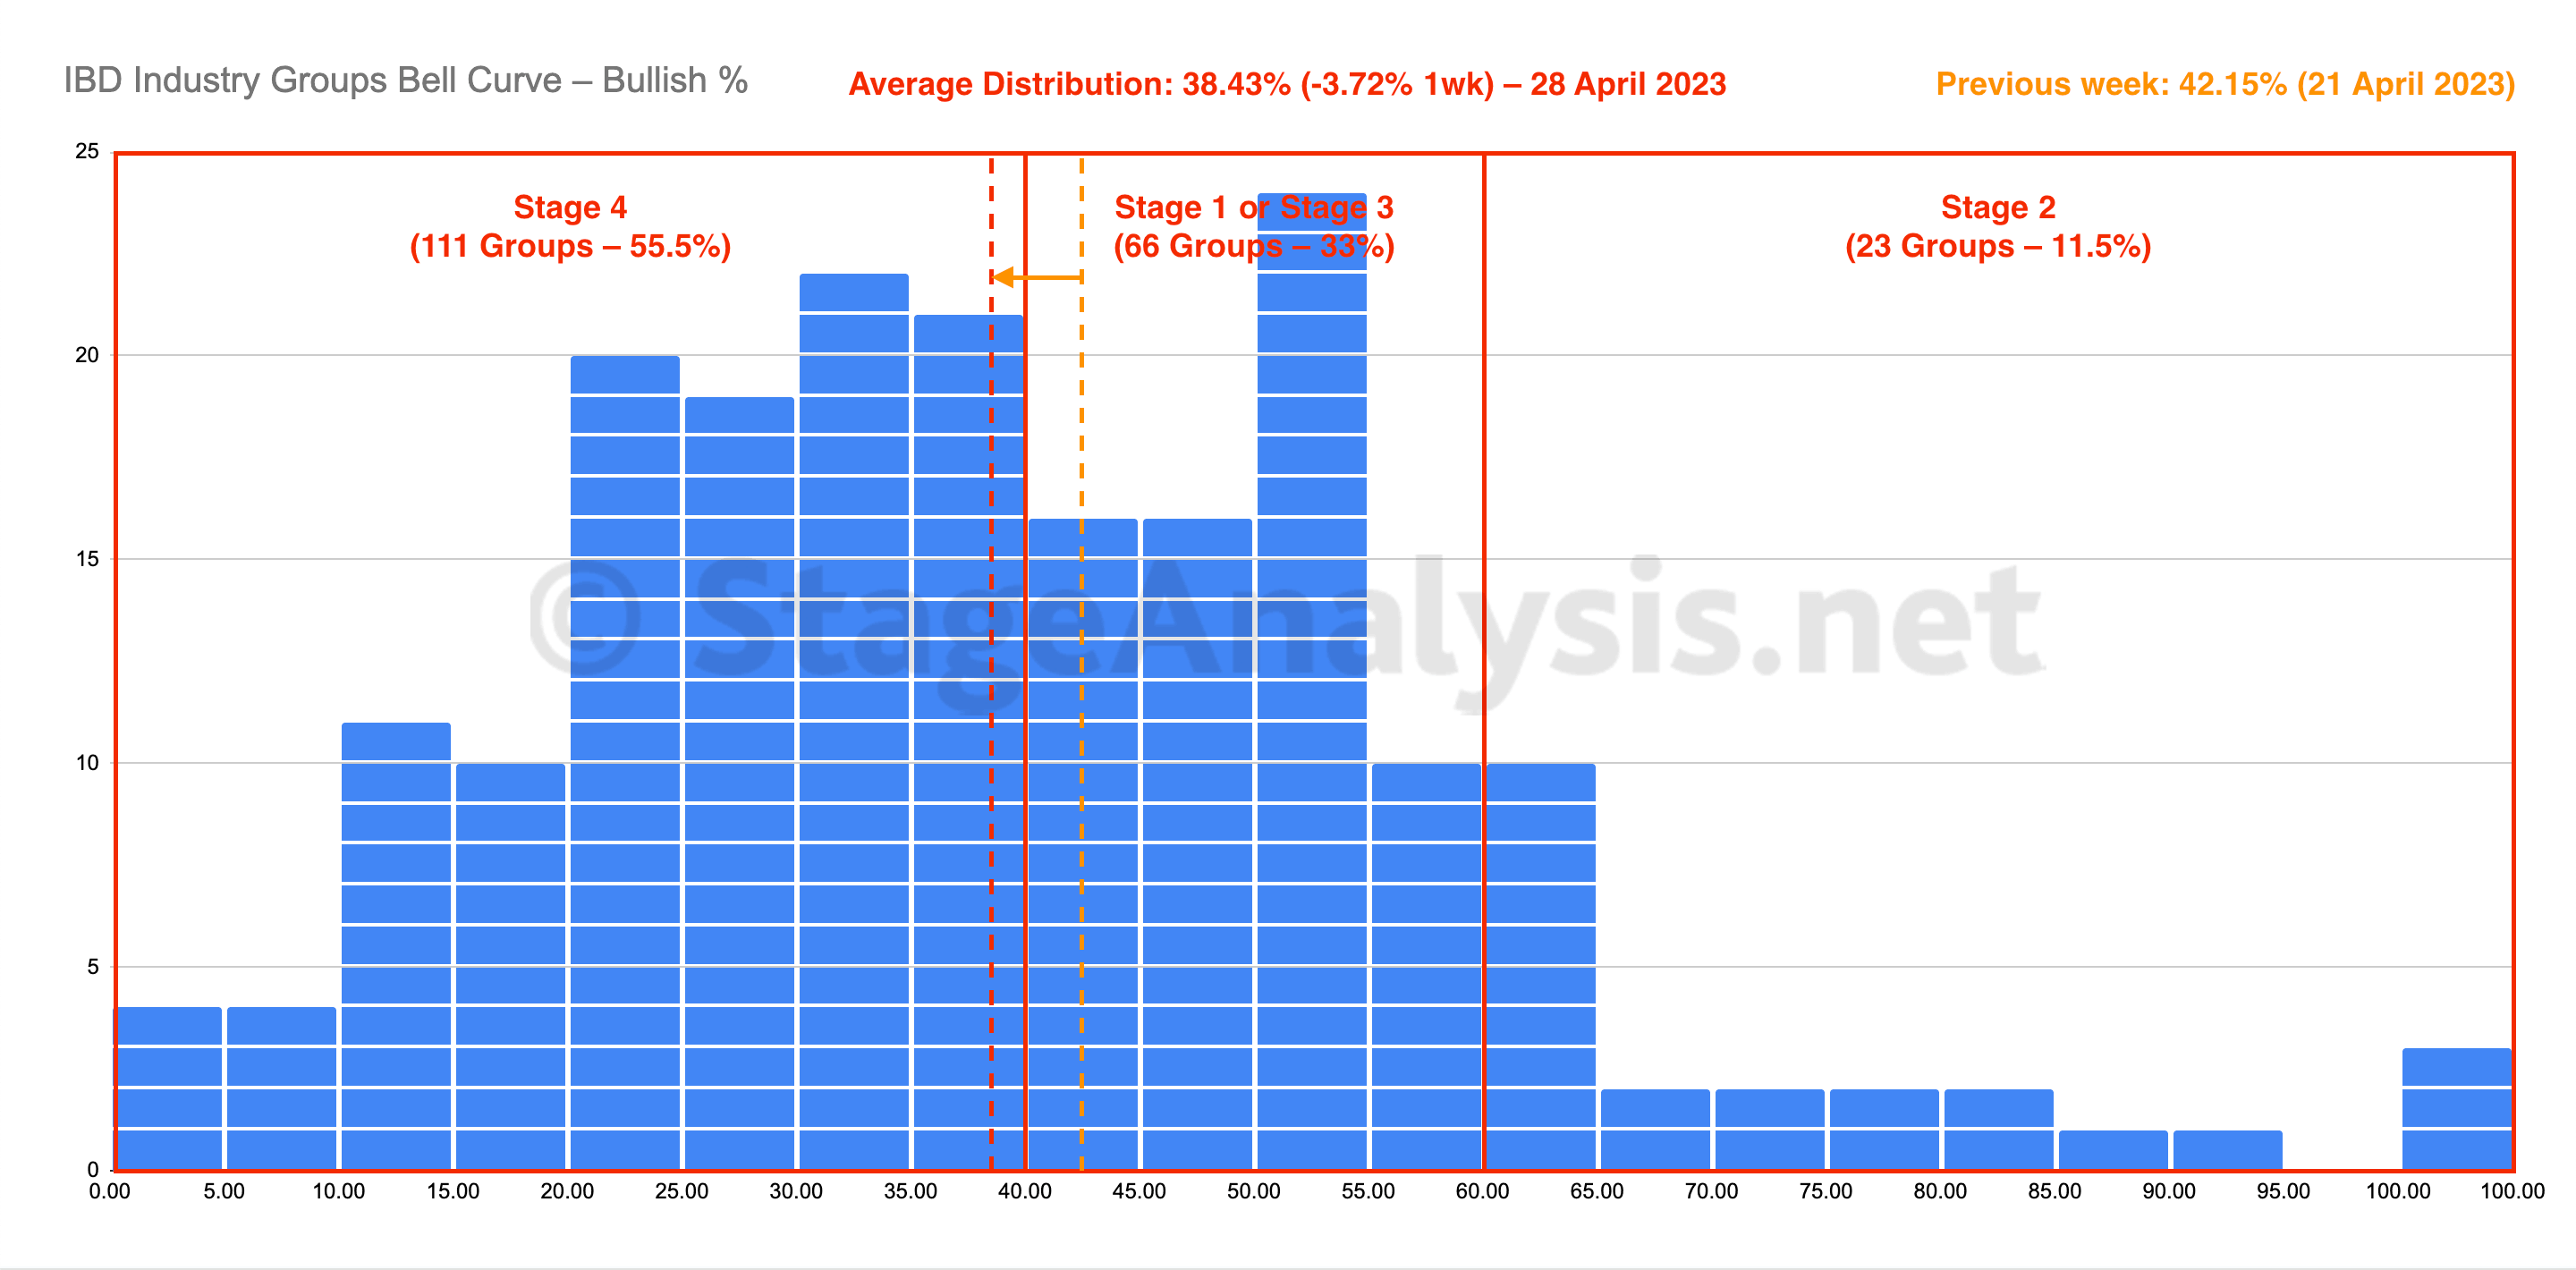
The IBD Industry Groups Bell Curve declined this week by -3.72% to finish at 38.43% overall. The amount of groups in Stage 4 increased by 20 (+10%), and the amount of groups in Stage 2 decreased by 7 (-3.5%), while the amount groups in Stage 1 or Stage 3 decreased by 13 (-6.5%)...
Read More
29 April, 2023
Market Breadth: Percentage of Stocks Above their 50 Day, 150 Day & 200 Day Moving Averages Combined
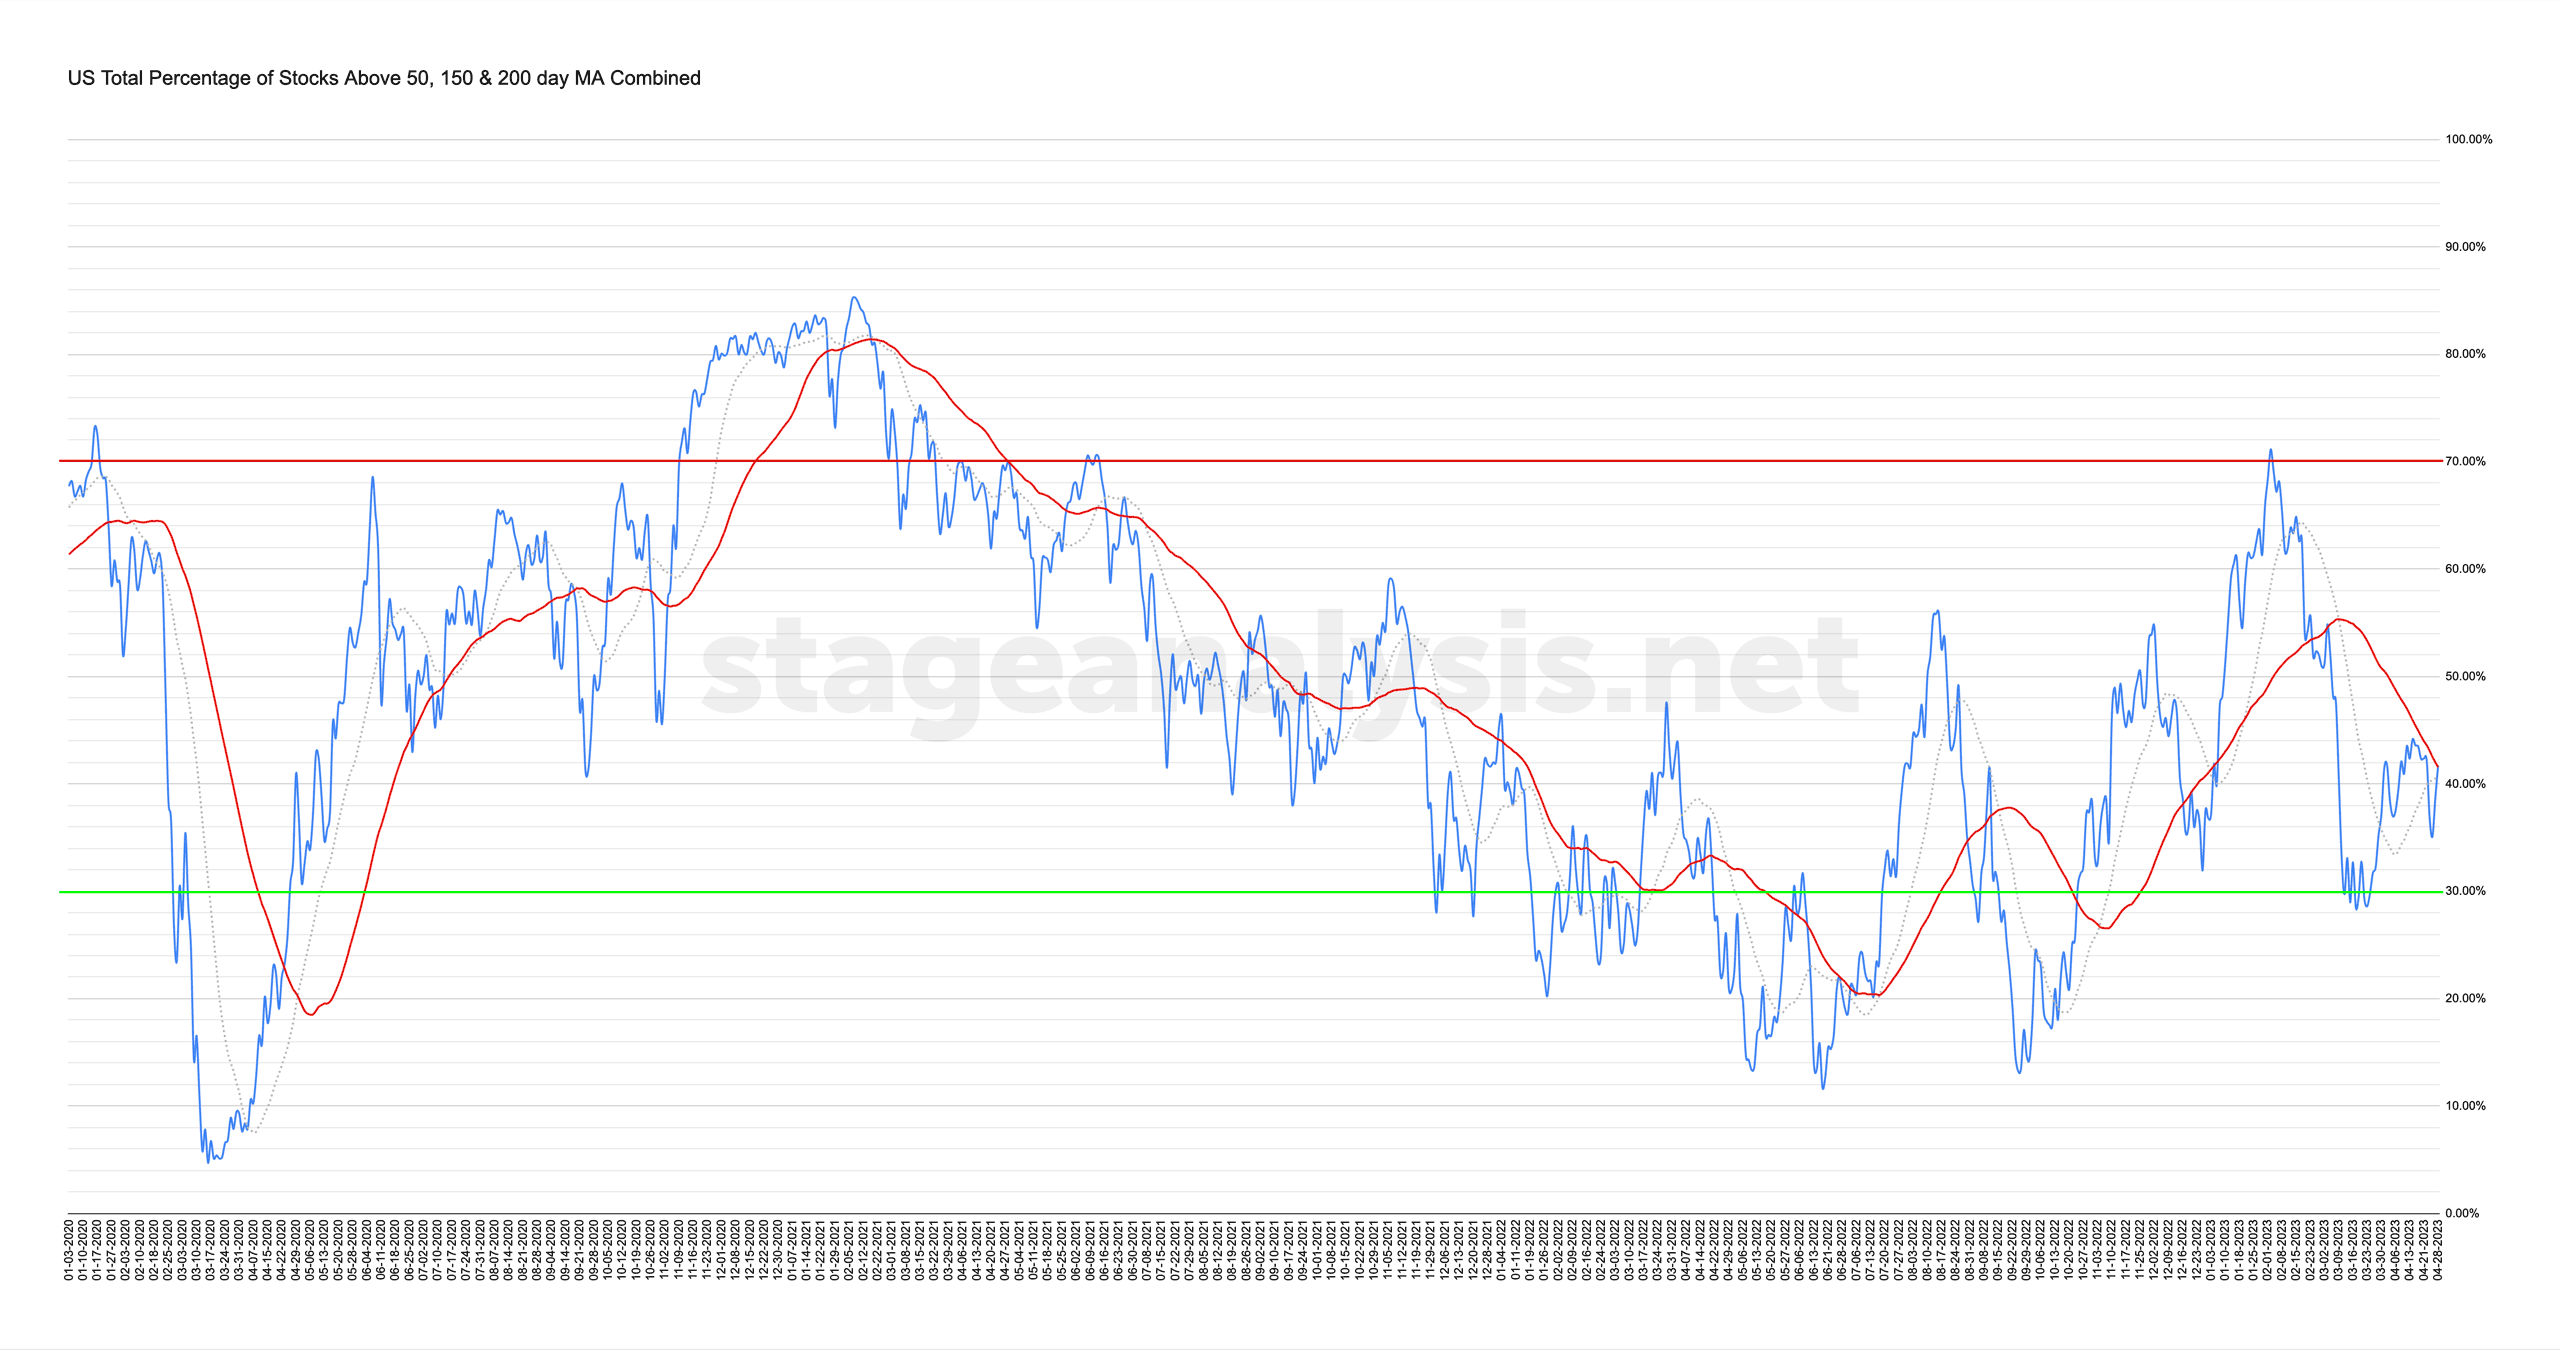
Custom Percentage of Stocks Above Their 50 Day, 150 Day & 200 Day Moving Averages Combined Market Breadth Charts for the Overall US Market, NYSE and Nasdaq for Market Timing and Strategy.
Read More
28 April, 2023
US Stocks Industry Groups Relative Strength Rankings
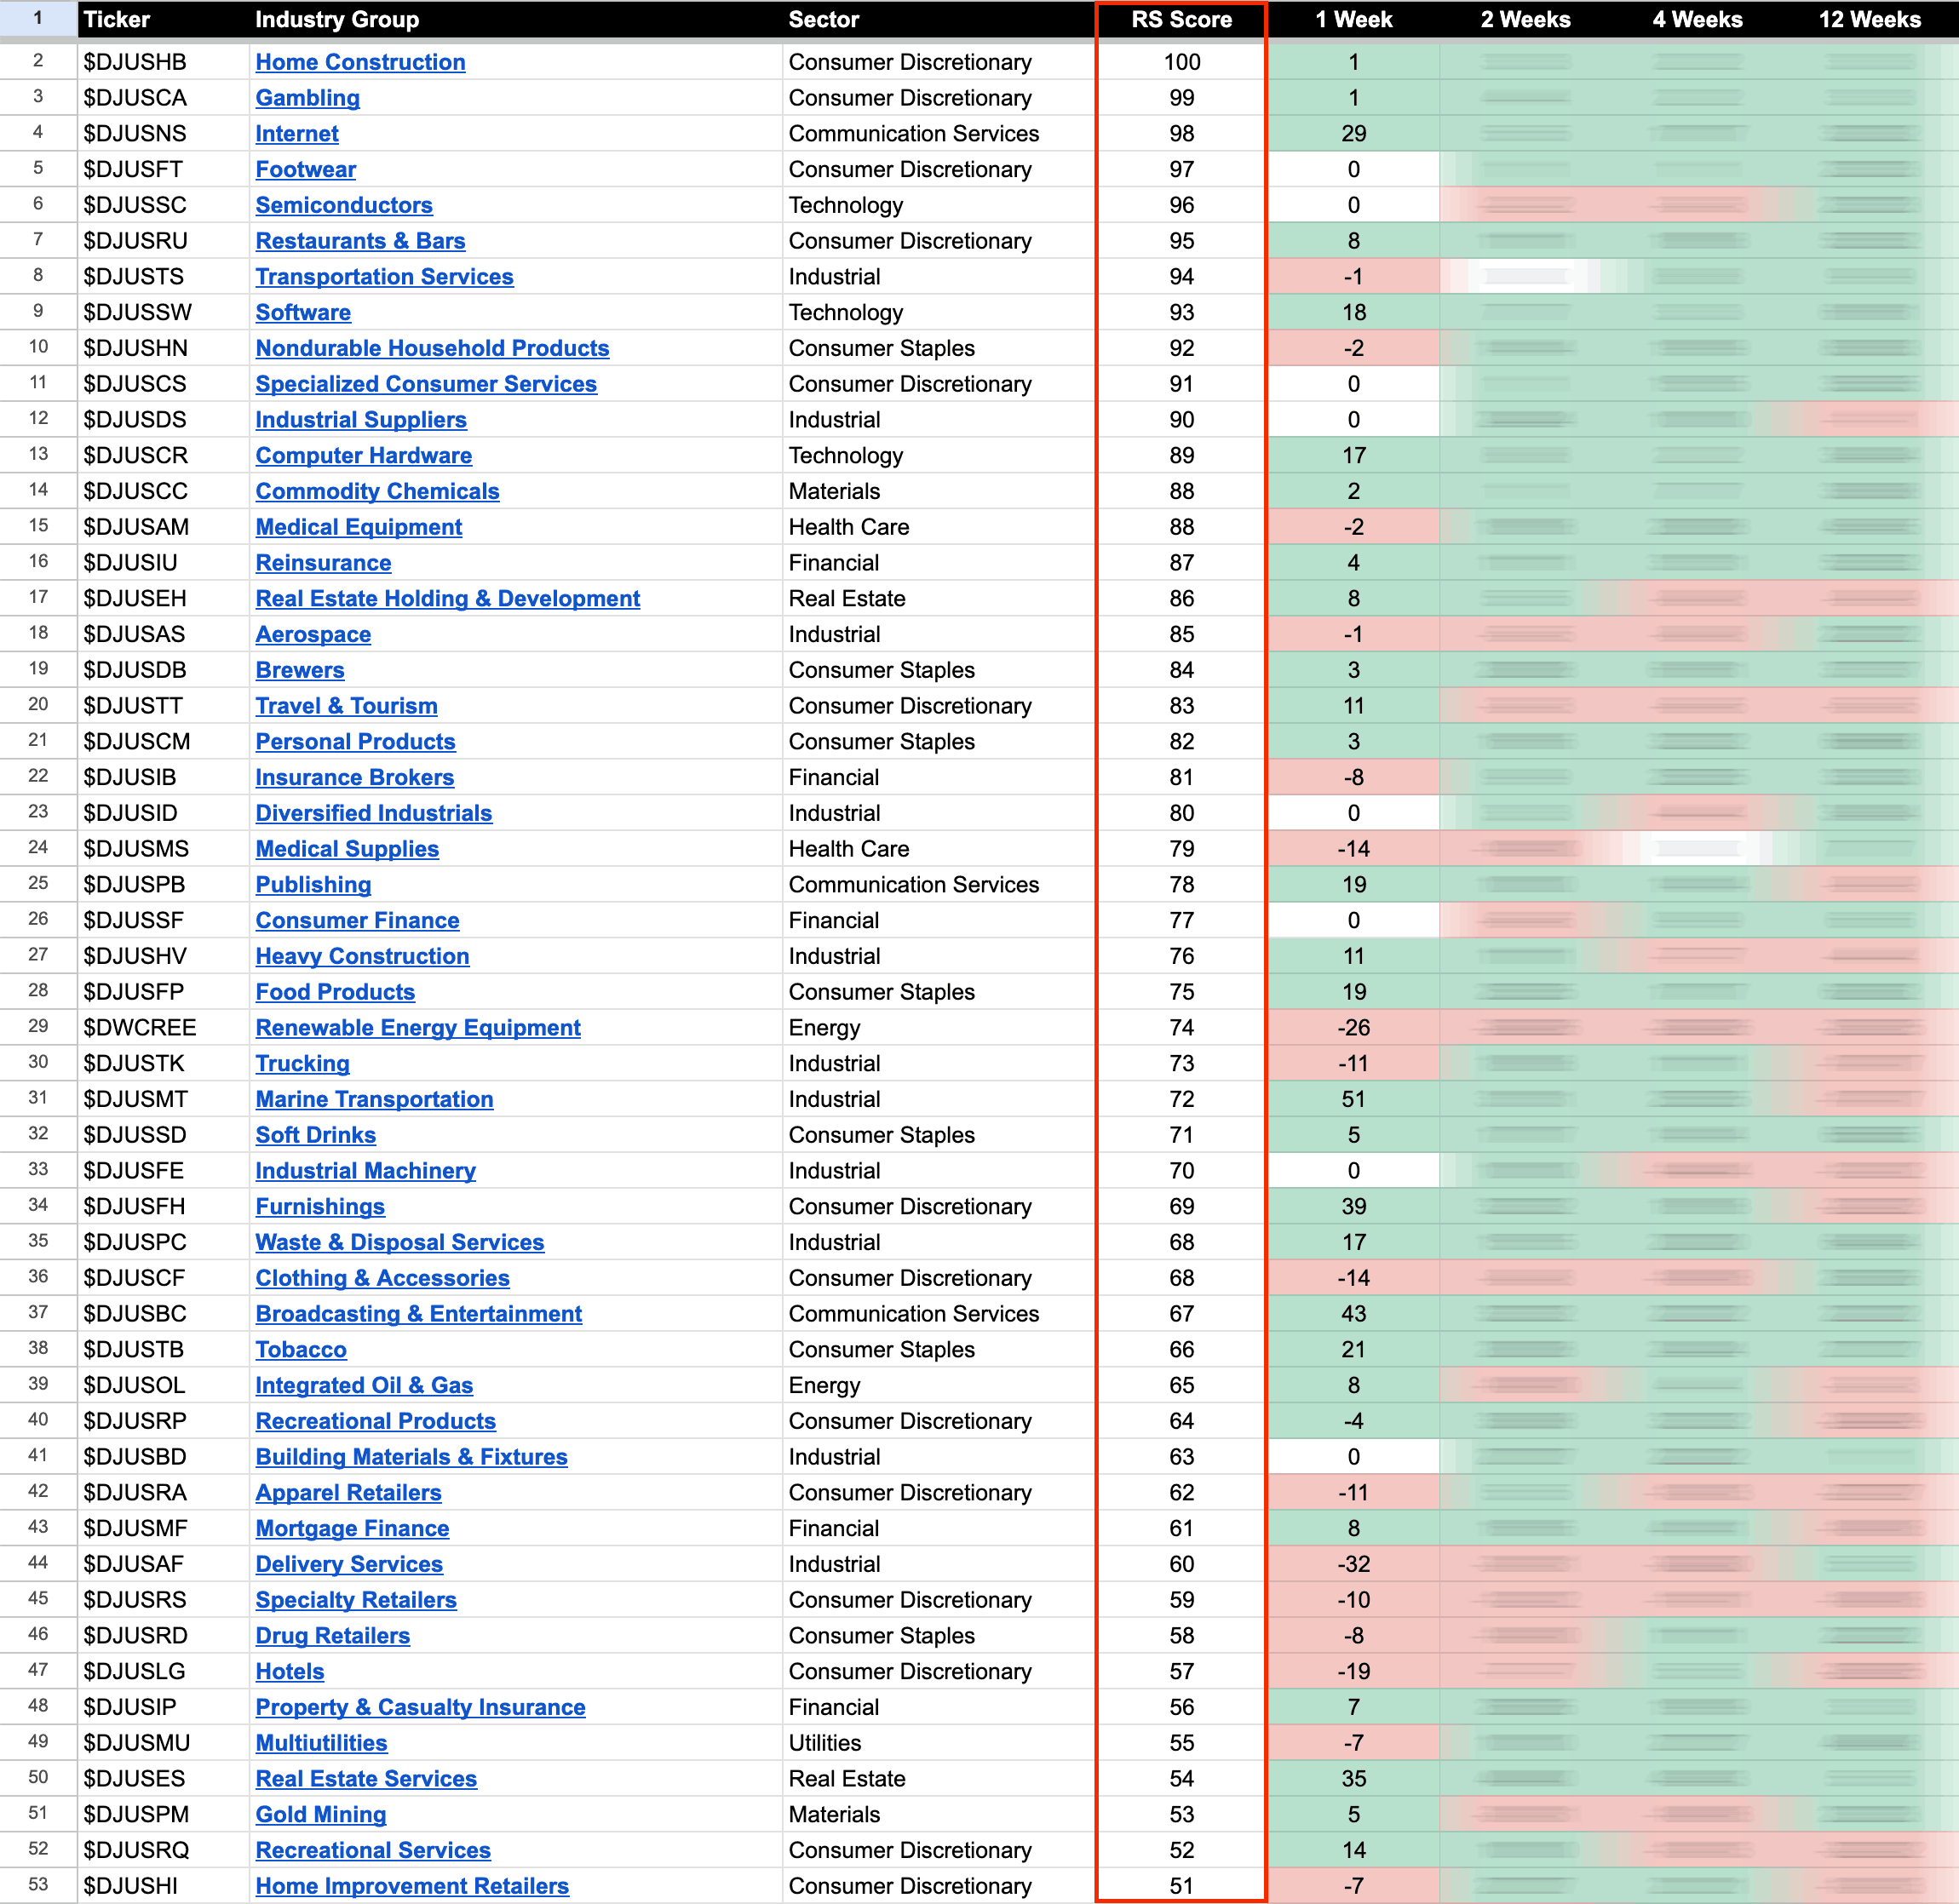
The purpose of the Relative Strength (RS) tables is to track the short, medium and long term RS changes of the individual groups to find the new leadership earlier than the crowd...
Read More
28 April, 2023
US Stocks Watchlist – 27 April 2023
There were 22 stocks highlighted from the US stocks watchlist scans today...
Read More
26 April, 2023
Stage Analysis Midweek Video – 26 April 2023
A brief midweek video today covering the major US indexes and short-term breadth measures...
Read More
25 April, 2023
US Stocks Watchlist – 25 April 2023
There were 21 stocks highlighted from the US stocks watchlist scans today...
Read More
23 April, 2023
Stage Analysis Members Video – 23 April 2023 (1hr 23mins)
Stage Analysis members weekend video featuring Stage Analysis of the mega cap stocks reporting earnings in the coming week, plus the members only content covering the Major Indexes Update, Futures, Industry Group RS Rankings, IBD Industry Groups Bell Curve – Bullish Percent, Market Breadth, Stage 2 Continuation Breakouts and the US Watchlist Stocks detailed discussion...
Read More
23 April, 2023
US Stocks Watchlist – 23 April 2023
There were 26 stocks highlighted from the US stocks watchlist scans today...
Read More
22 April, 2023
IBD Industry Groups Bell Curve – Bullish Percent
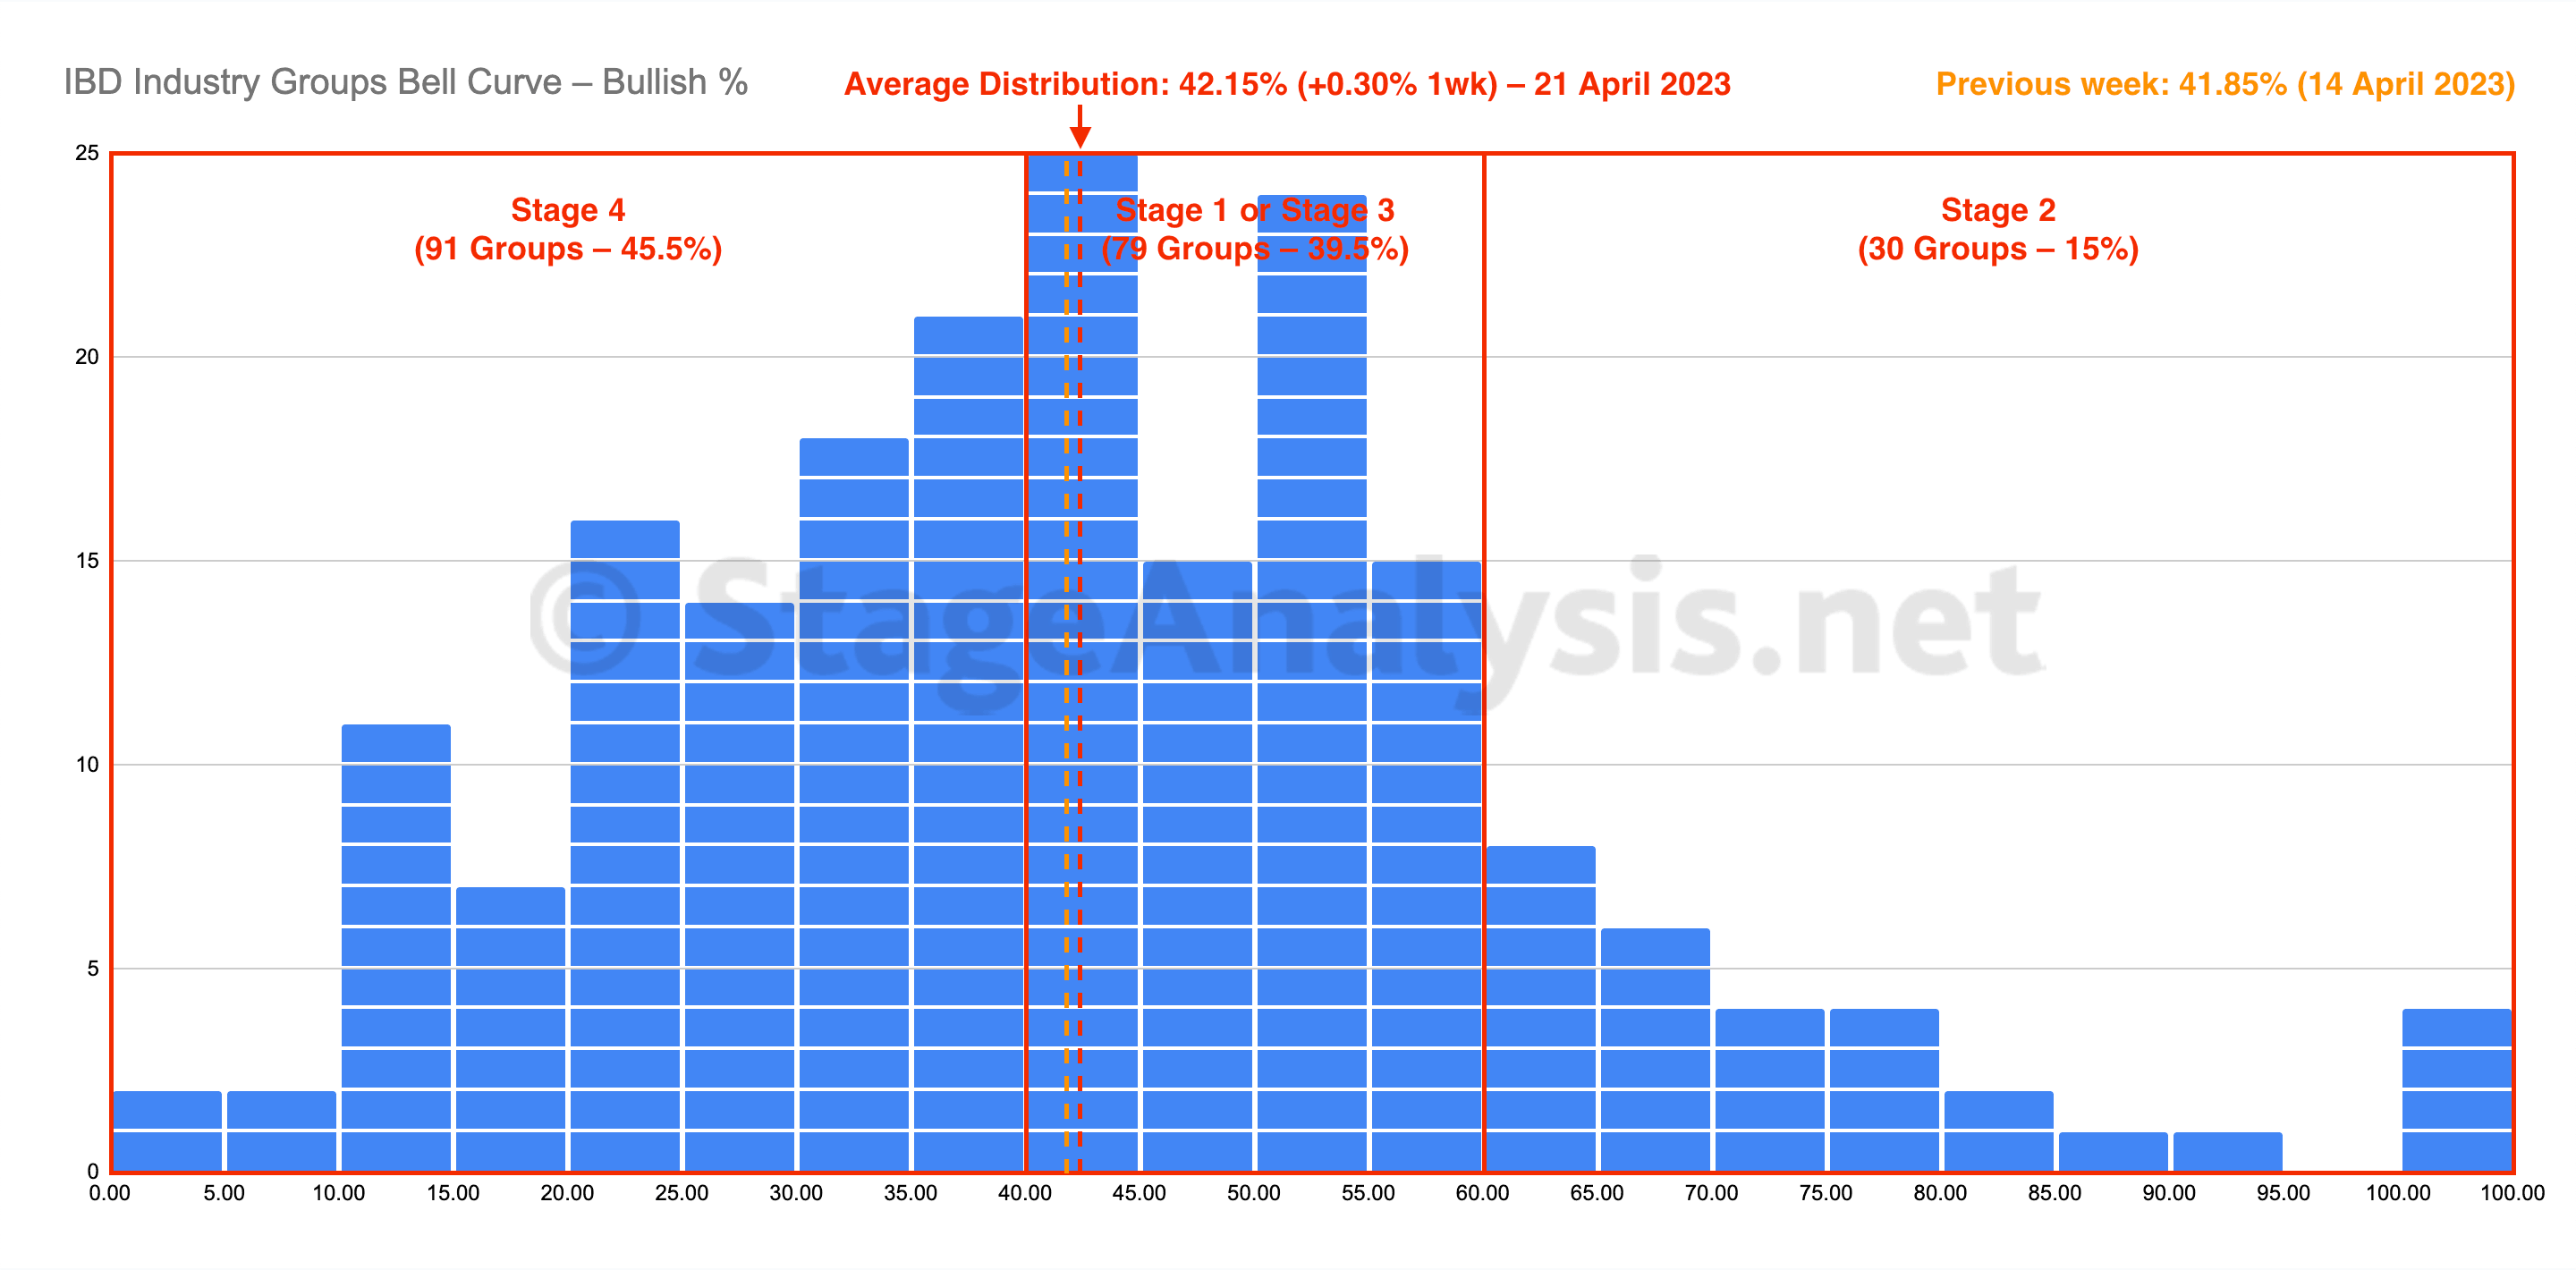
The IBD Industry Groups Bell Curve edged slightly higher this week by +0.30% to finish the week at 42.15%. The amount of groups in Stage 4 increased by 3 (+1.5%), and the amount of groups in Stage 2 decreased by 3 (-1.5%), while the amount groups in Stage 1 or Stage 3 was unchanged...
Read More

