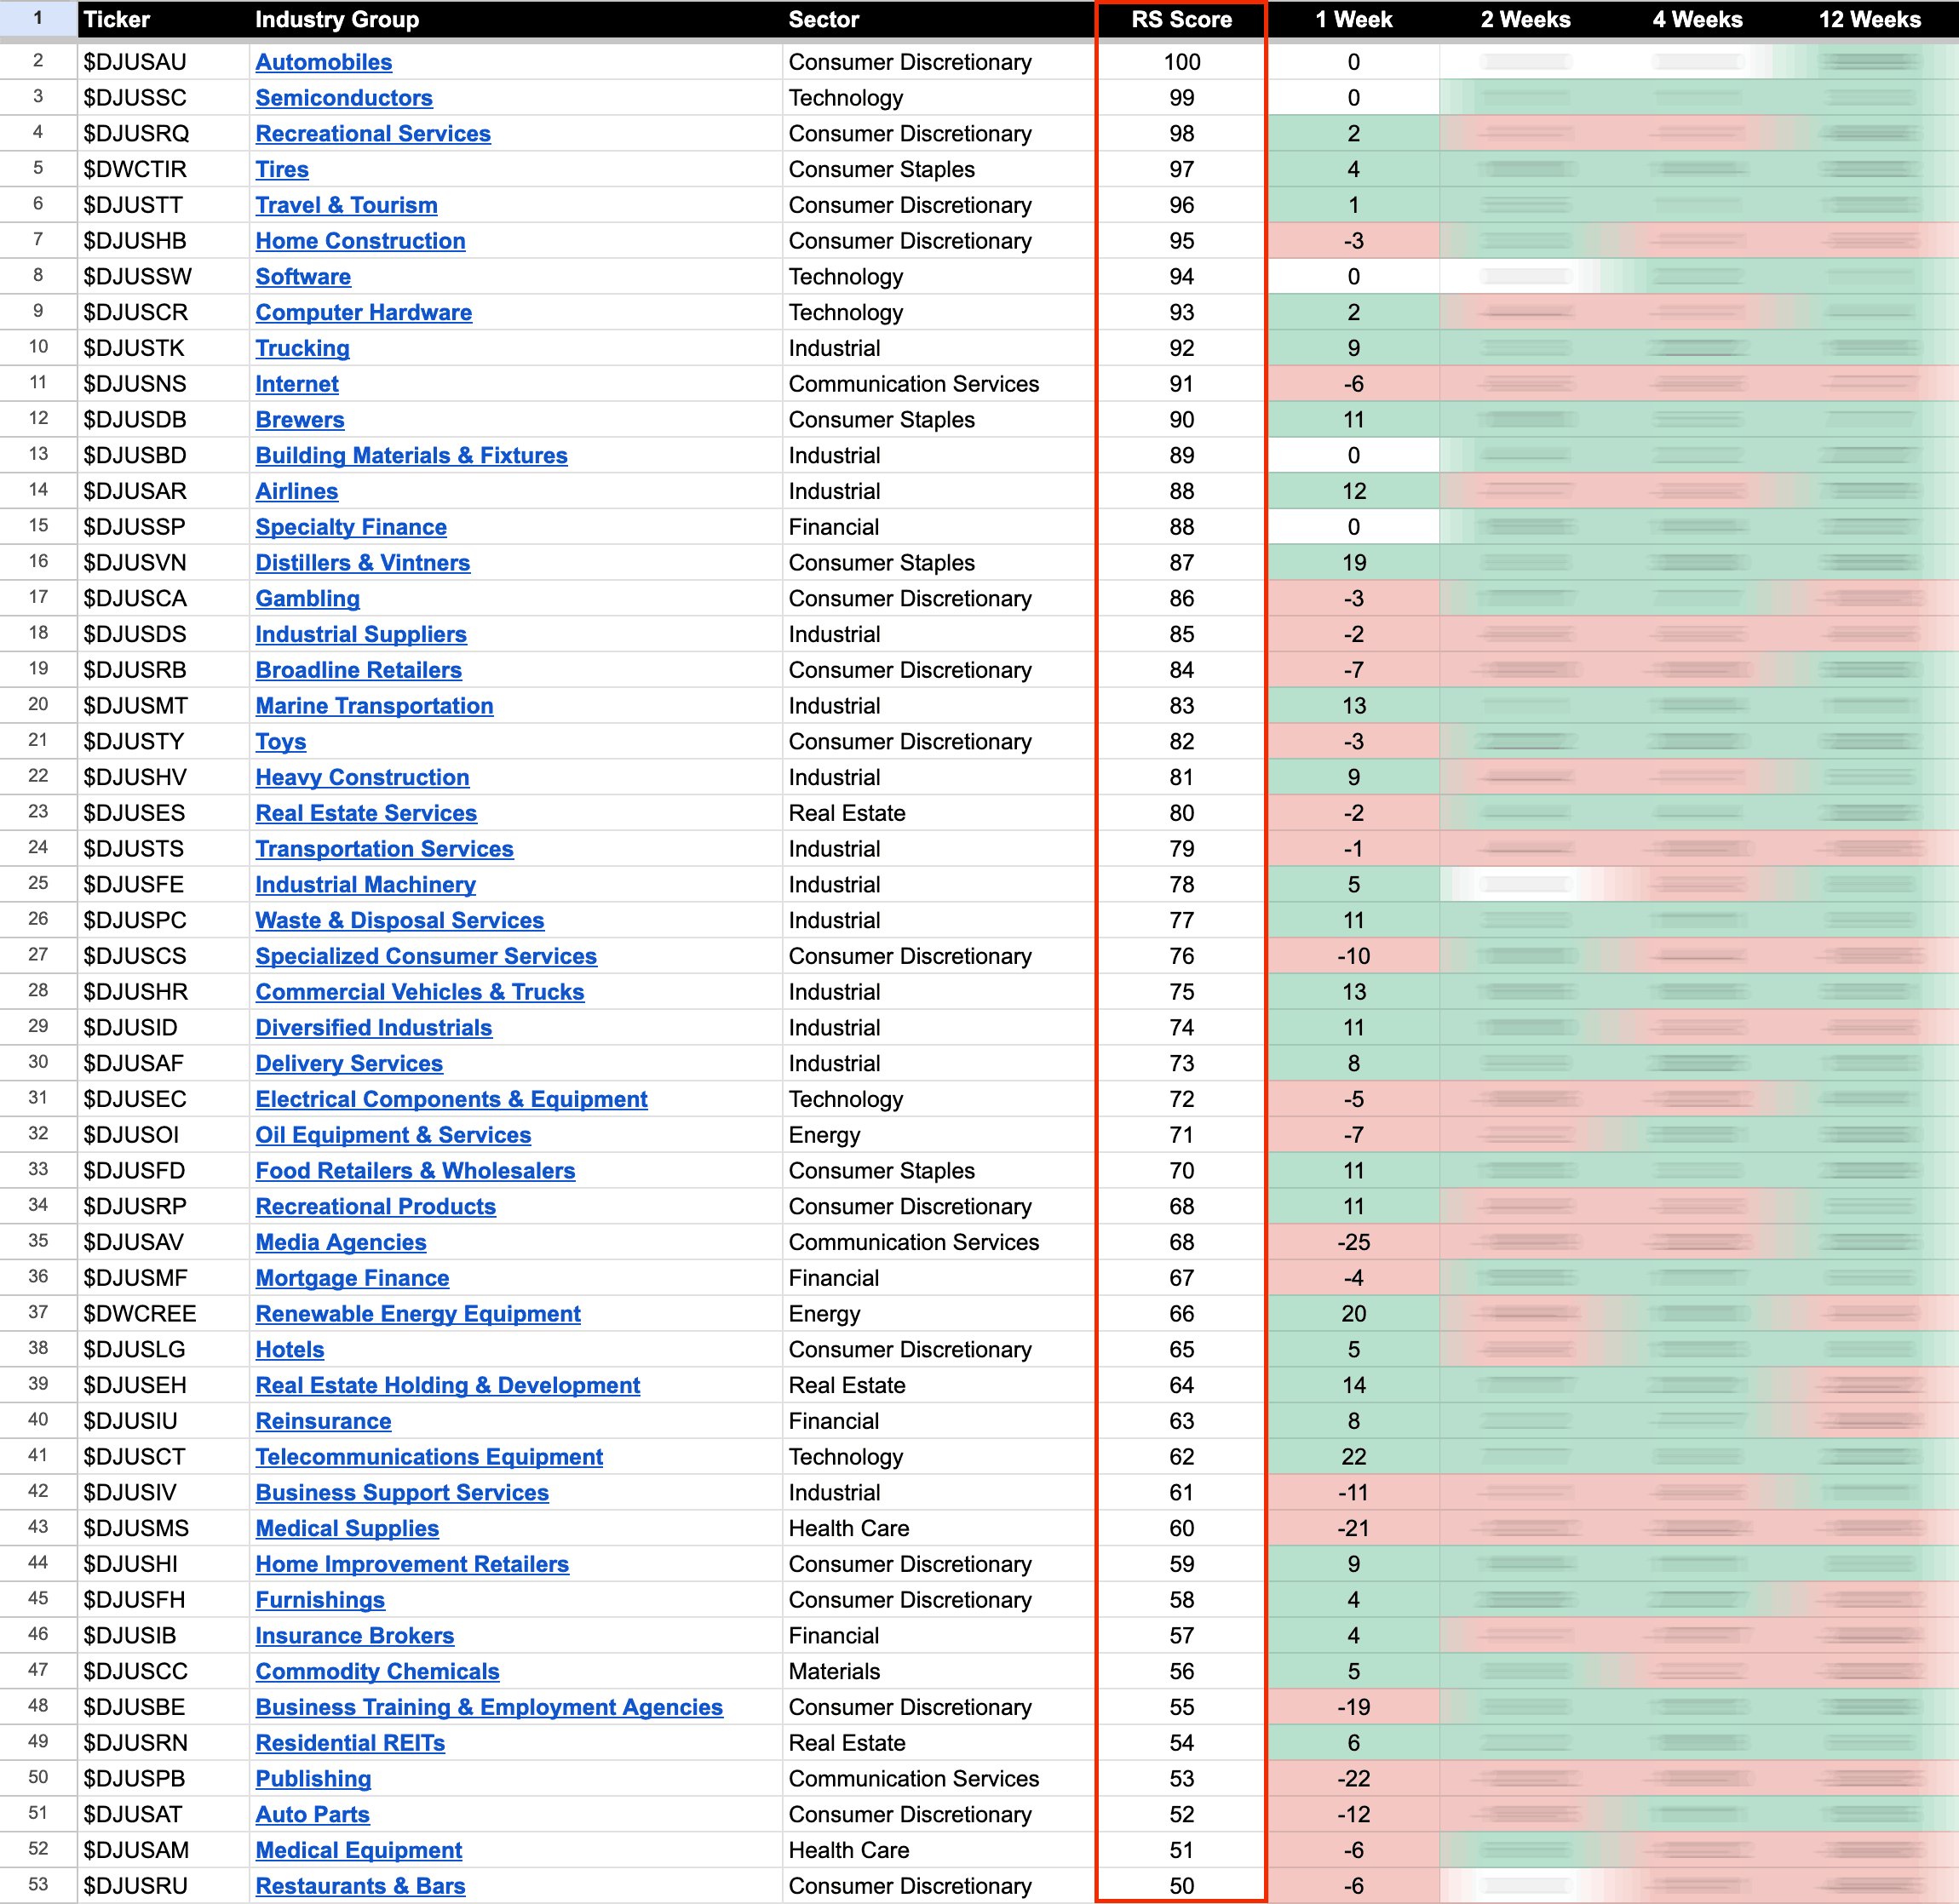
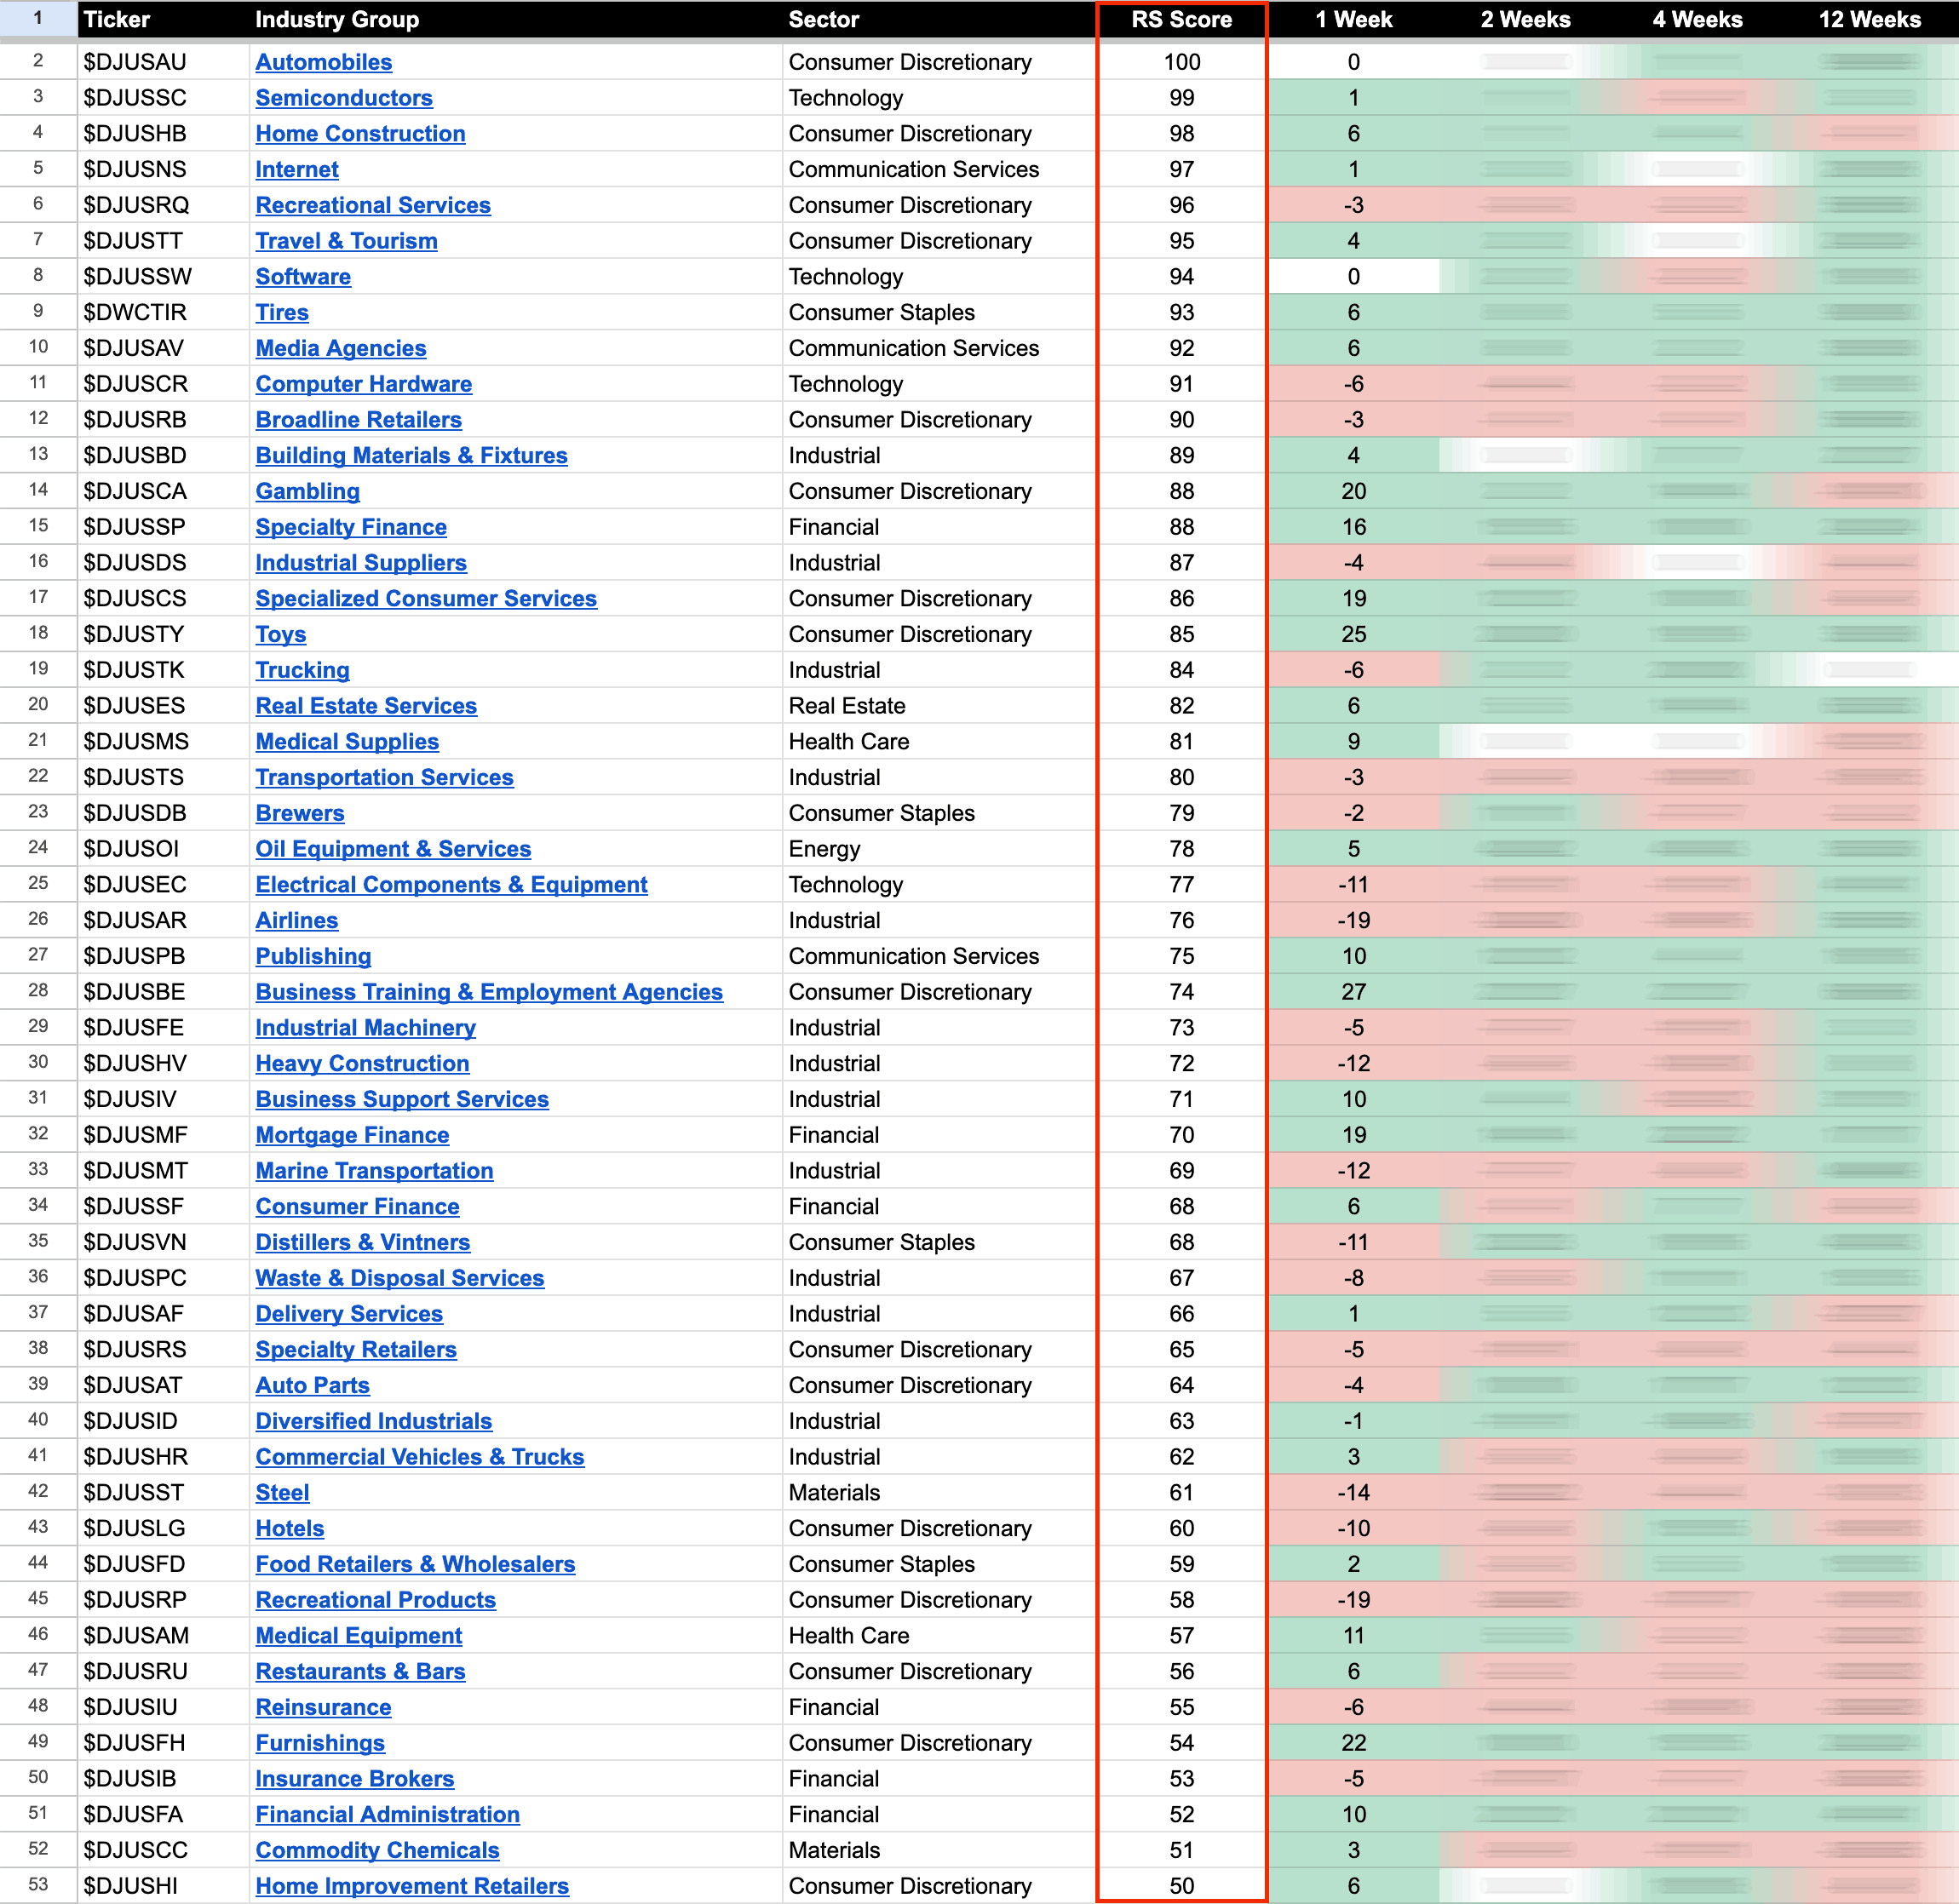
The purpose of the Relative Strength (RS) tables is to track the short, medium and long term RS changes of the individual groups to find the new leadership earlier than the crowd...
Read More
Blog
21 July, 2023
US Stocks Industry Groups Relative Strength Rankings
20 July, 2023
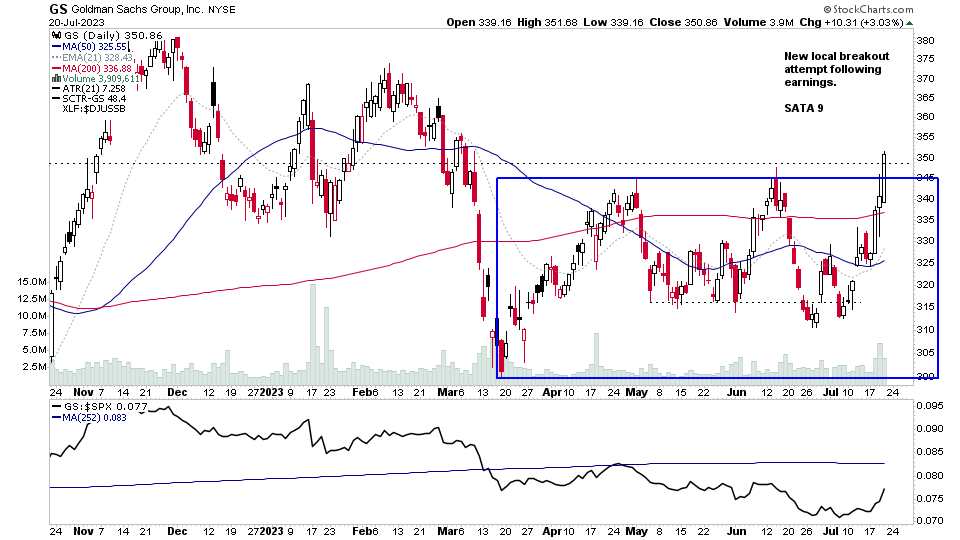
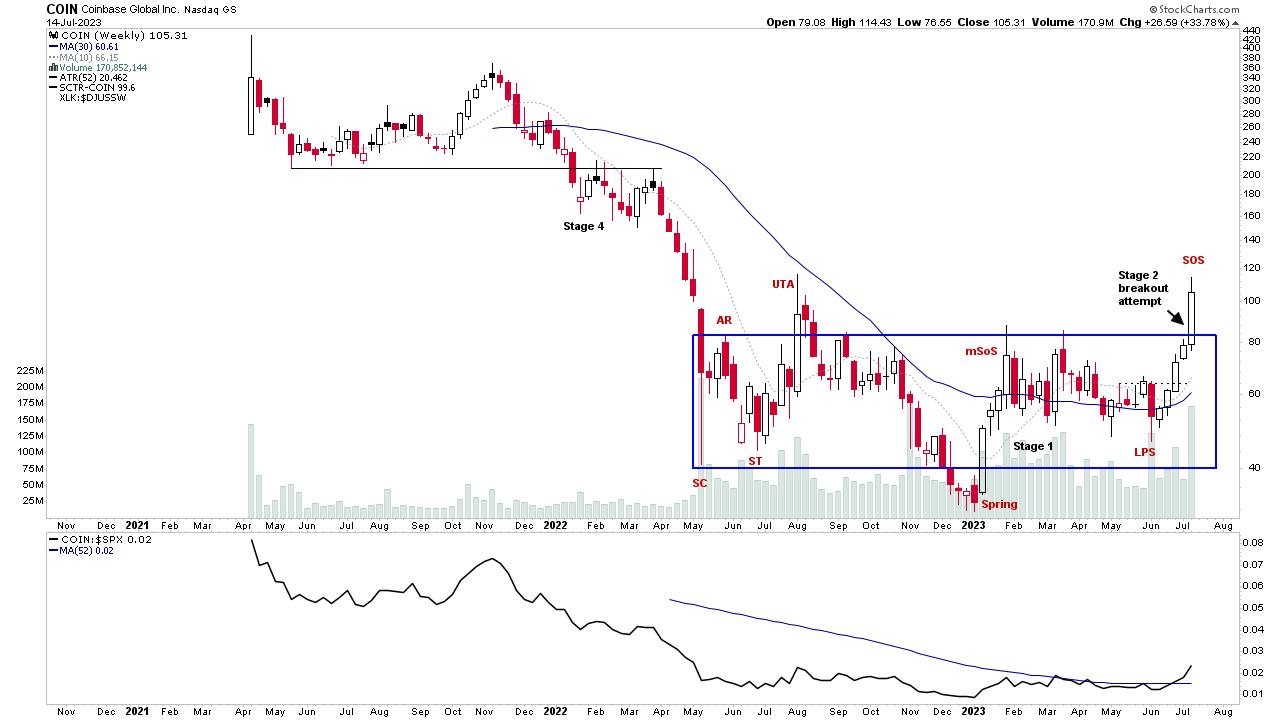
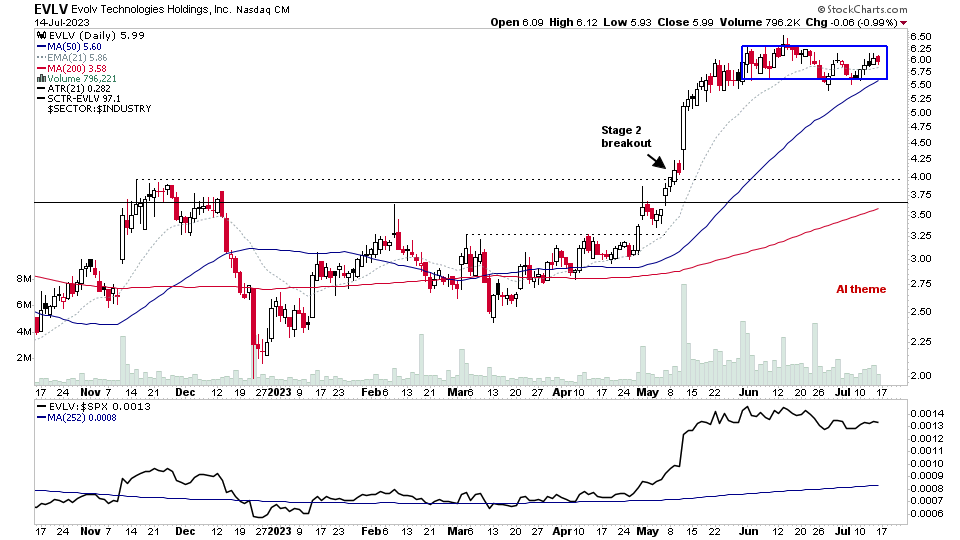
US Stocks Watchlist – 20 July 2023
There were 31 stocks highlighted from the US stocks watchlist scans today...
Read More
19 July, 2023
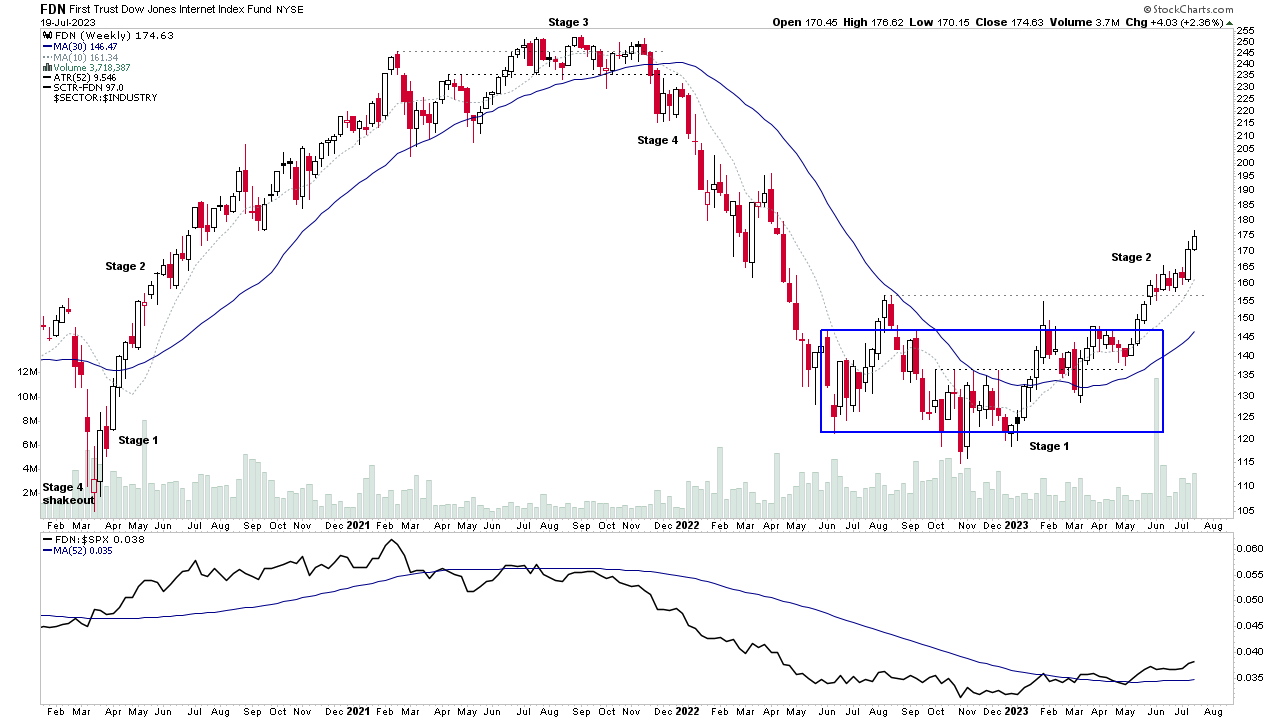
Group Focus Video: Internet – 19 July 2023 (49mins)
This weeks group focus video is on the Internet group, which has been one of the leading groups (in the top 10 of the RS Rankings) since mid March. So with earnings season underway, and multiple stocks from the group reporting in the coming weeks, it's a good time to review the groups overall position in its Stage 2 advance...
Read More
18 July, 2023
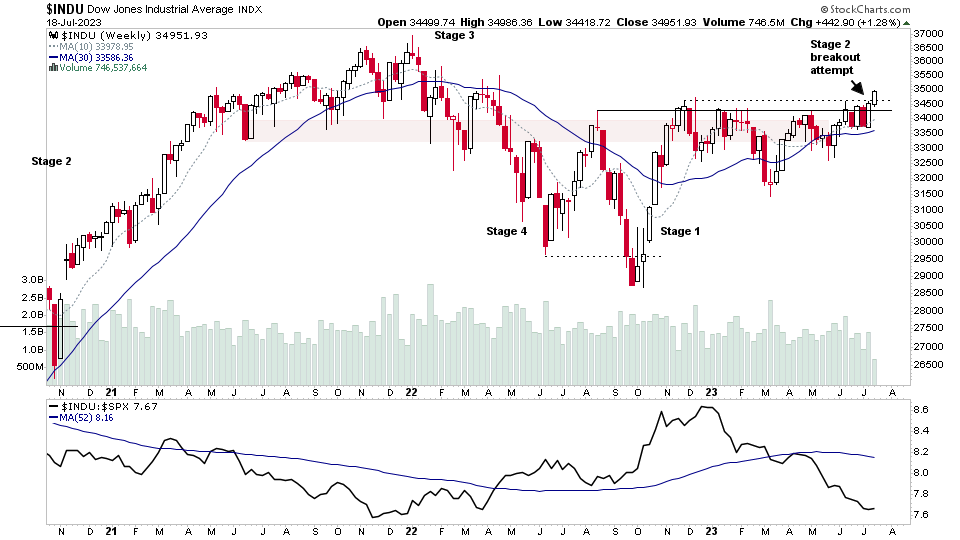
Dow Jones Stage 2 Breakout Attempt and the US Stocks Watchlist – 18 July 2023
There were 30 stocks highlighted from the US stocks watchlist scans today...
Read More
17 July, 2023
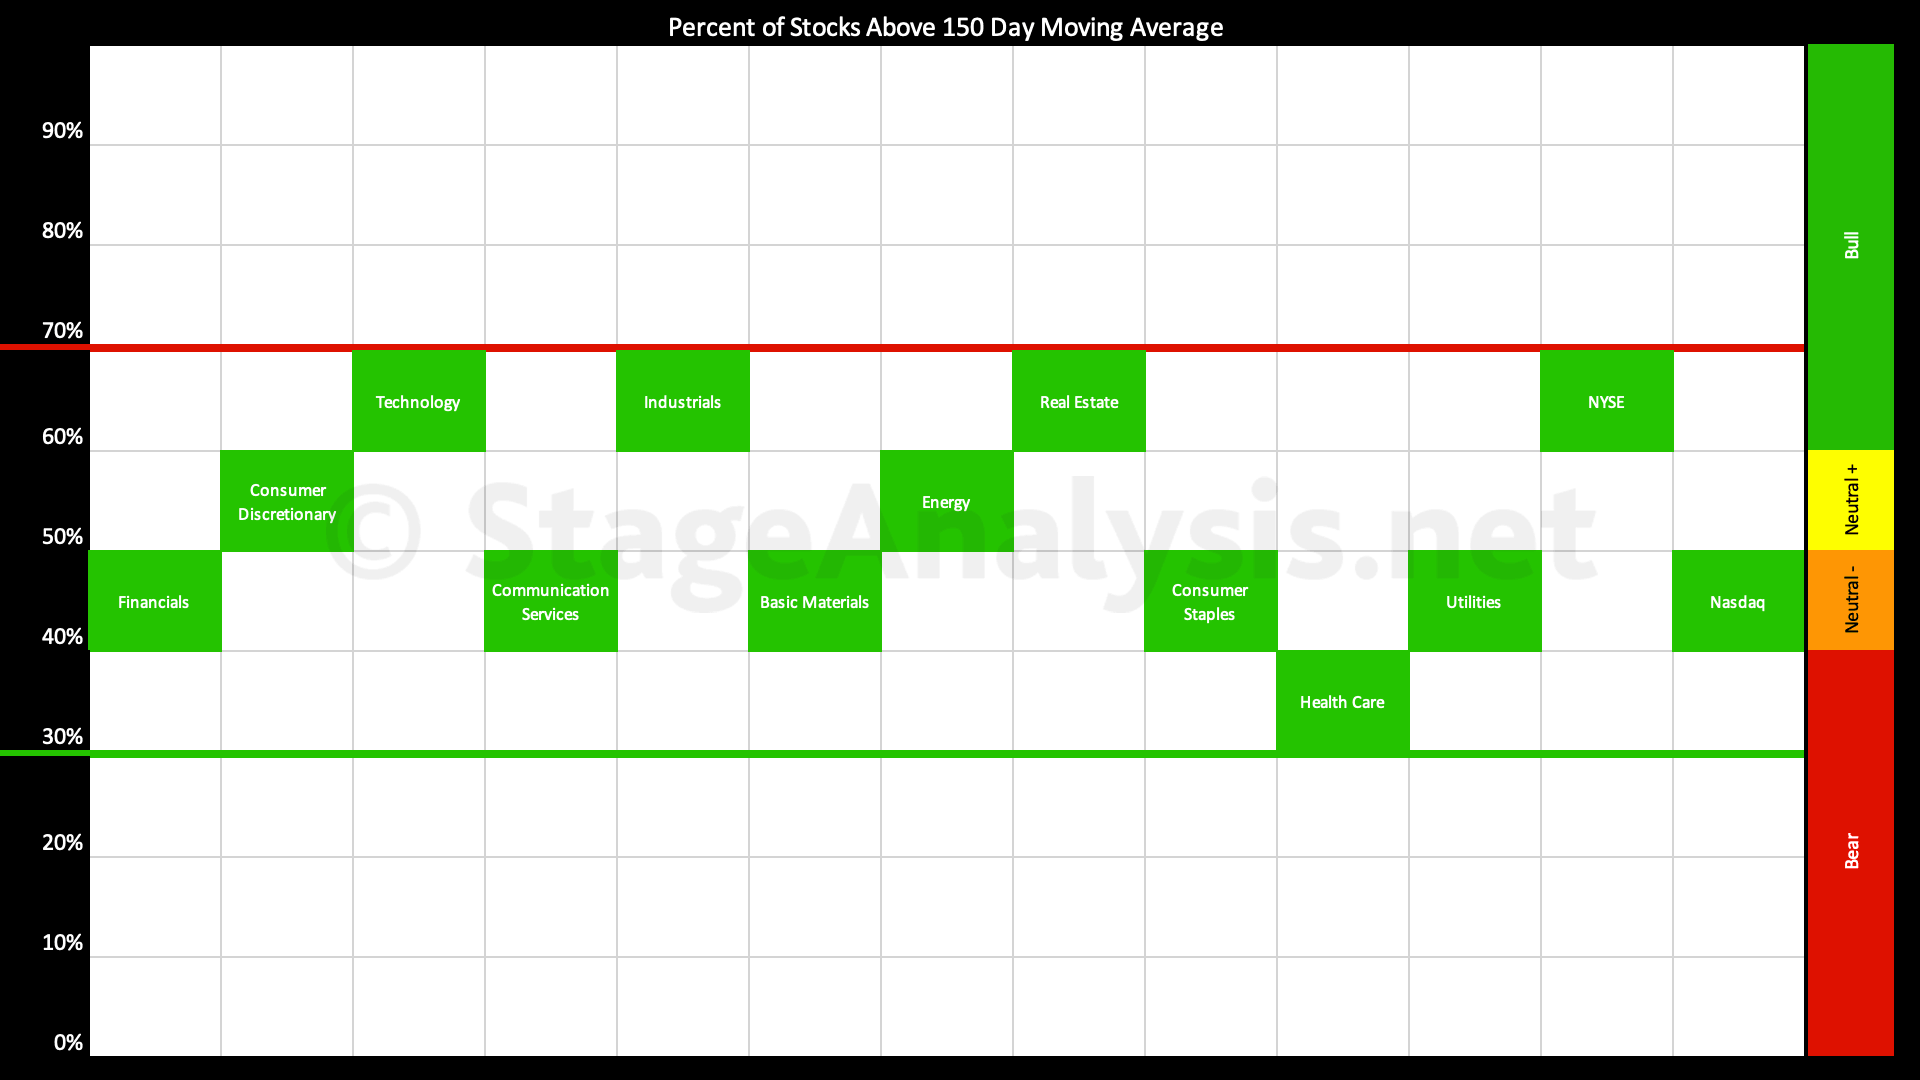
Sector Breadth: Percentage of US Stocks Above Their 150 day (30 Week) Moving Averages
The percentage of US stocks above their 150 day (30 week) moving averages in the 11 major sectors post provides a unique snapshot of the overall market health and is highlighted every few weeks in the Stage Analysis blog...
Read More
16 July, 2023
Stage Analysis Members Video – 16 July 2023 (1hr 25mins)
Stage Analysis members weekend video beginning with a discussion of some of the weeks strongest Stage 2 breakout attempts on volume, followed by the regular member content...
Read More
16 July, 2023
US Stocks Watchlist – 16 July 2023
There were 20 stocks highlighted from the US stocks watchlist scans today. I'll discuss the watchlist stocks and group themes in detail in the members weekend video...
Read More
15 July, 2023
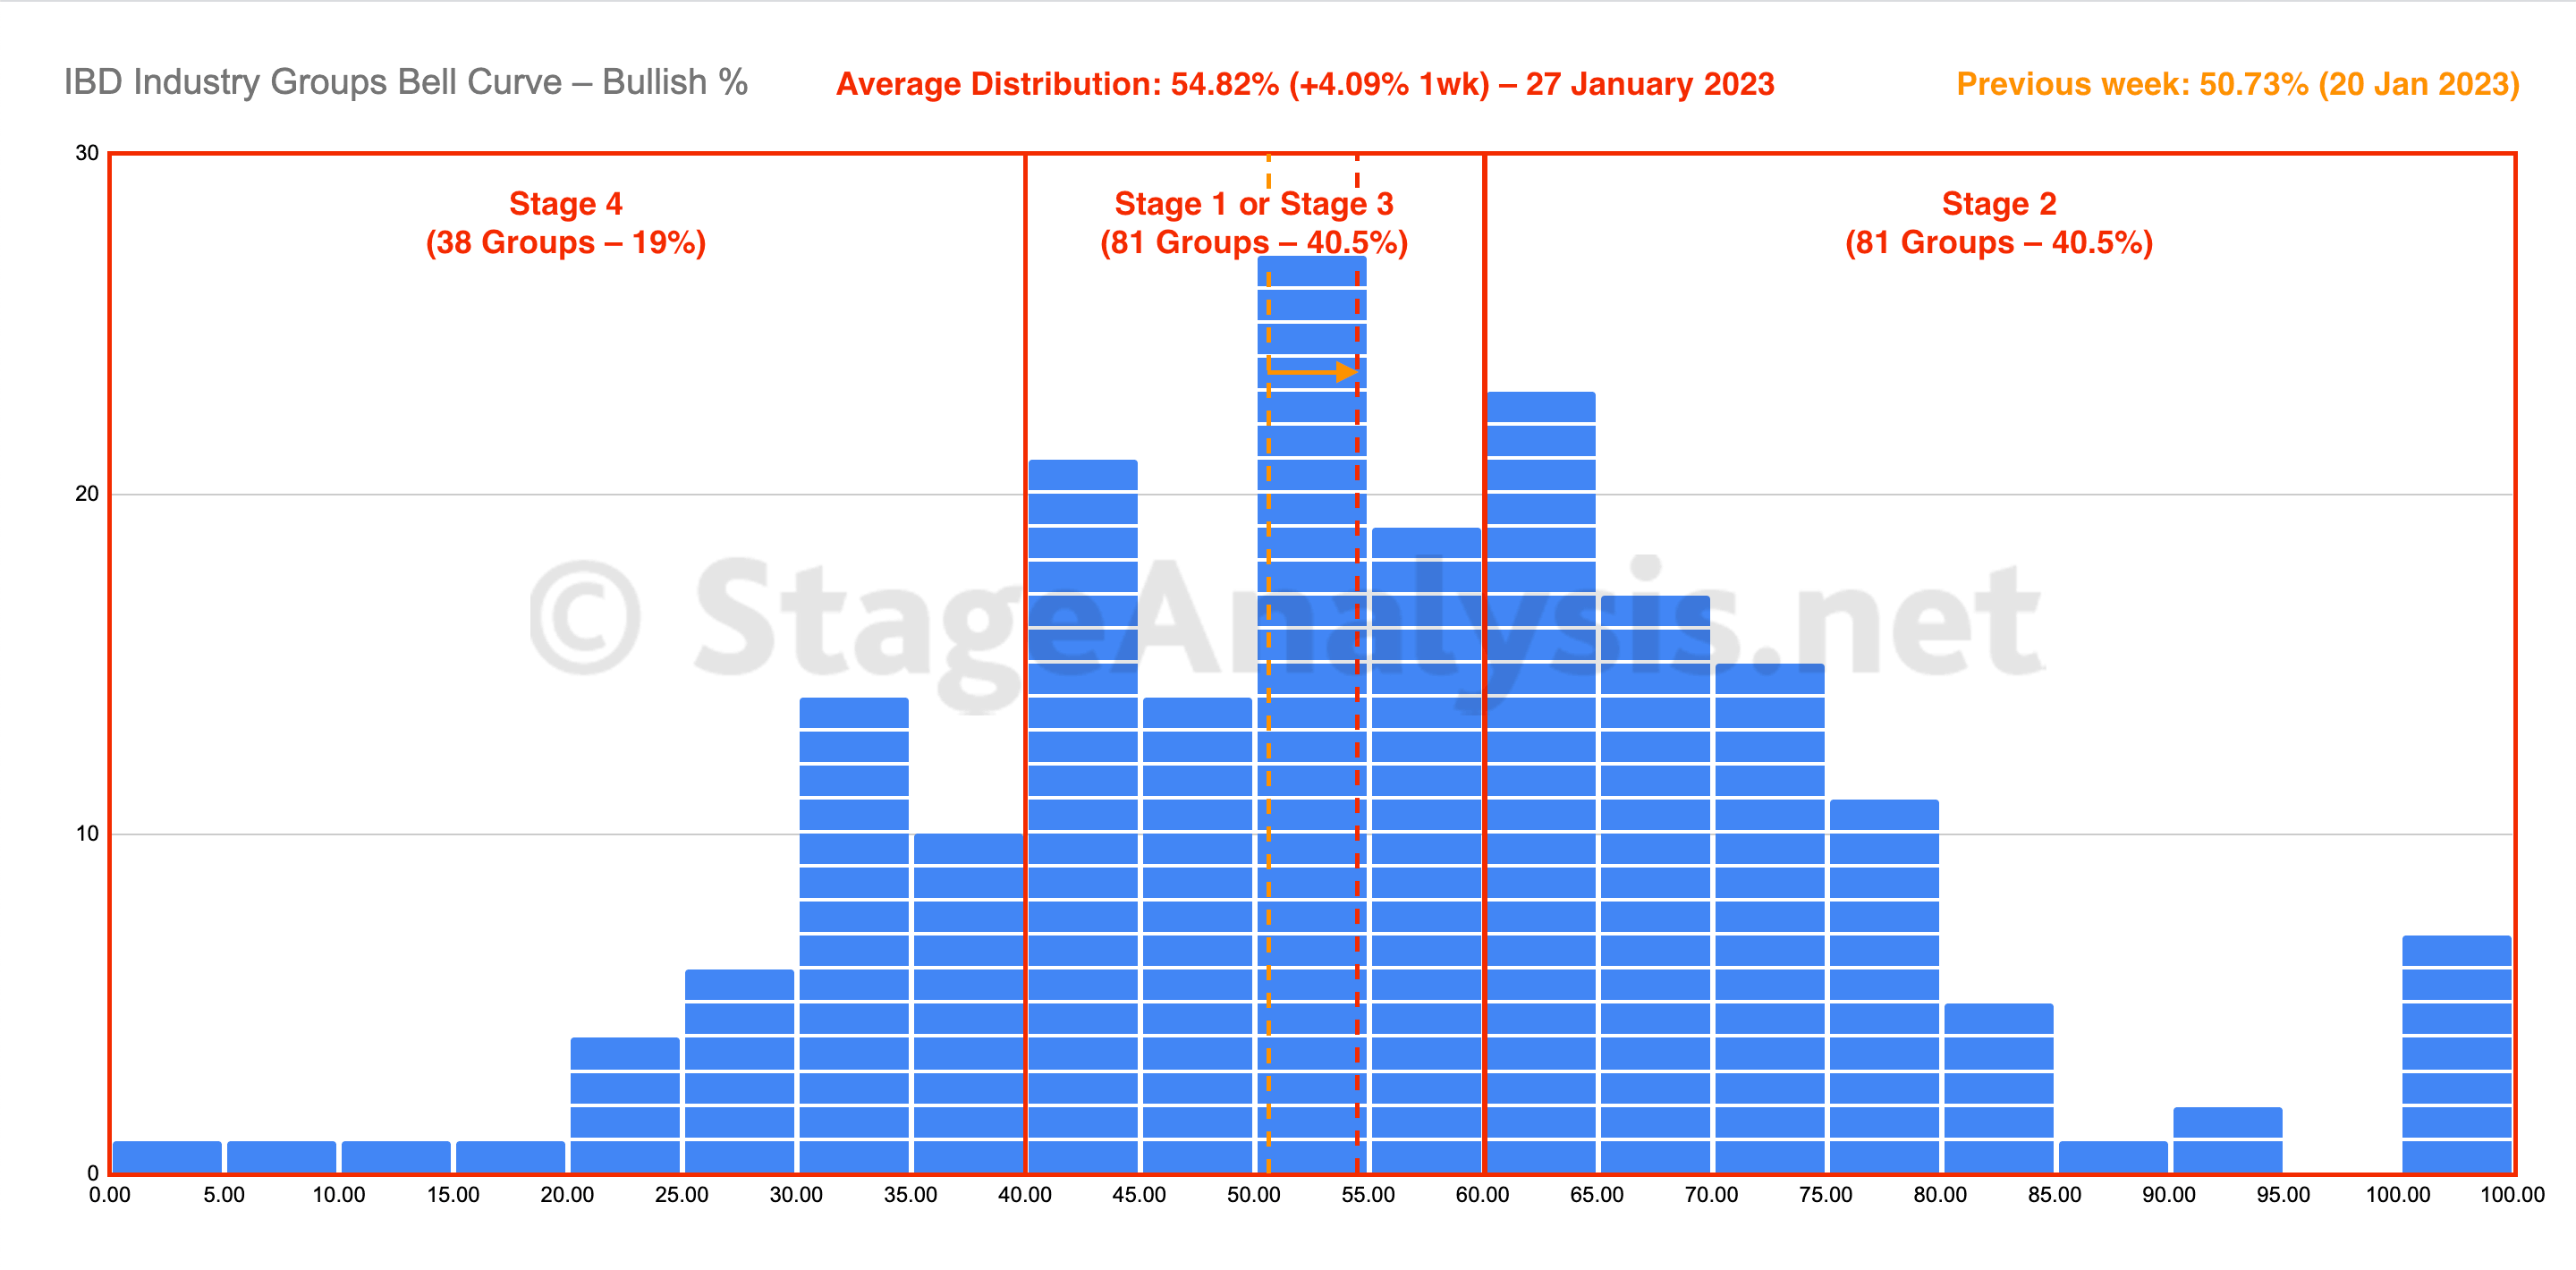
IBD Industry Groups Bell Curve – Bullish Percent
The IBD Industry Groups Bell Curve – Bullish Percent shows the few hundred industry groups plotted as a histogram chart and represents the percentage of stocks in each group that are on a point & figure (P&F) buy signal. This information provides a snapshot of the overall market health in a unique way, and is particularly useful for both market timing strategies and as a tool in aiding with the Stage Analysis methods "Forest to the Trees" approach, where we look for developing group themes...
Read More
15 July, 2023
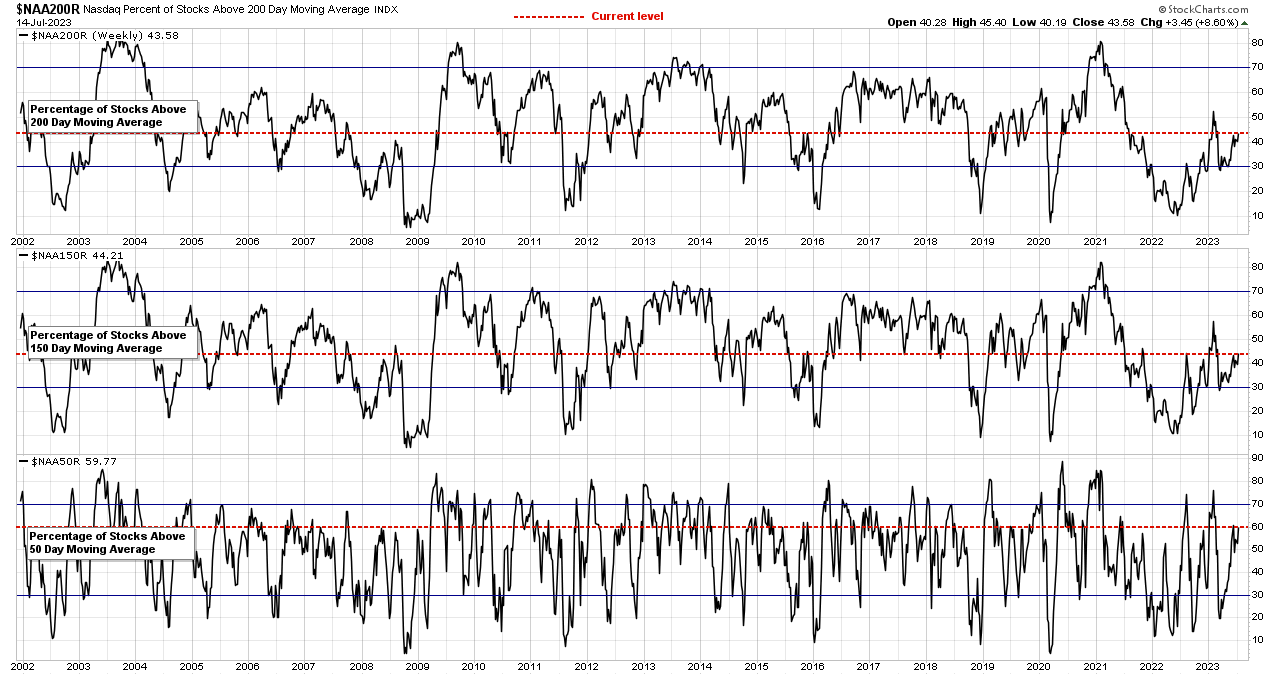
Market Breadth: Percentage of Stocks Above their 50 Day, 150 Day & 200 Day Moving Averages Combined
Custom Percentage of Stocks Above Their 50 Day, 150 Day & 200 Day Moving Averages Combined Market Breadth Charts for the Overall US Market, NYSE and Nasdaq for Market Timing and Strategy.
Read More
14 July, 2023
US Stocks Industry Groups Relative Strength Rankings
The purpose of the Relative Strength (RS) tables is to track the short, medium and long term RS changes of the individual groups to find the new leadership earlier than the crowd...
Read More

