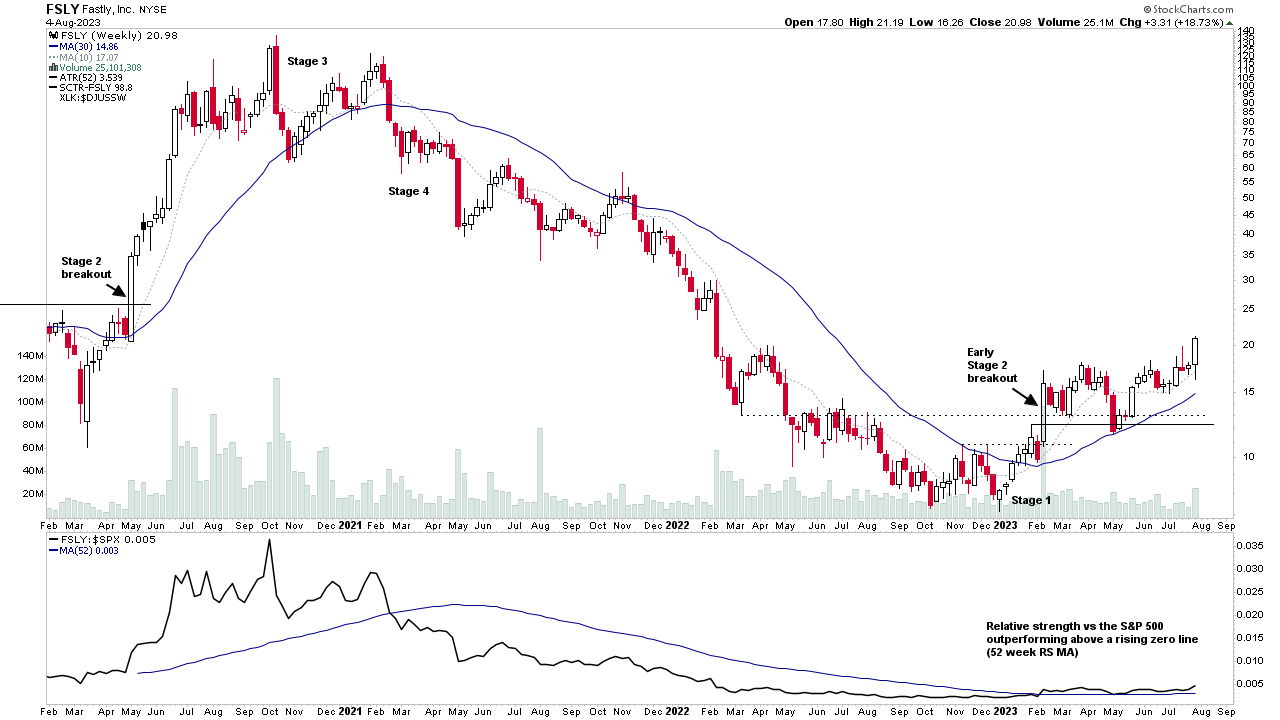
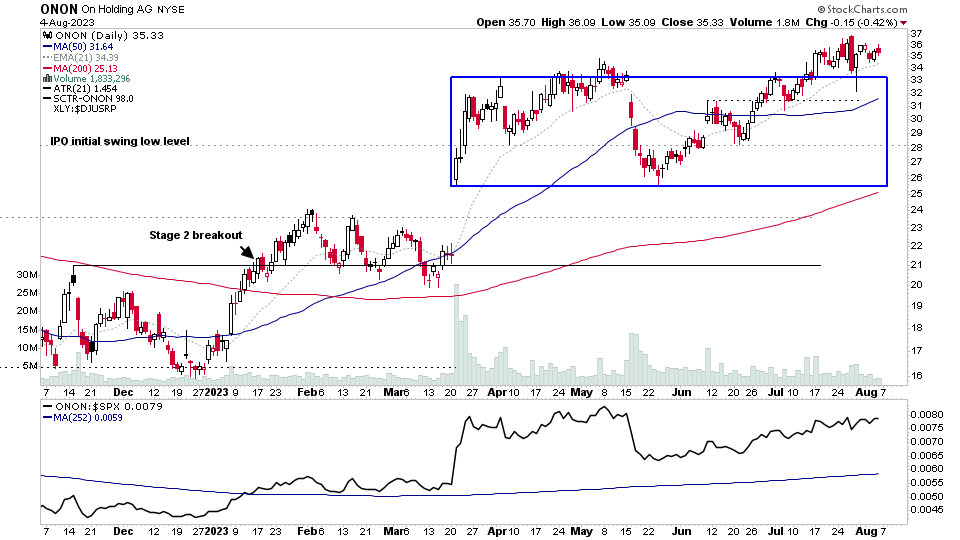
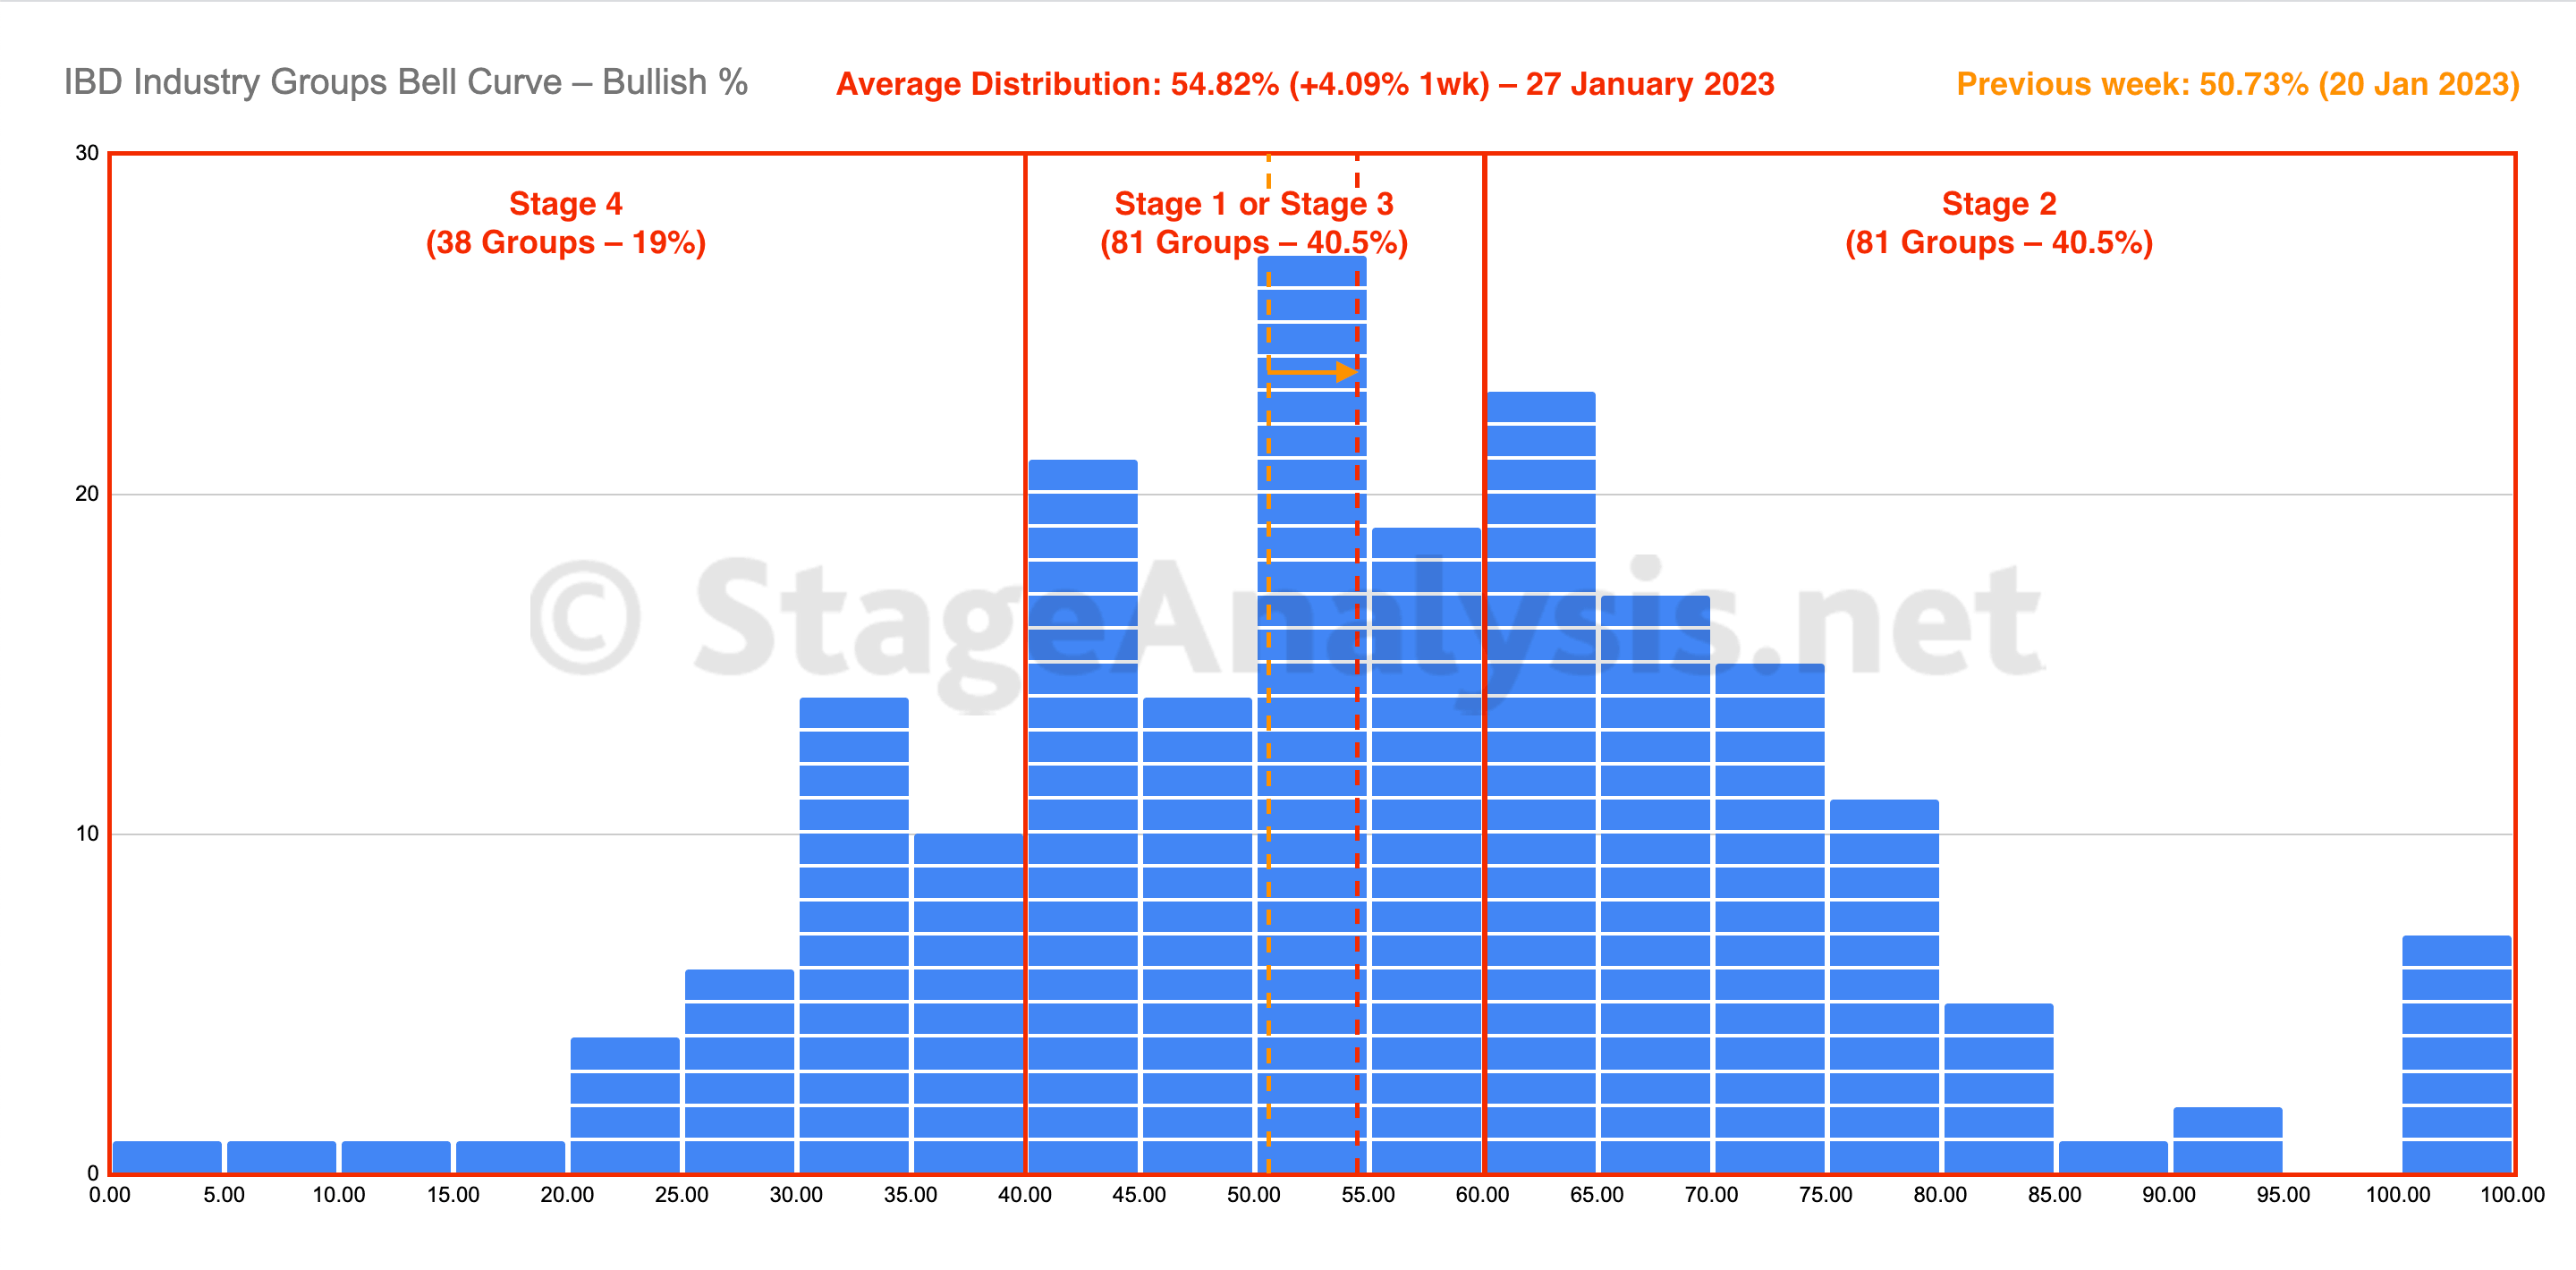
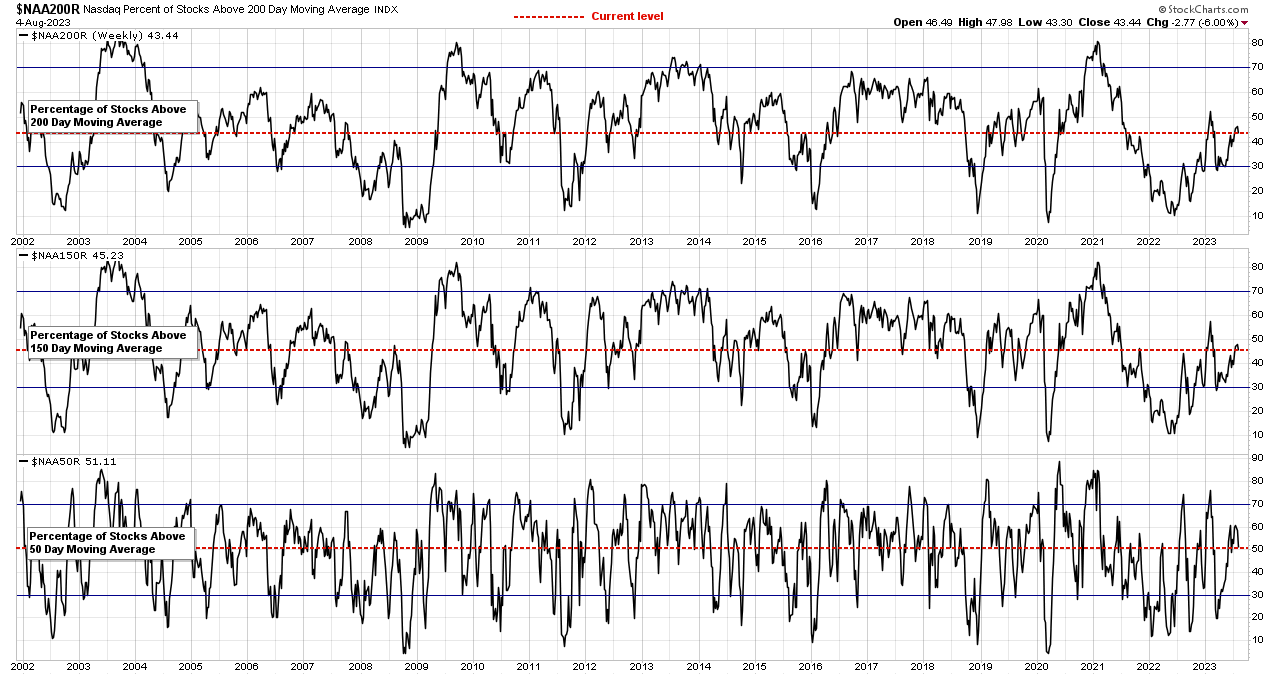
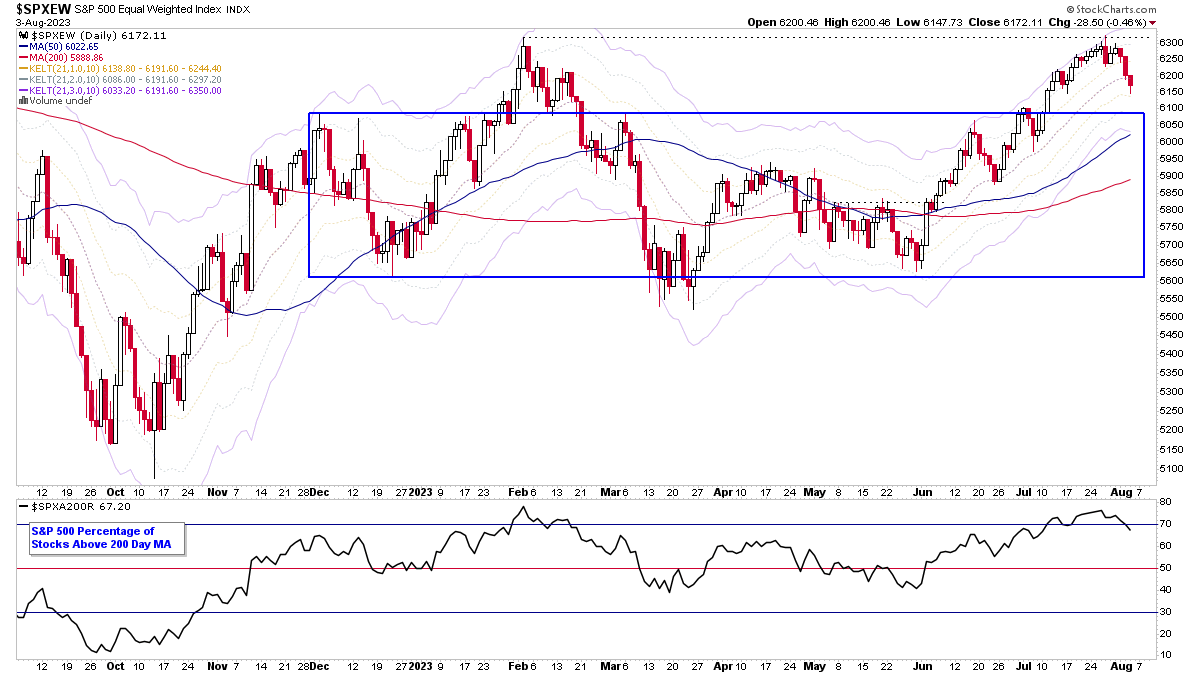
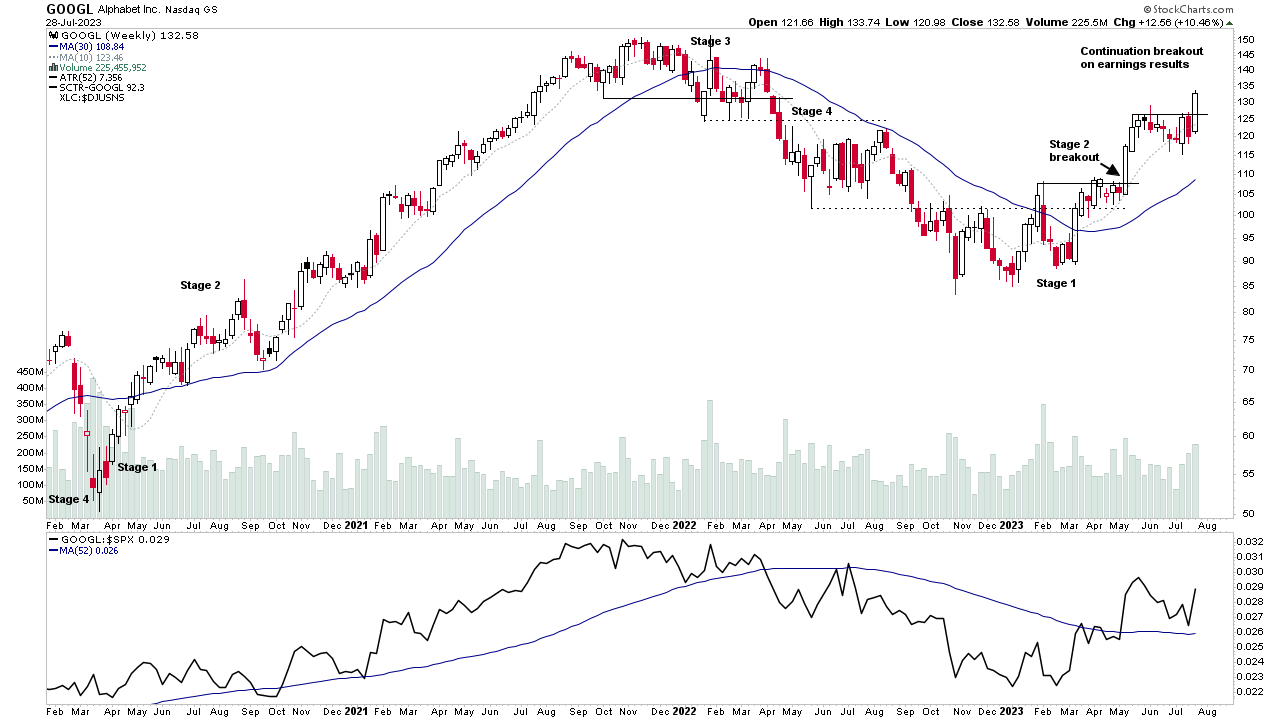
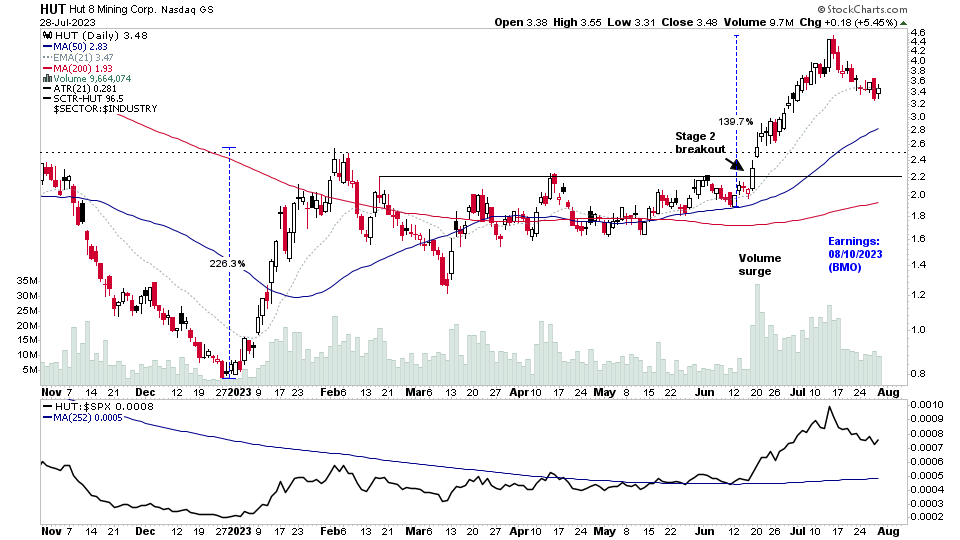
Stage Analysis members video discussing some of the weeks strongest volume movers in Stage 2, as well as all the usual member content, i.e. Major Indexes Update, Futures SATA Charts, Industry Groups RS Rankings, IBD Industry Group Bell Curve – Bullish Percent, Market Breadth Update to determine the Weight of Evidence and finishing with analysis of the recent watchlist stocks in detail on multiple timeframes.
Read More
Blog
06 August, 2023
Stage Analysis Members Video – 6 August 2023 (1hr 28mins)
06 August, 2023
US Stocks Watchlist – 6 August 2023
There were 18 stocks highlighted from the US stocks watchlist scans today...
Read More
05 August, 2023
IBD Industry Groups Bell Curve – Bullish Percent
The IBD Industry Groups Bell Curve – Bullish Percent shows the few hundred industry groups plotted as a histogram chart and represents the percentage of stocks in each group that are on a point & figure (P&F) buy signal. This information provides a snapshot of the overall market health in a unique way, and is particularly useful for both market timing strategies and as a tool in aiding with the Stage Analysis methods "Forest to the Trees" approach, where we look for developing group themes...
Read More
05 August, 2023
Market Breadth: Percentage of Stocks Above their 50 Day, 150 Day & 200 Day Moving Averages Combined
Custom Percentage of Stocks Above Their 50 Day, 150 Day & 200 Day Moving Averages Combined Market Breadth Charts for the Overall US Market, NYSE and Nasdaq for Market Timing and Strategy.
Read More
04 August, 2023
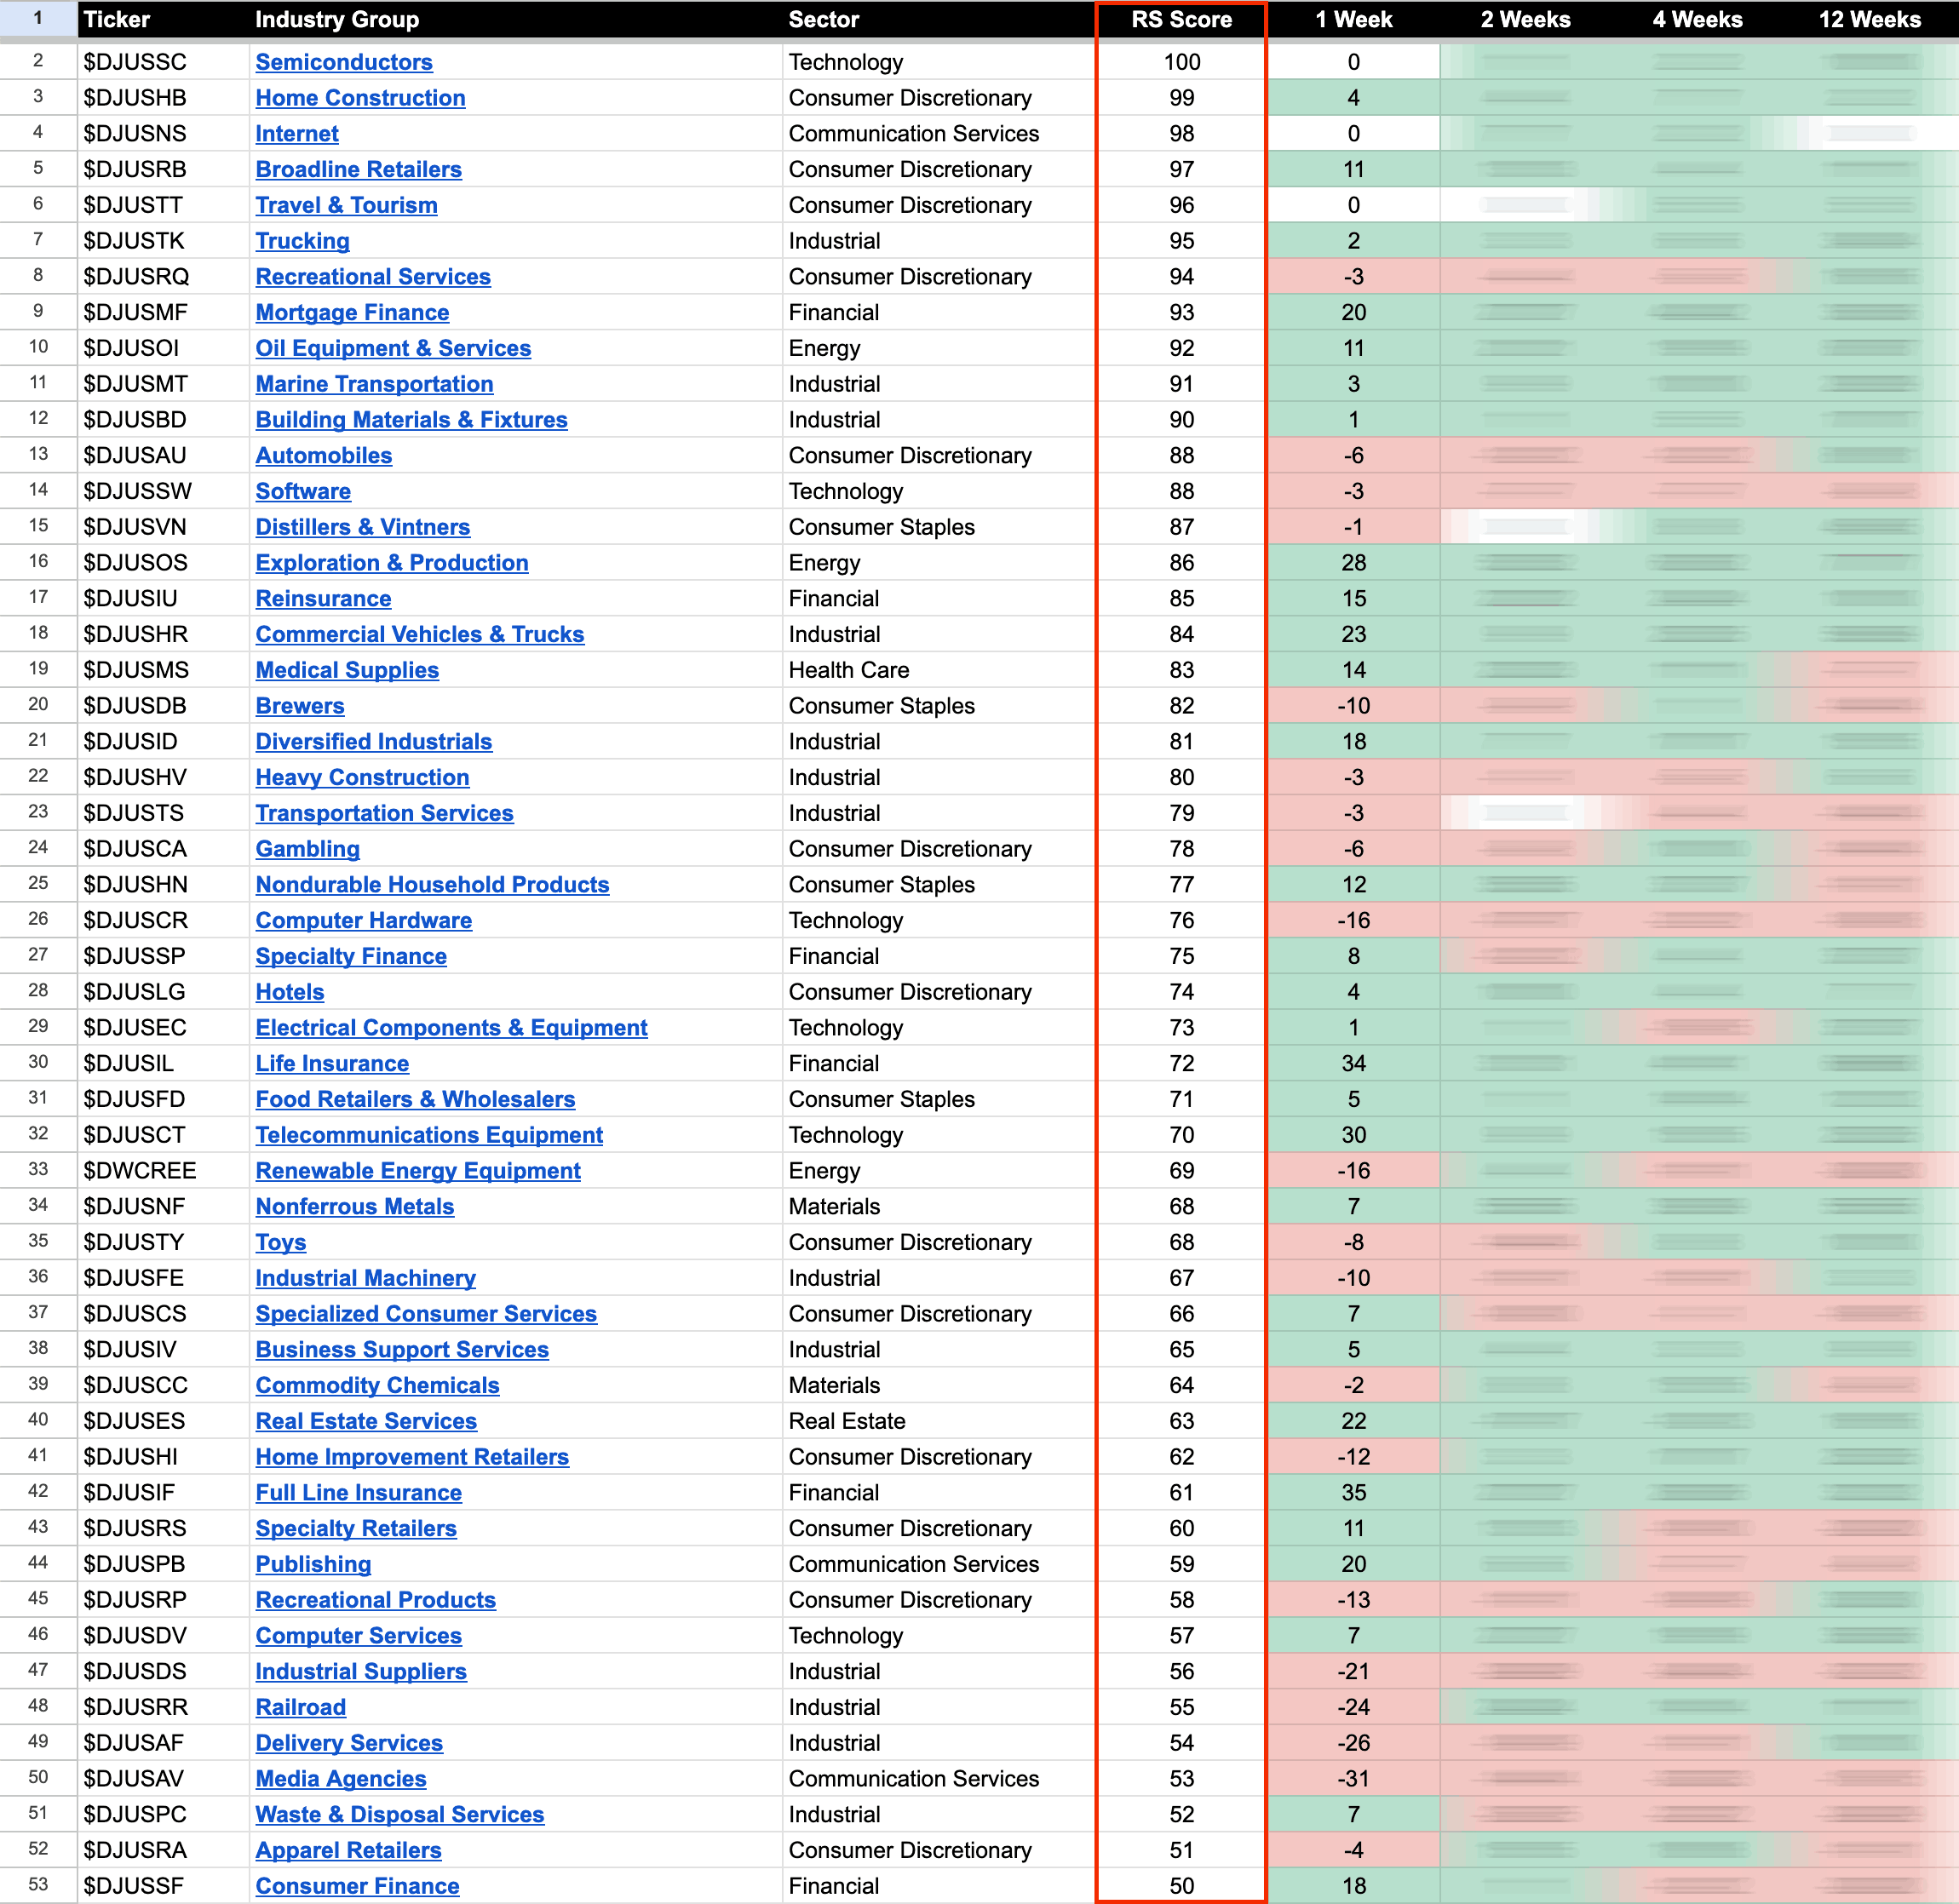
US Stocks Industry Groups Relative Strength Rankings
The purpose of the Relative Strength (RS) tables is to track the short, medium and long term RS changes of the individual groups to find the new leadership earlier than the crowd...
Read More
03 August, 2023
US Stocks Watchlist – 3 August 2023
There were 22 stocks highlighted from the US stocks watchlist scans today...
Read More
01 August, 2023
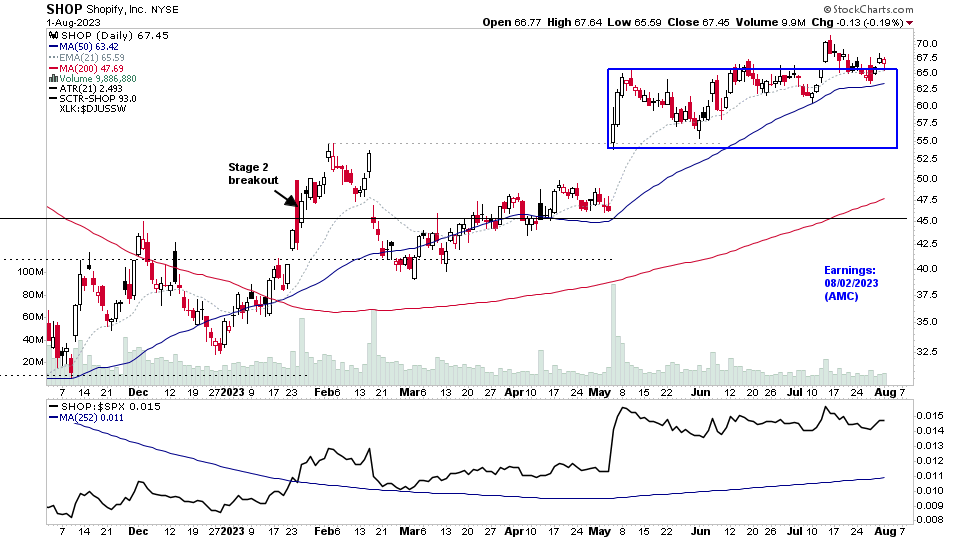
US Stocks Watchlist – 1 August 2023
There were 30 stocks highlighted from the US stocks watchlist scans today...
Read More
31 July, 2023
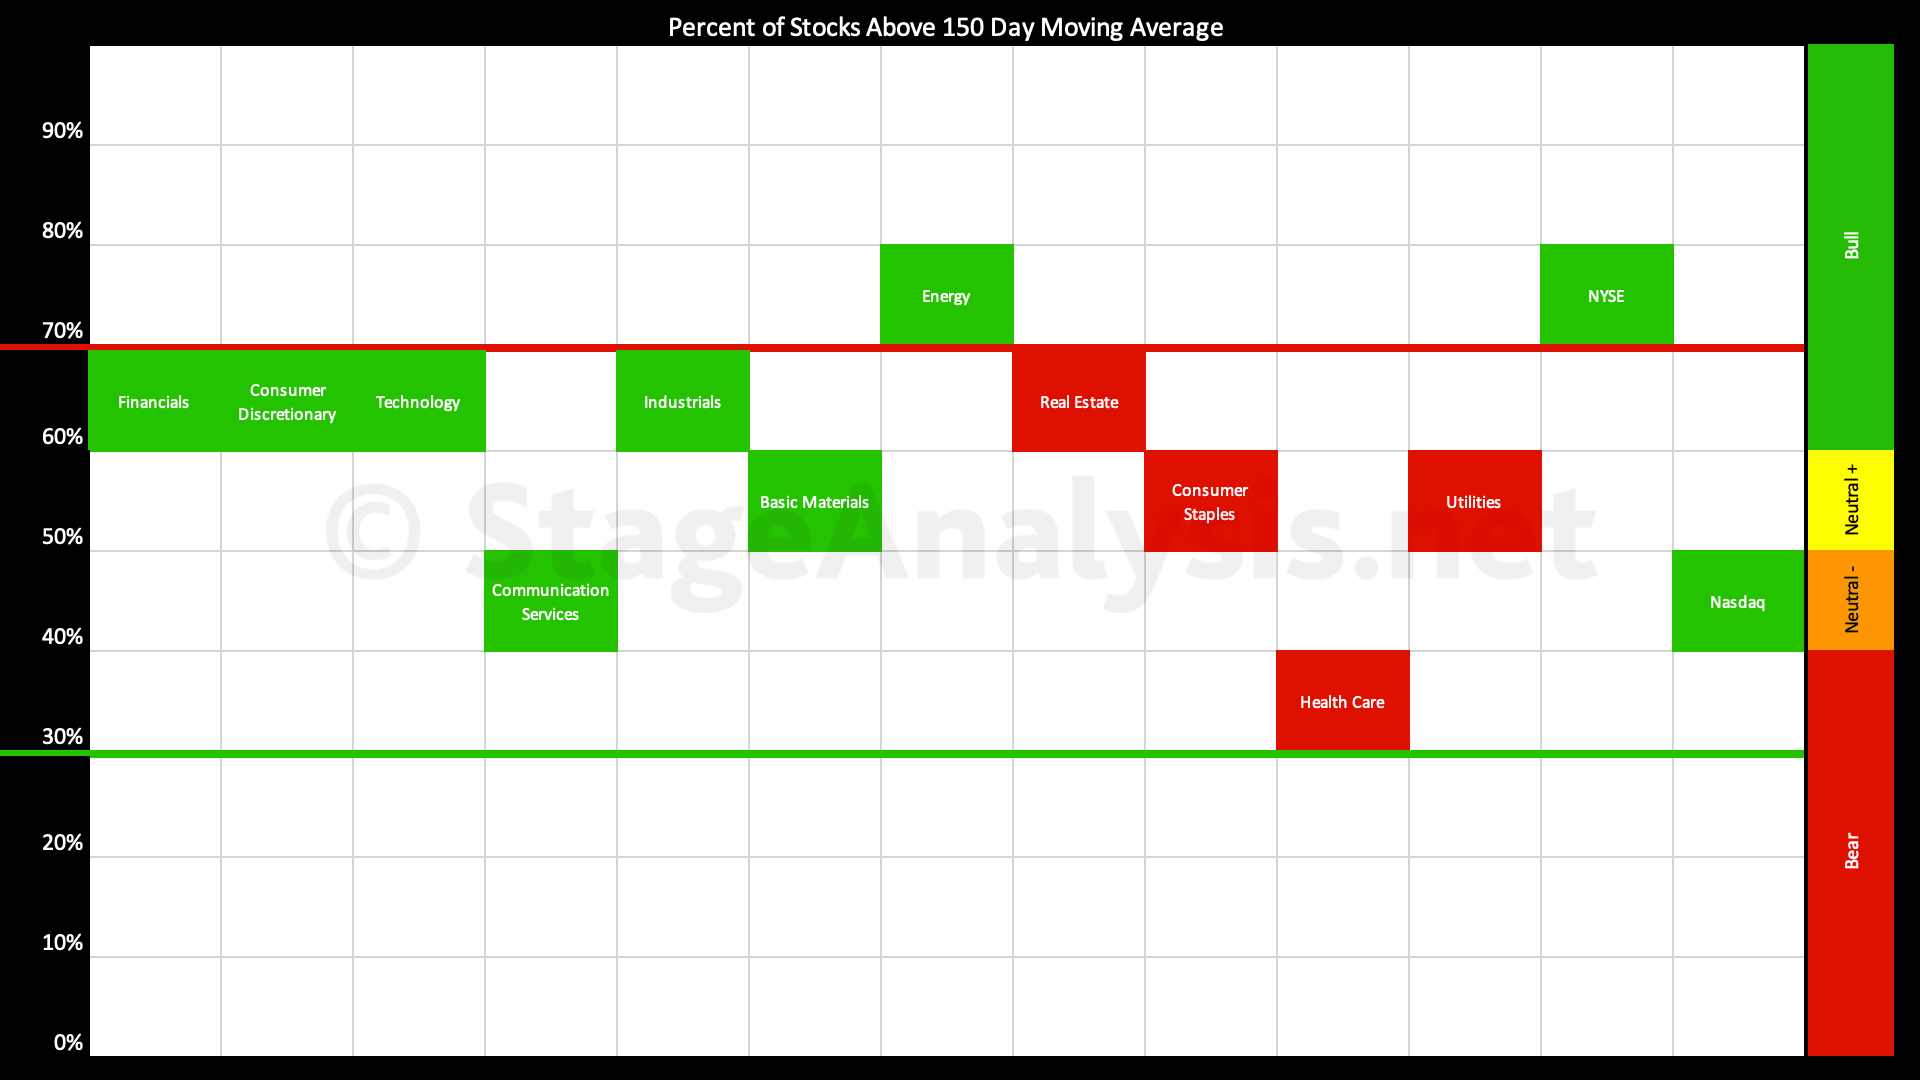
Sector Breadth: Percentage of US Stocks Above Their 150 day (30 Week) Moving Averages
The Percentage of US Stocks Above Their 150 day Moving Averages in the 11 major sectors has improved by +5.59% over the last few weeks since the previous post on the 17th July 2023, moving the overall average up to 59.38%...
Read More
30 July, 2023
Stage Analysis Members Video – 30 July 2023 (1hr 21mins)
Stage Analysis members video this week begins with analysis of some of the weeks Stage 2 stocks moving on volume, followed by the major US indexes and futures charts, as well as the Industry Groups Relative Strength (RS) Rankings, the IBD Industry Group Bell Curve – Bullish Percent, the Market Breadth Update to help to determine the Weight of Evidence, and to finish a look at some of the recent stocks highlighted in the watchlist in detail.
Read More
30 July, 2023
US Stocks Watchlist – 30 July 2023
There were 26 stocks highlighted from the US stocks watchlist scans today...
Read More

