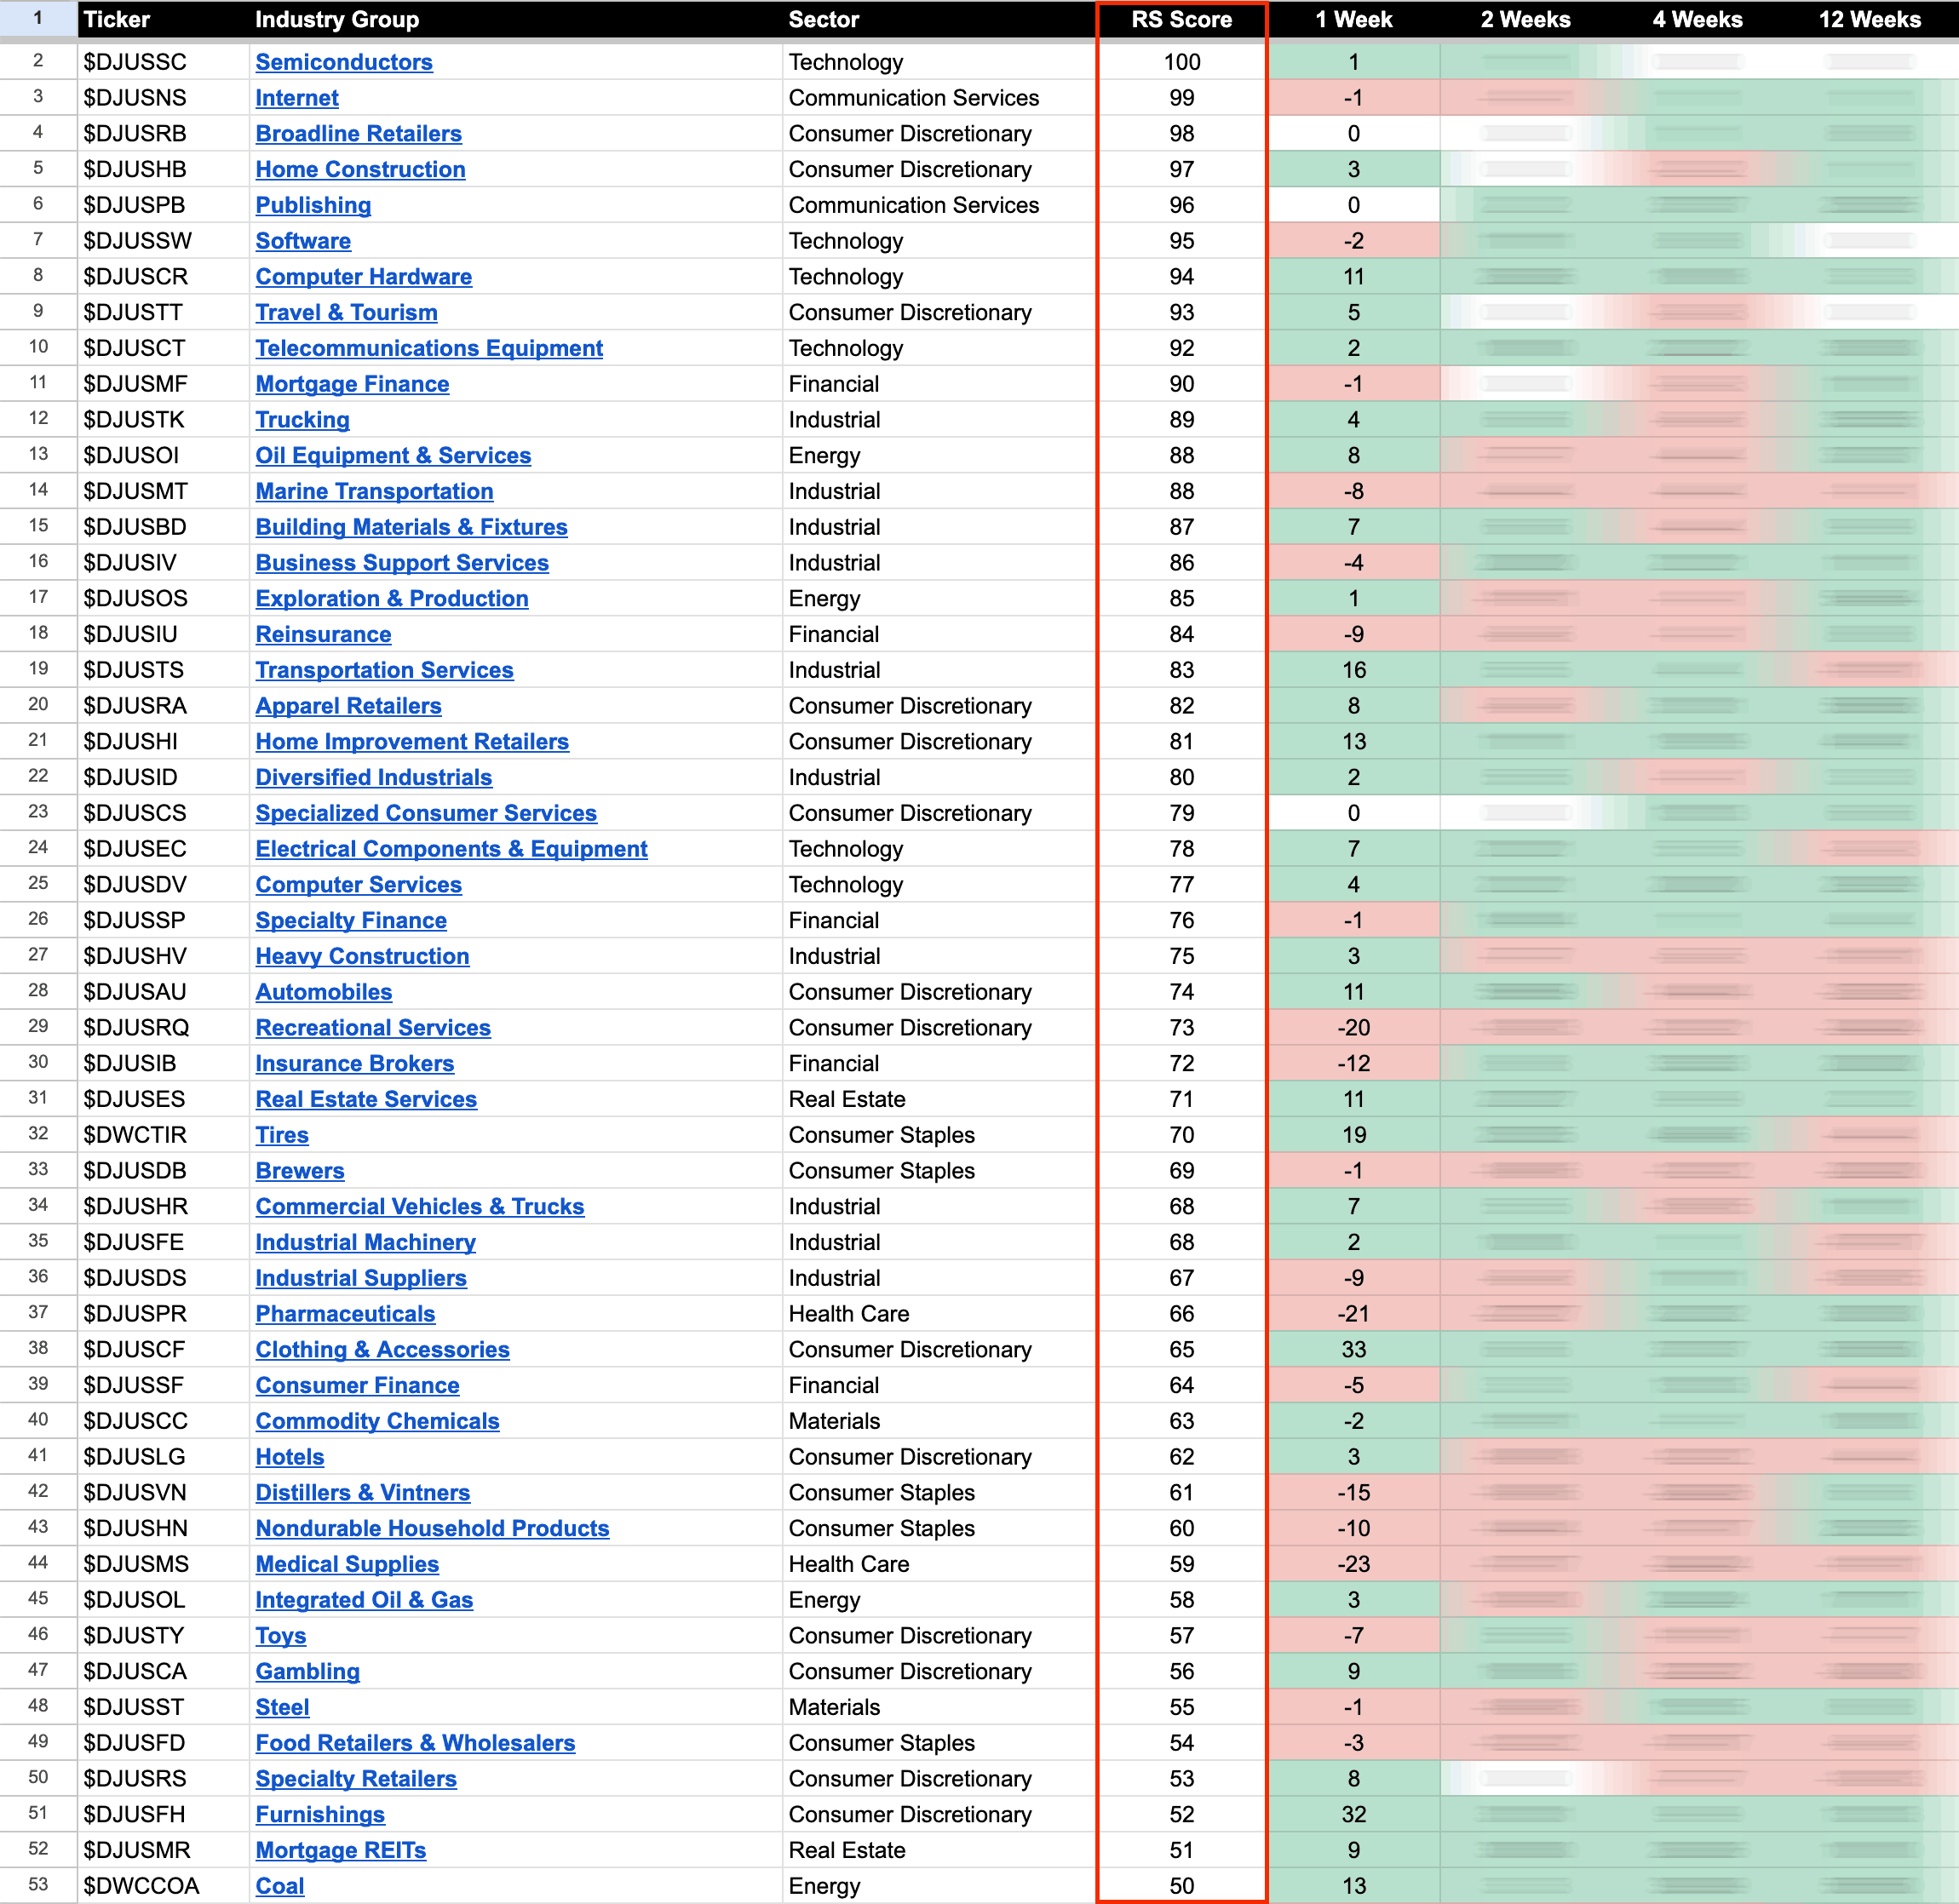
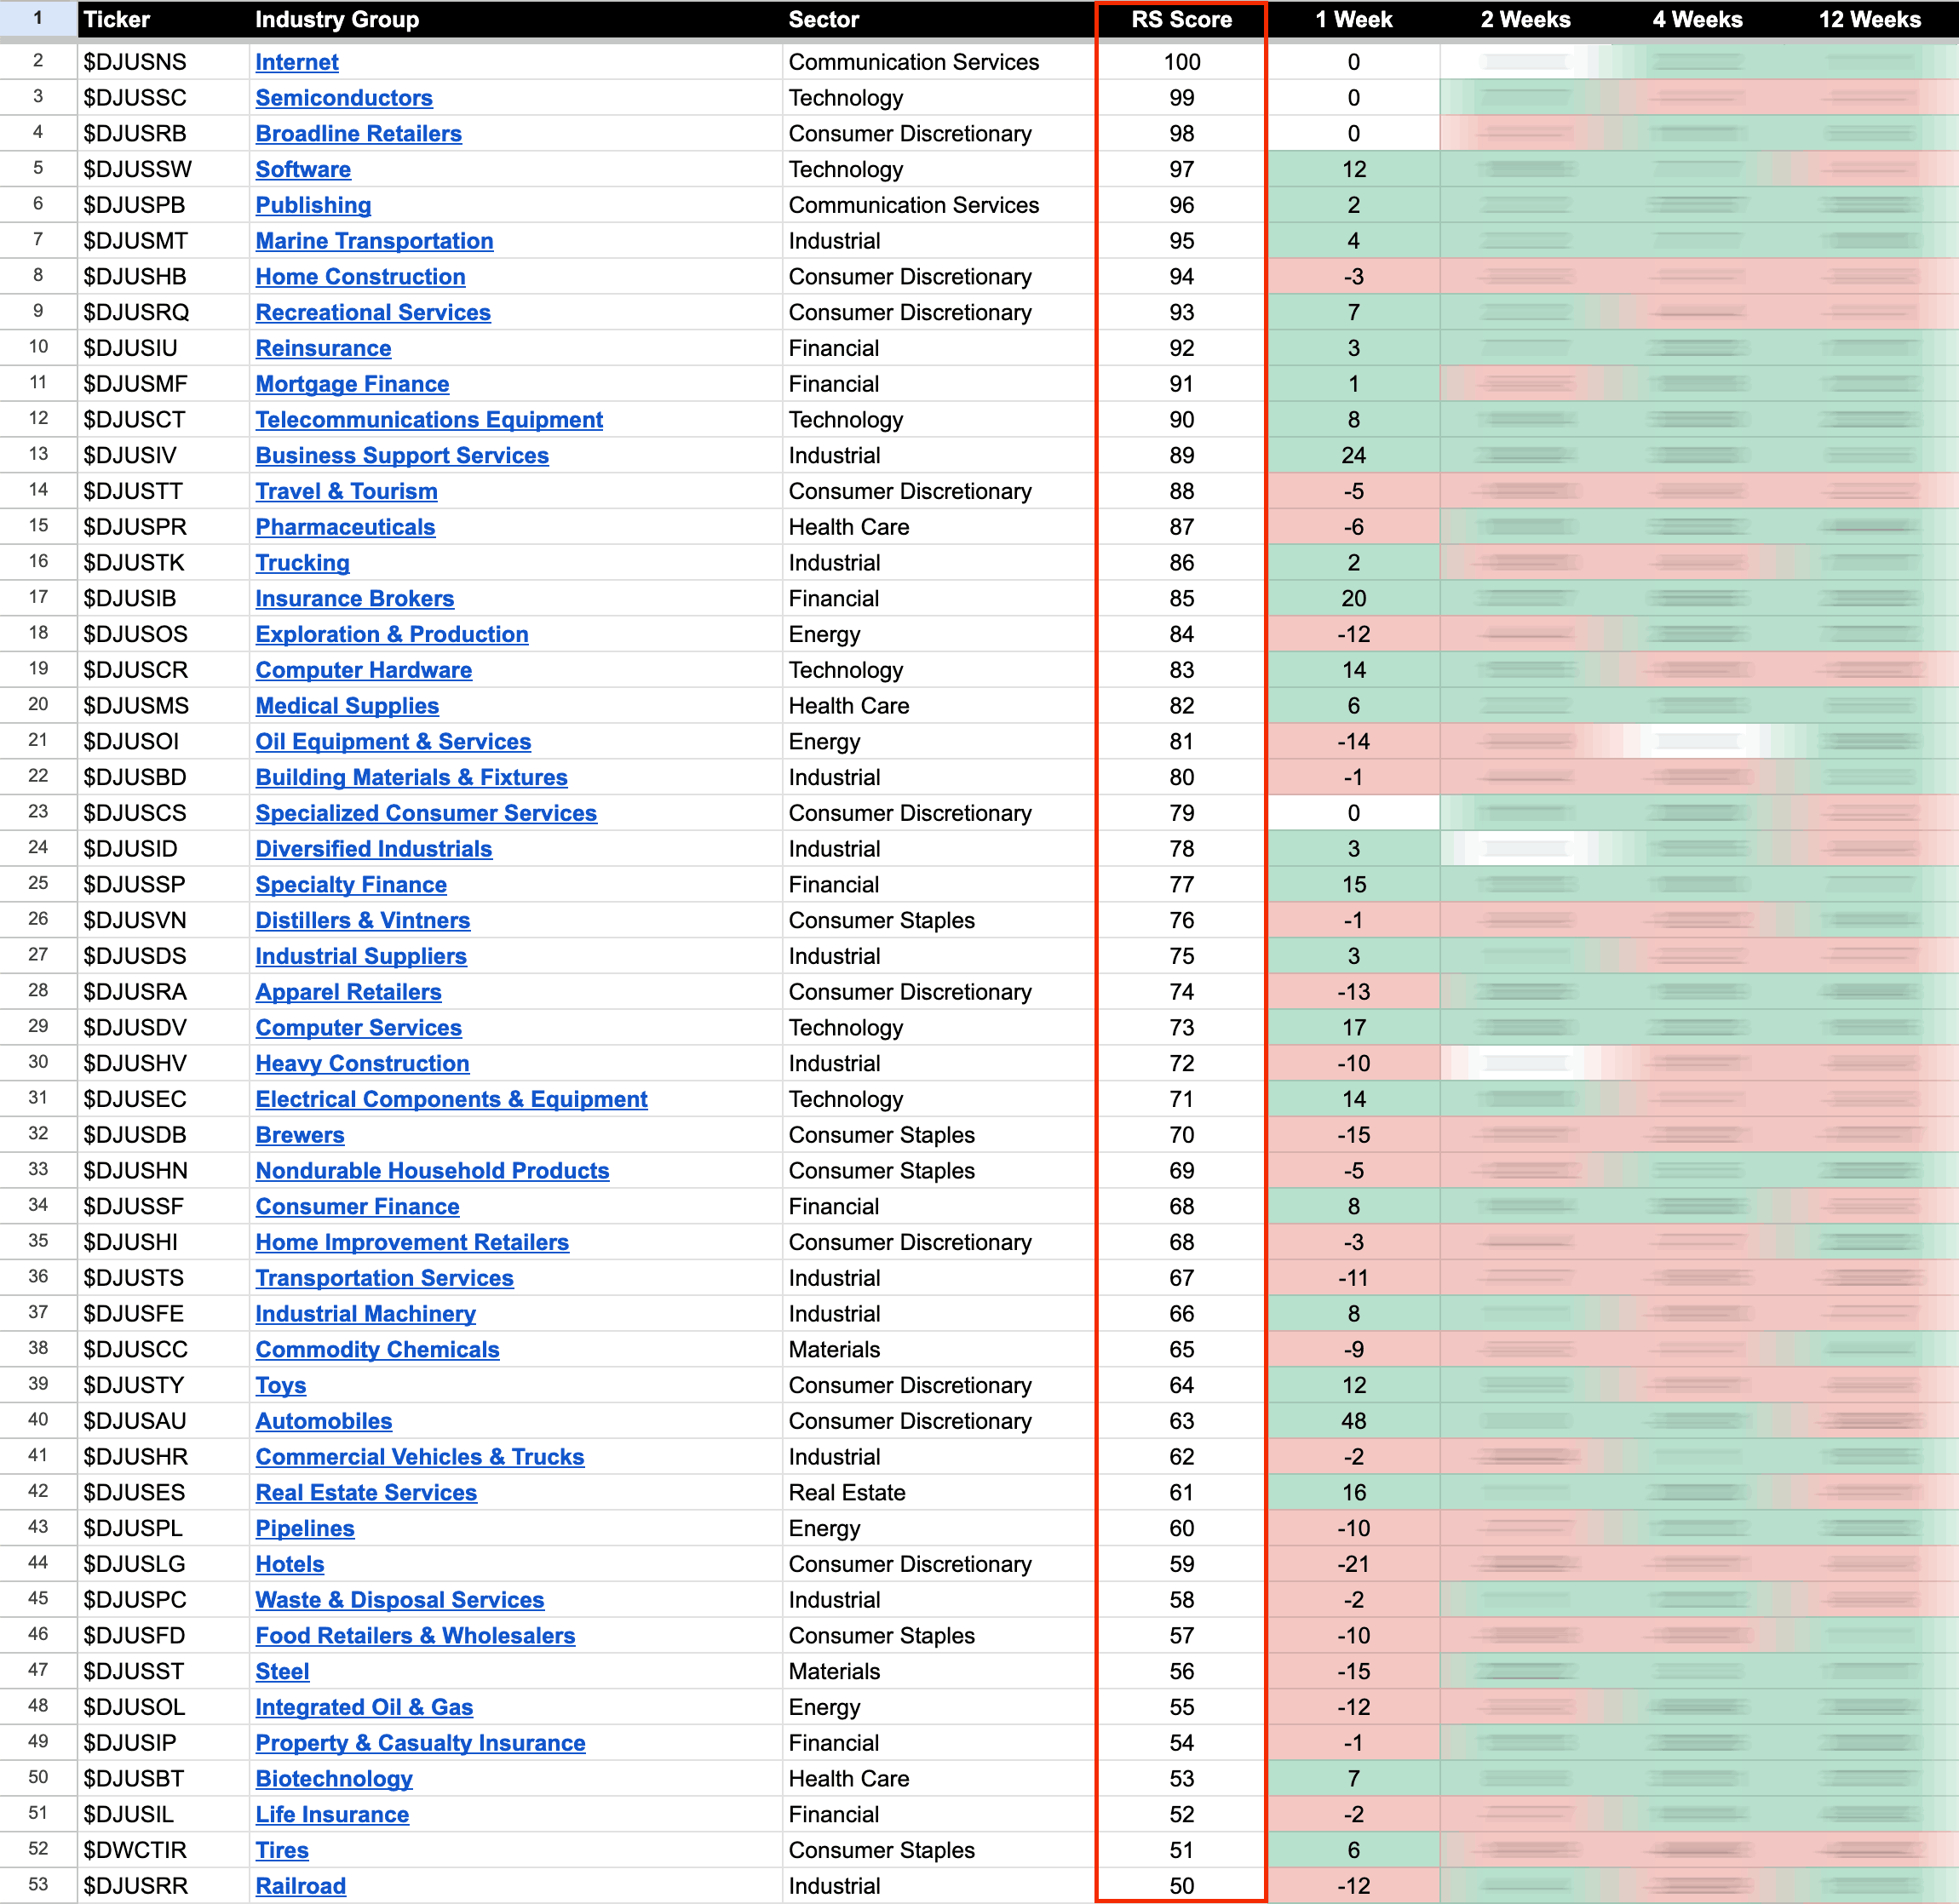
The purpose of the Relative Strength (RS) tables is to track the short, medium and long term RS changes of the individual groups to find the new leadership earlier than the crowd...
Read More
Blog
01 September, 2023
US Stocks Industry Groups Relative Strength Rankings
31 August, 2023
US Stocks Watchlist – 31 August 2023
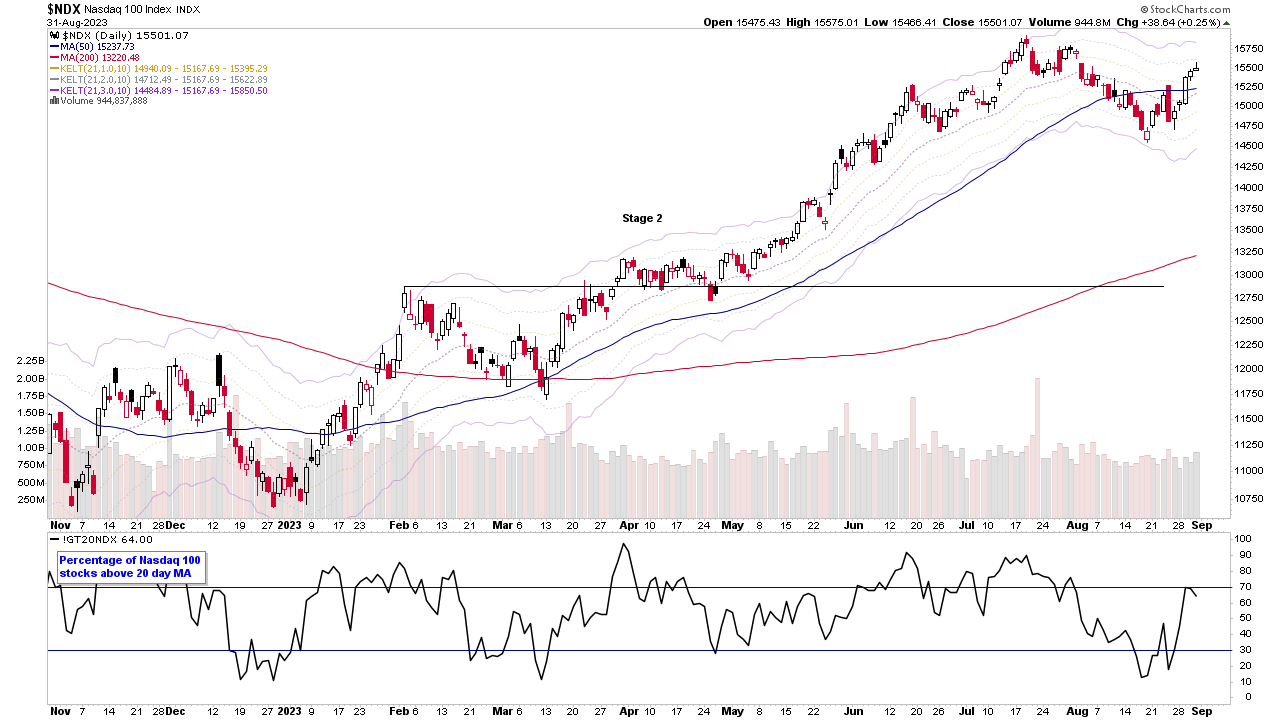
The strength this week has taken the Nasdaq 100 back above its 50 day MA and +1x ATR(21 day) level, which we use to help to determine the short-term trend. As if the rebound rally attempt is real, and not just an Upthrust, then the expectation would be for it to hold the 50 day MA and Tuesdays Significant Bar on any retest in the coming days...
Read More
30 August, 2023
Stage Analysis Members Video – 30 August 2023 (37mins)
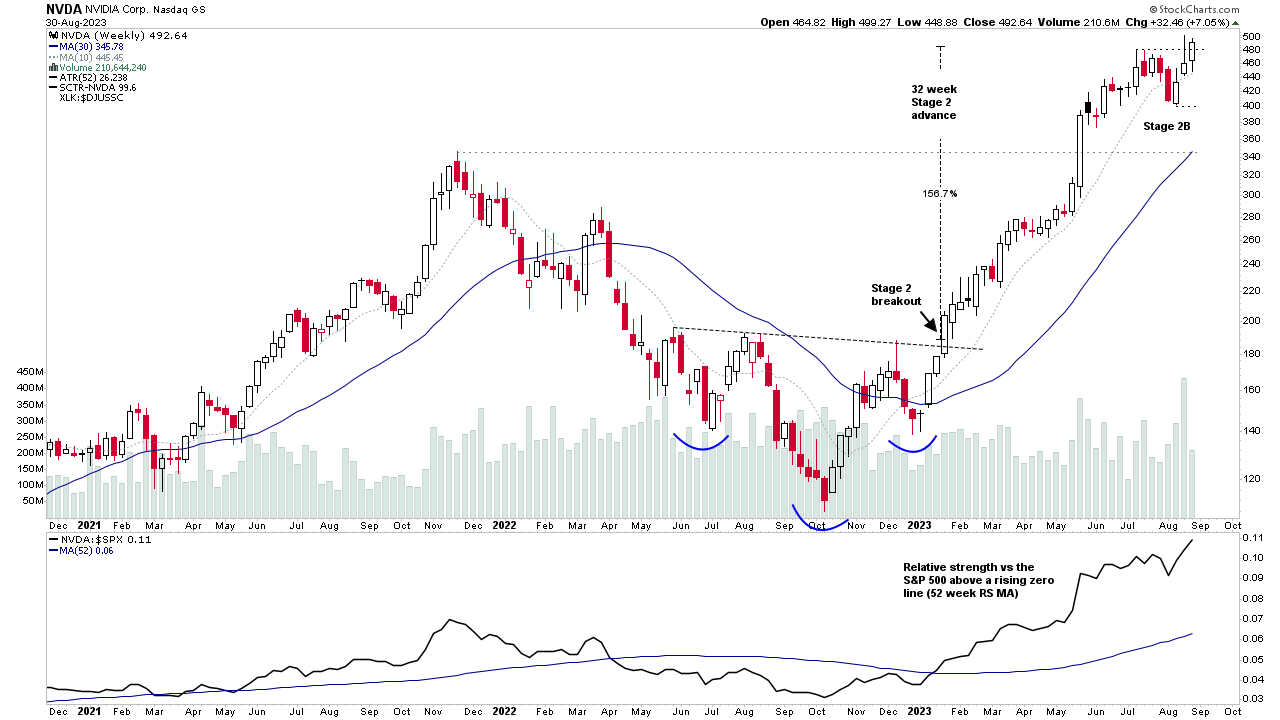
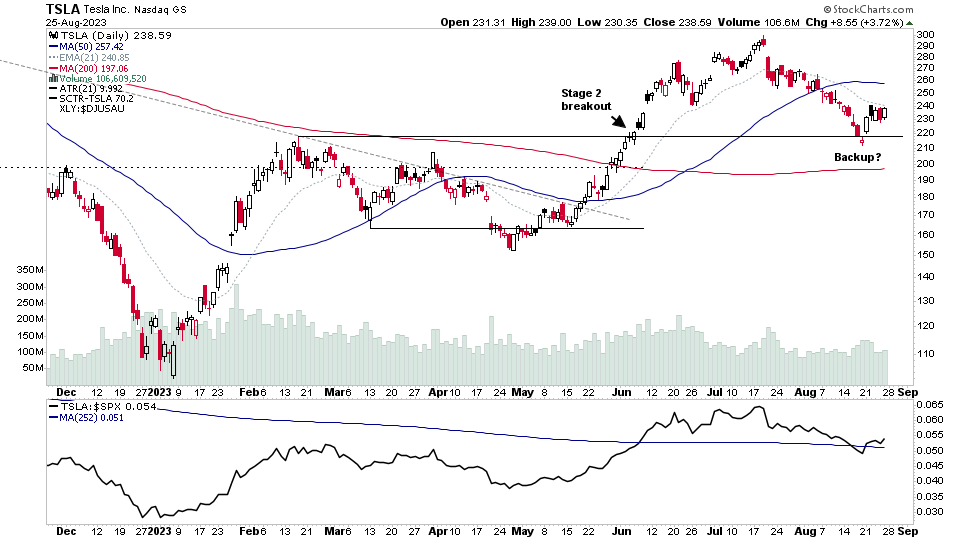
Stage Analysis midweek video discussing the mega cap stocks in detail on multiple timeframes to determine their Stages following the recent correction and hence potential impact on the market. Followed by analysis of the S&P 500 and multiple market breadth measures of its internals.
Read More
29 August, 2023
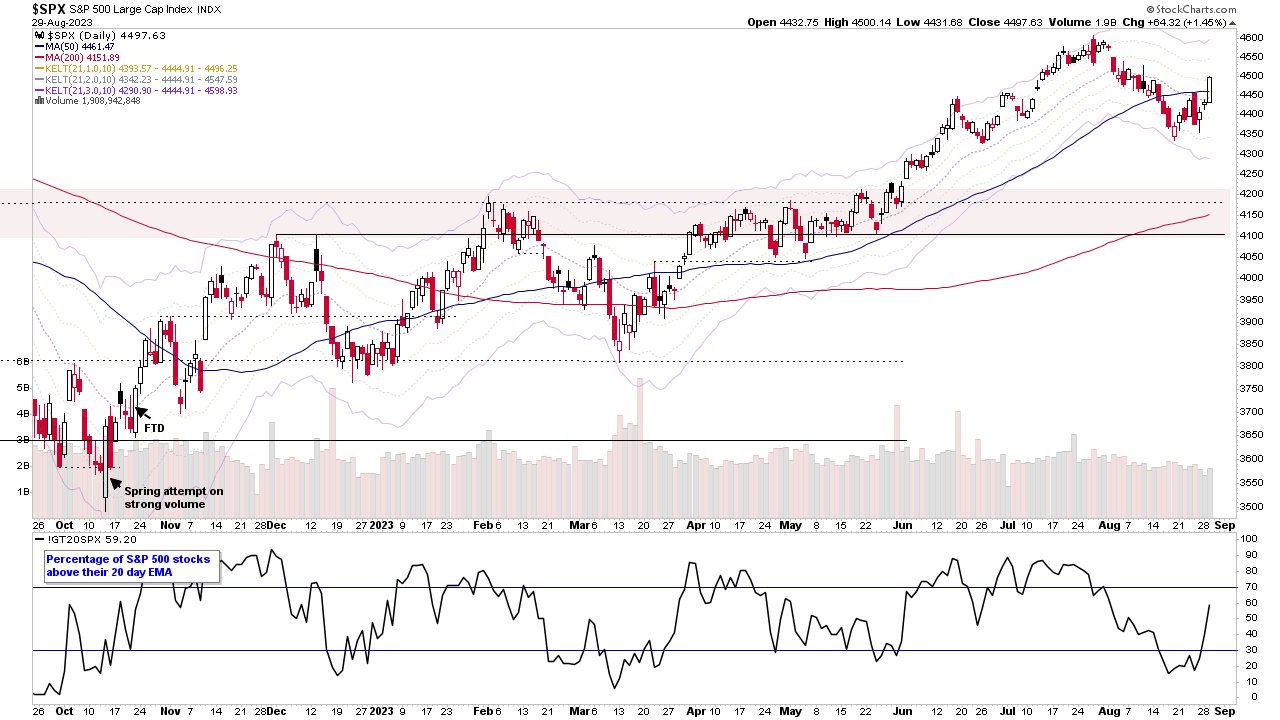
Short-term Market Breadth Improvement and the US Stocks Watchlist – 29 August 2023
There were 28 stocks highlighted from the US stocks watchlist scans today...
Read More
28 August, 2023
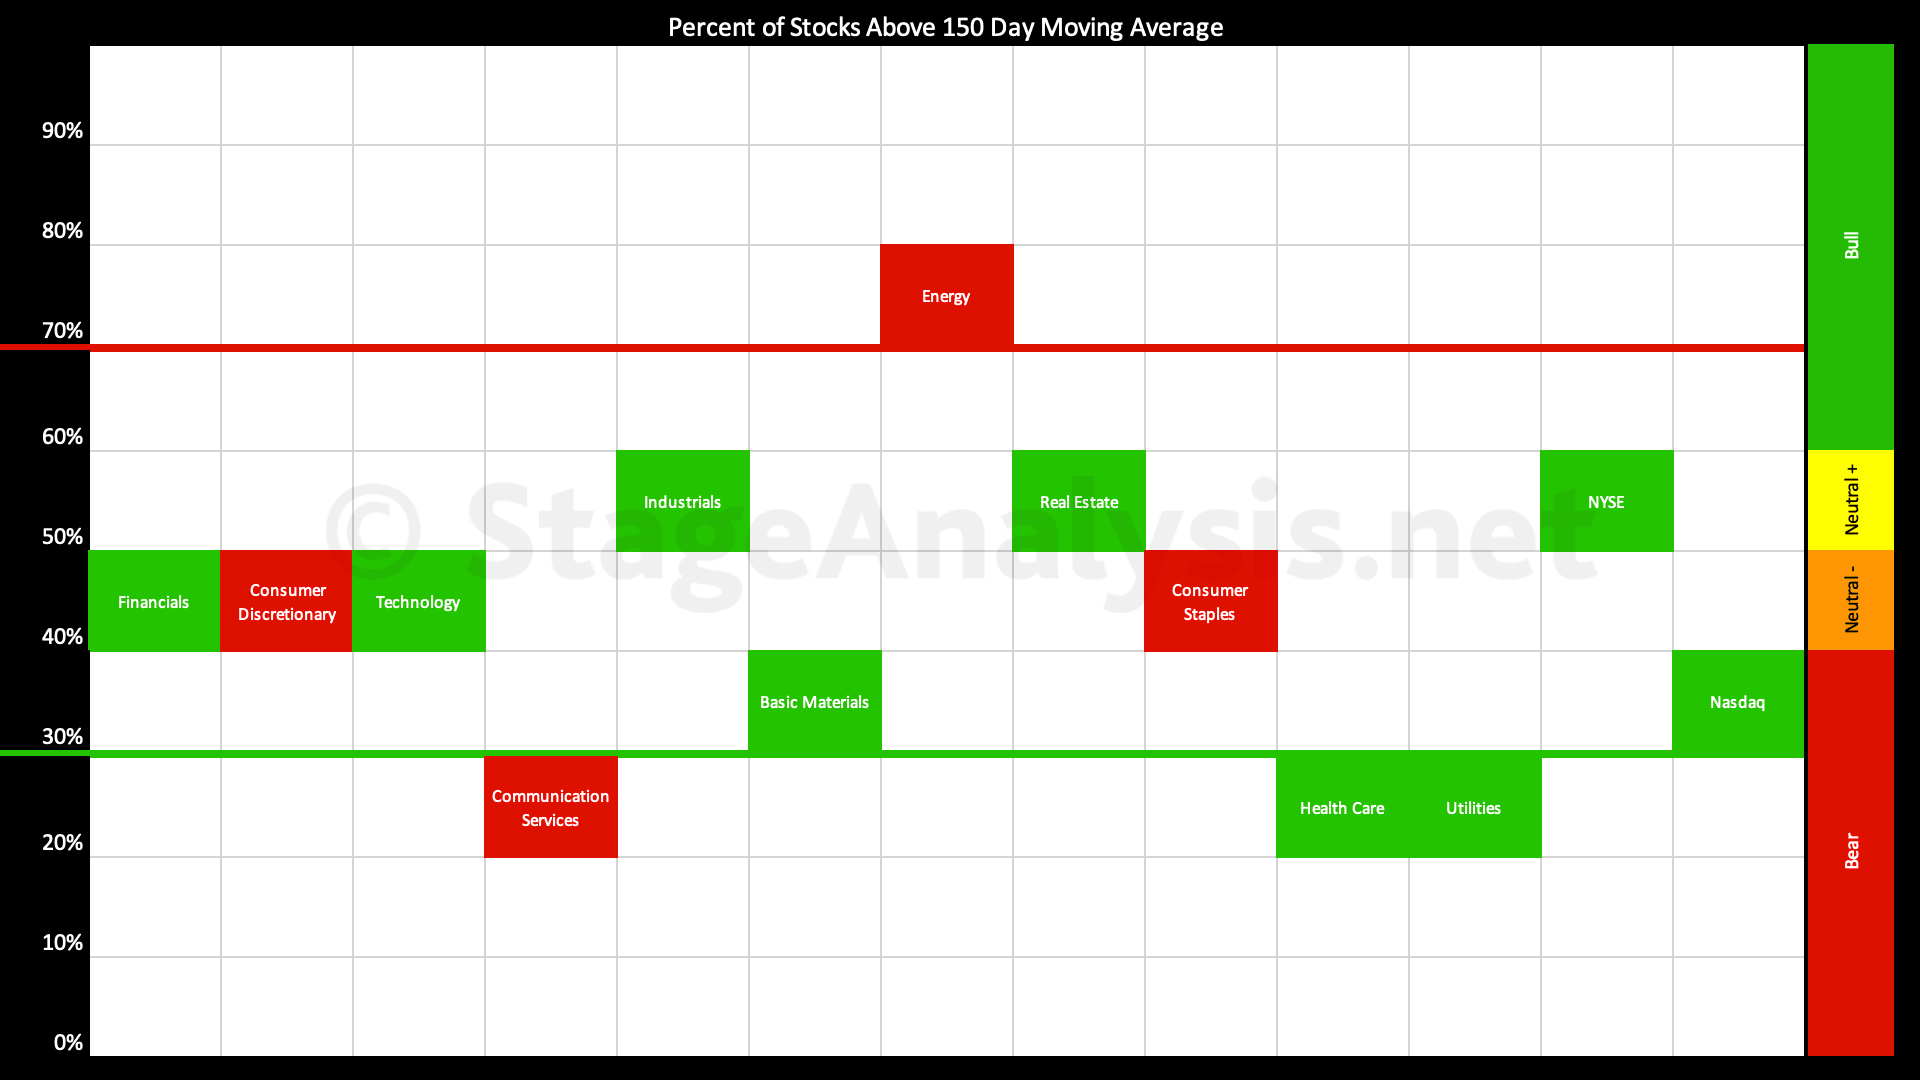
Sector Breadth: Percentage of US Stocks Above Their 150 day (30 Week) Moving Averages
The Percentage of US Stocks Above Their 150 day Moving Averages in the 11 major sectors continued lower by -4.31% over the last few weeks since the previous post on the 14th August 2023, moving the overall average down to 43.11%, which is still the Neutral- zone in the lower middle of the field...
Read More
27 August, 2023
Stage Analysis Members Video – 27 August 2023 (1hr 17mins)
The Stage Analysis members video with all of the regular coverage of the market, industry groups and stocks and the essential breadth measures that we use in the Stage Analysis method to determine the Weight of Evidence.
Read More
27 August, 2023
US Stocks Watchlist – 27 August 2023
There were 23 stocks highlighted from the US stocks watchlist scans today...
Read More
26 August, 2023
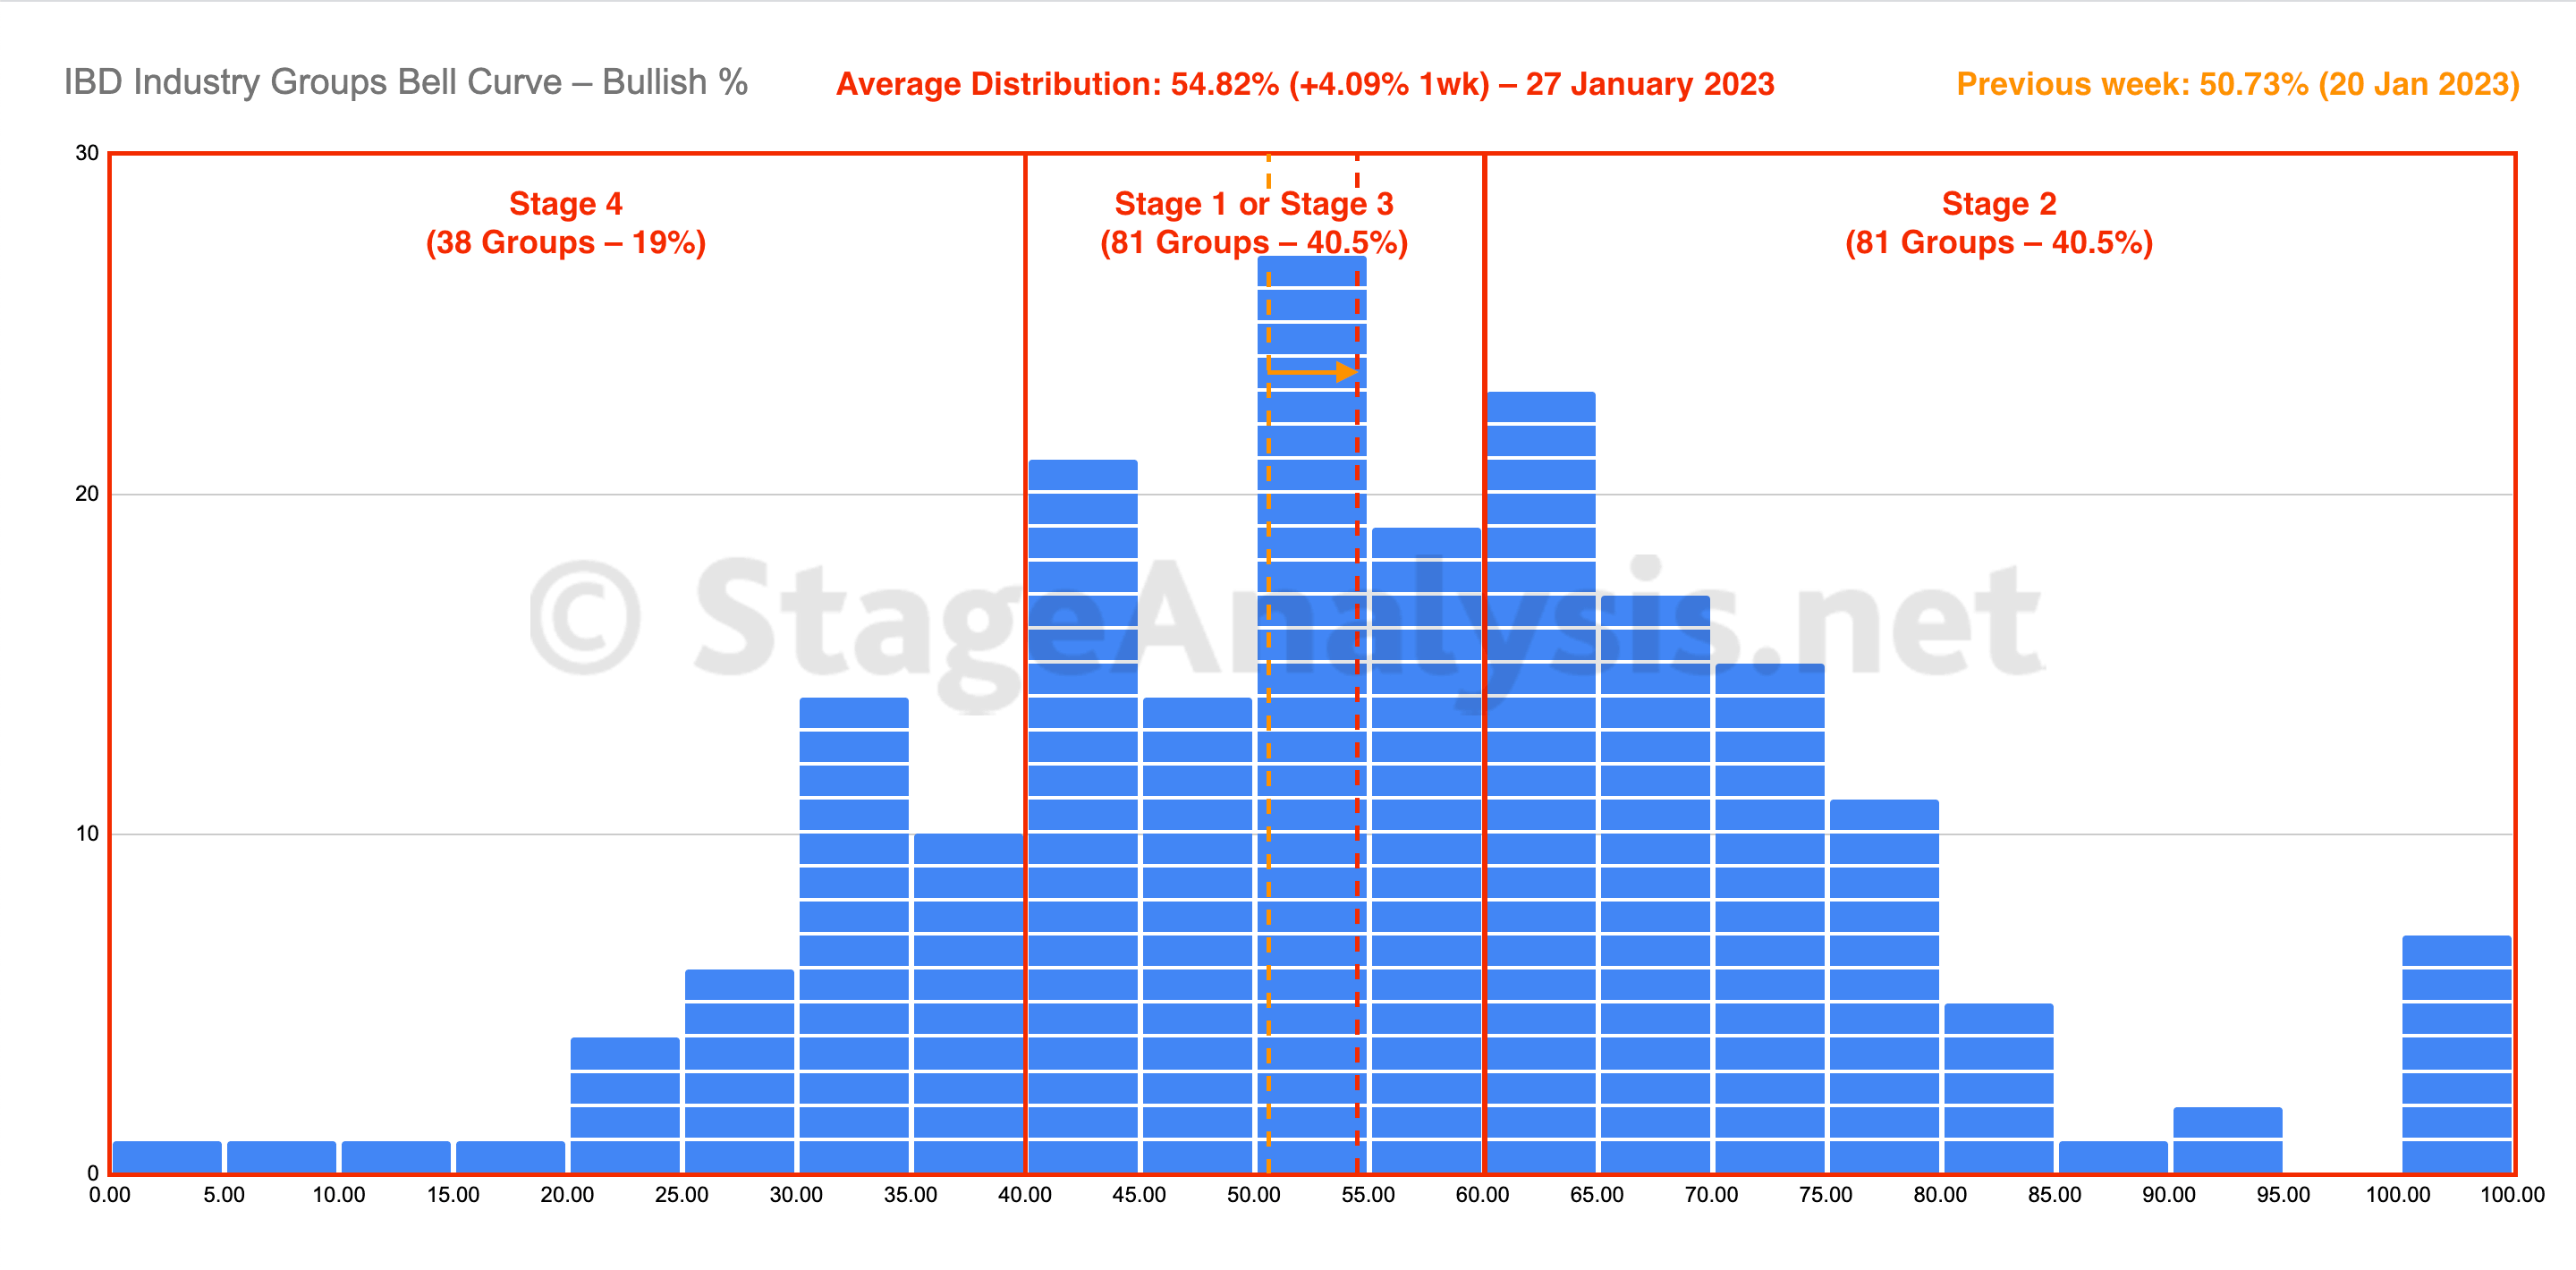
IBD Industry Groups Bell Curve – Bullish Percent
The IBD Industry Groups Bell Curve – Bullish Percent shows the few hundred industry groups plotted as a histogram chart and represents the percentage of stocks in each group that are on a point & figure (P&F) buy signal. This information provides a snapshot of the overall market health in a unique way, and is particularly useful for both market timing strategies and as a tool in aiding with the Stage Analysis methods "Forest to the Trees" approach, where we look for developing group themes...
Read More
26 August, 2023
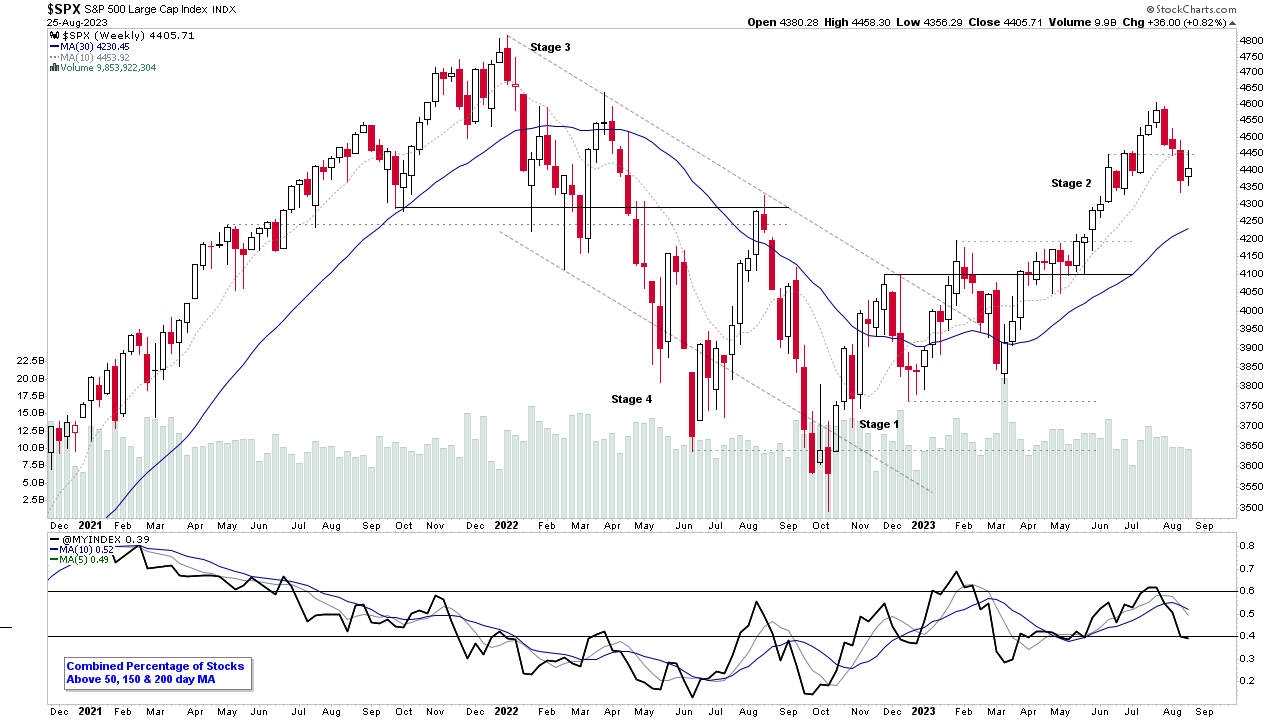
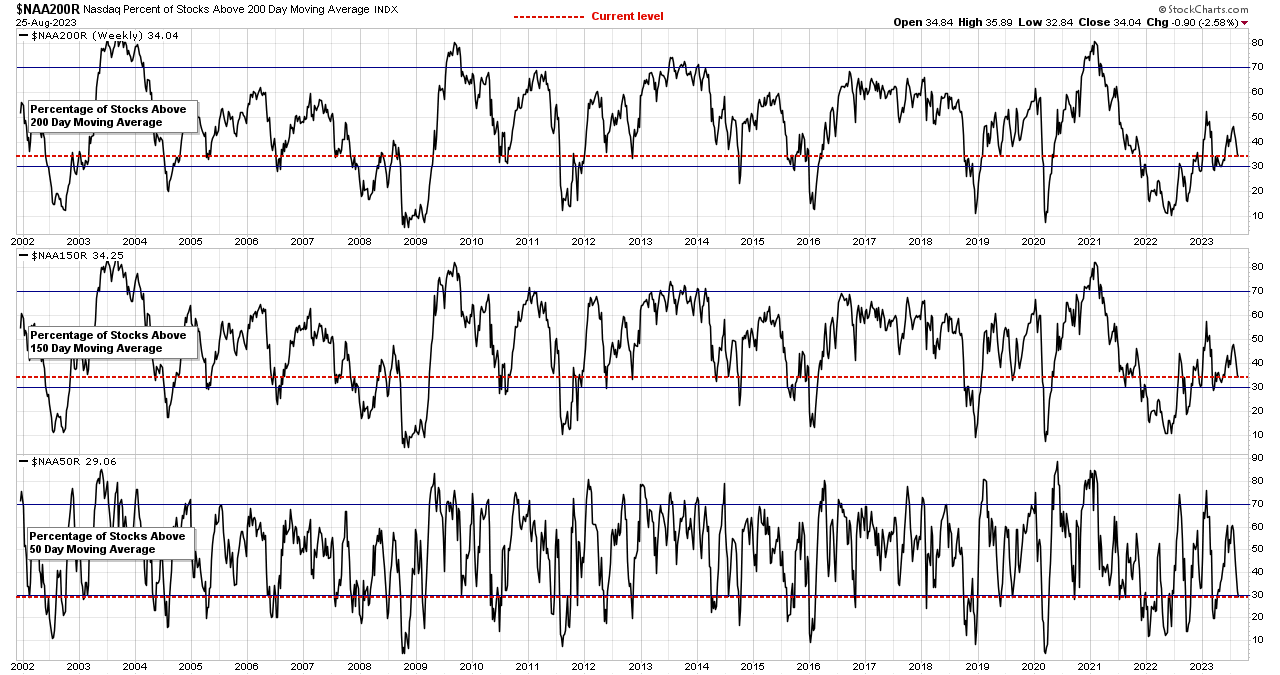
Market Breadth: Percentage of Stocks Above their 50 Day, 150 Day & 200 Day Moving Averages Combined
Custom Percentage of Stocks Above Their 50 Day, 150 Day & 200 Day Moving Averages Combined Market Breadth Charts for the Overall US Market, NYSE and Nasdaq for Market Timing and Strategy.
Read More
25 August, 2023
US Stocks Industry Groups Relative Strength Rankings
The purpose of the Relative Strength (RS) tables is to track the short, medium and long term RS changes of the individual groups to find the new leadership earlier than the crowd...
Read More

