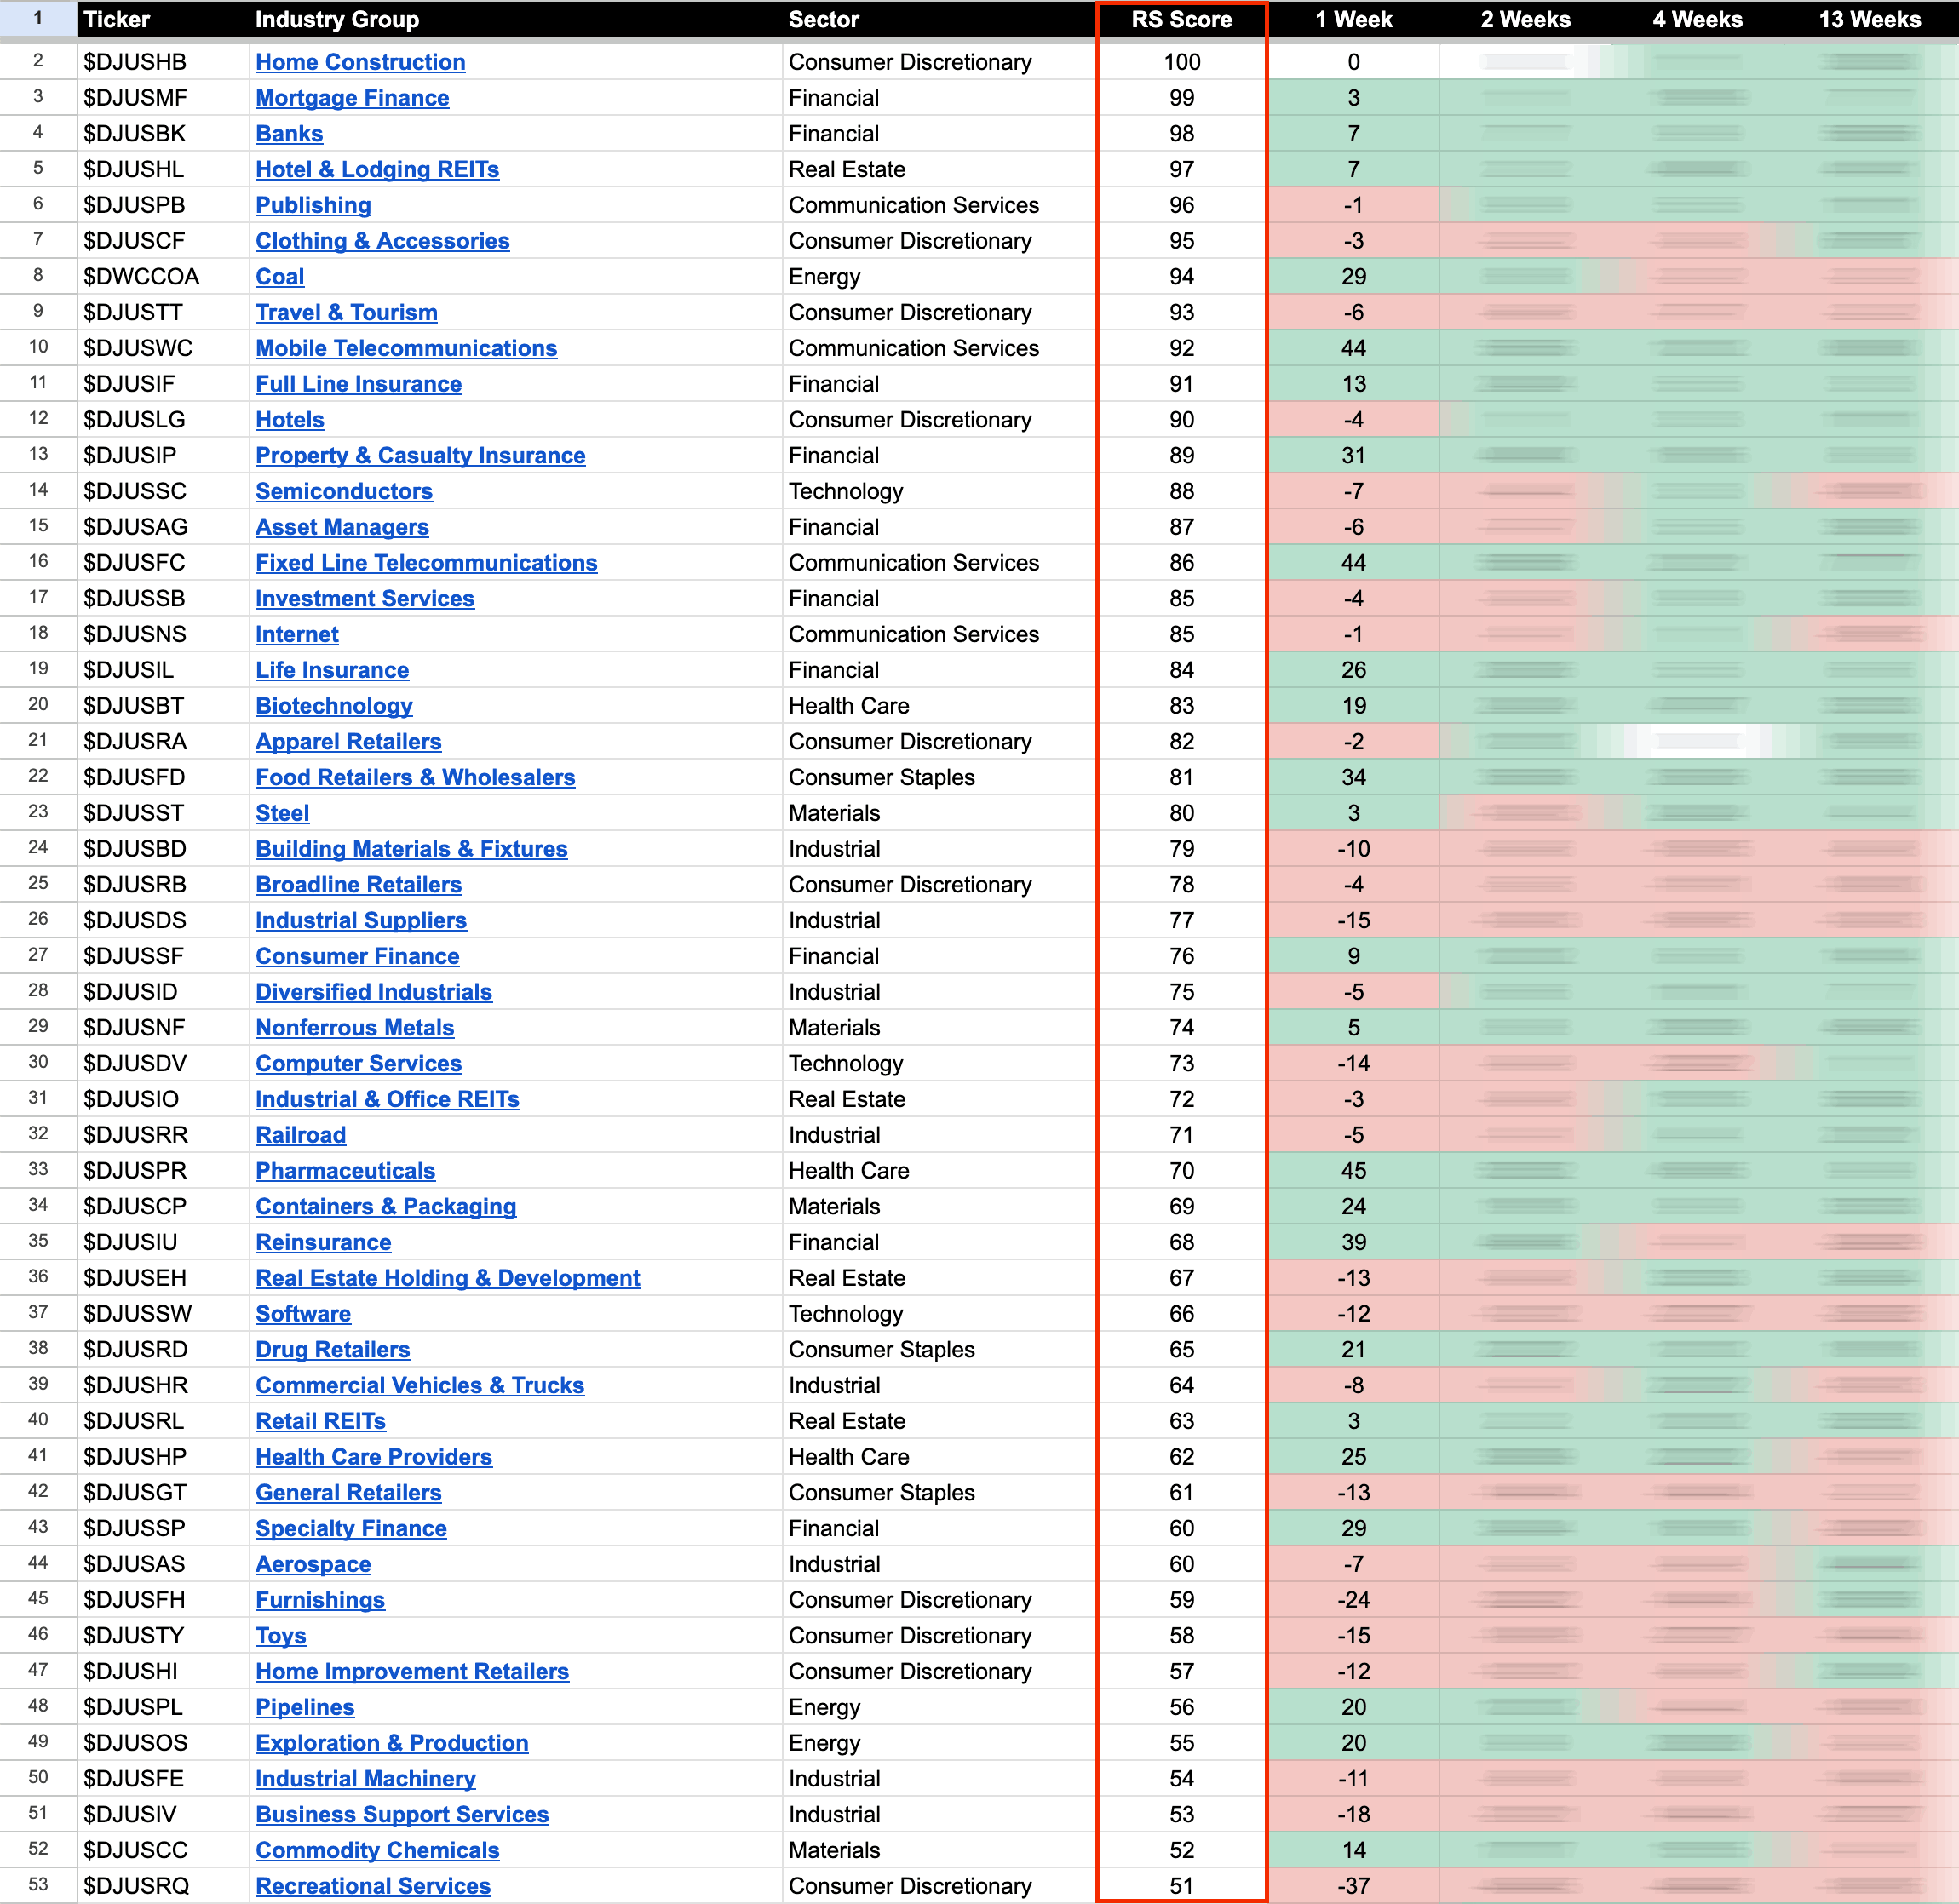
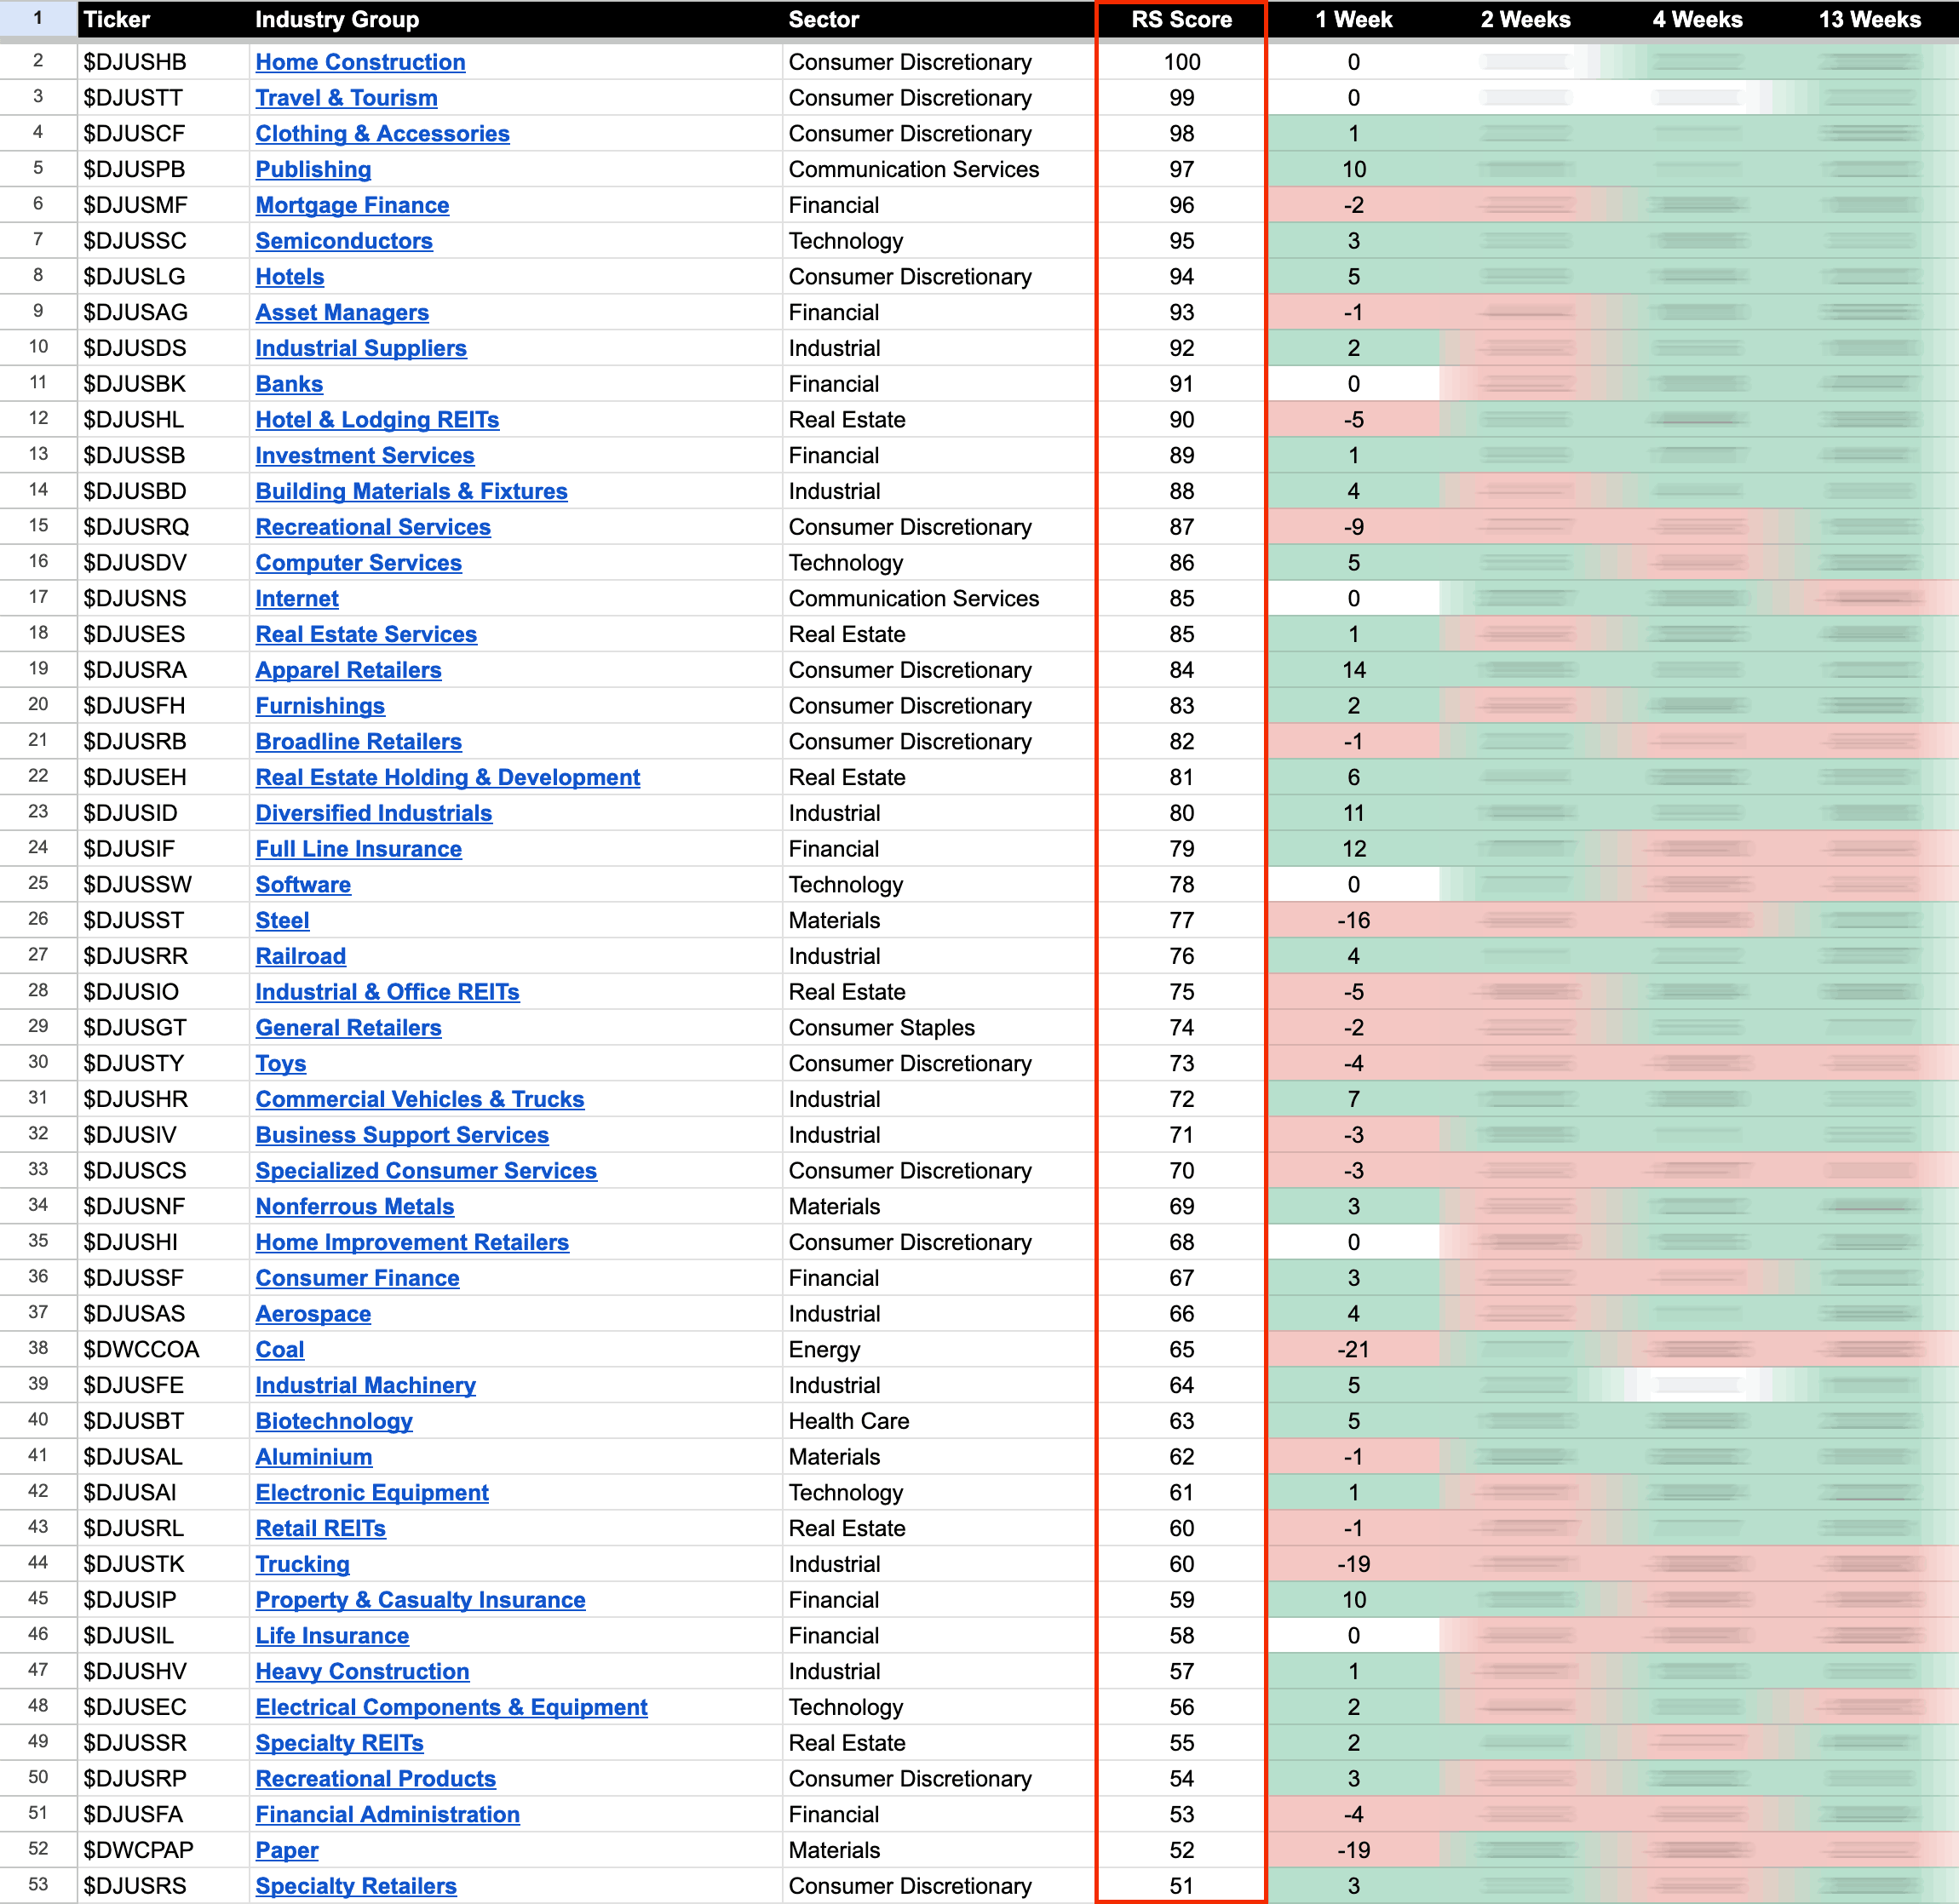
The purpose of the Relative Strength (RS) tables is to track the short, medium and long term RS changes of the individual groups to find the new leadership earlier than the crowd...
Read More
Blog
05 January, 2024
US Stocks Industry Groups Relative Strength Rankings
04 January, 2024
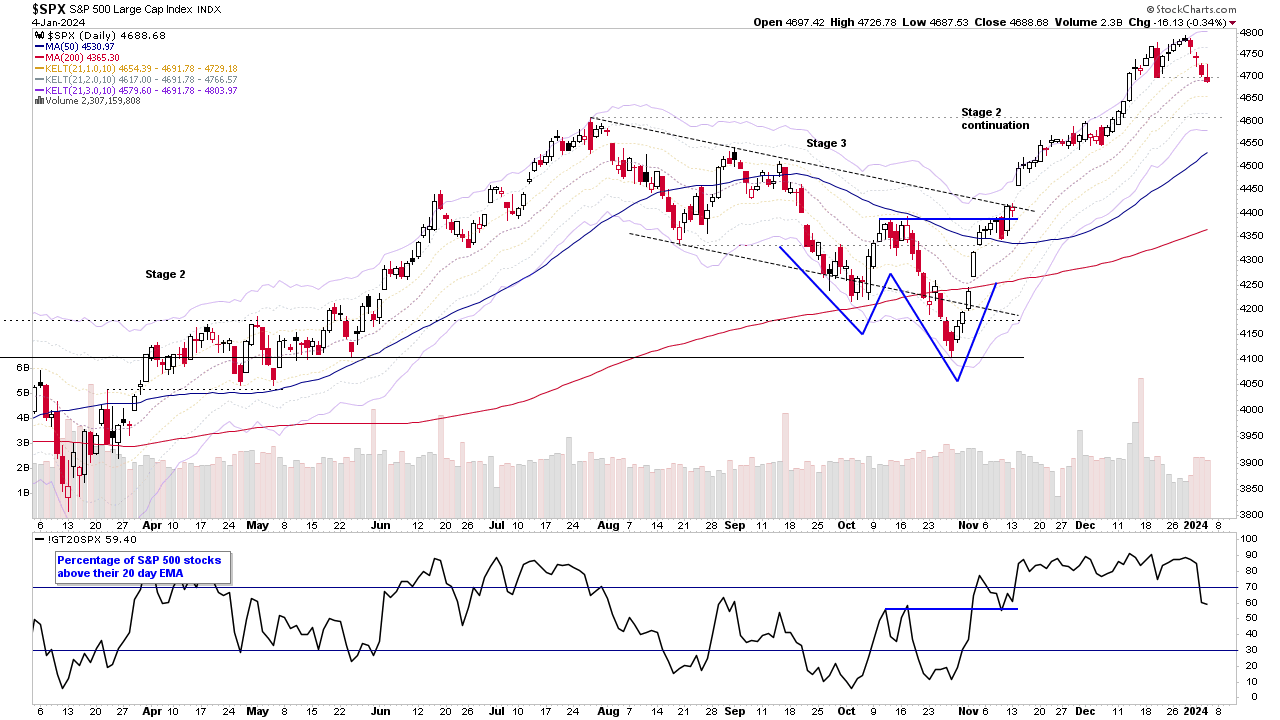
Pullback Continues in the S&P 500 and the US Stocks Watchlist – 4 January 2024
The S&P 500 has continued to pullback since the start of the year, and is currently -2.21% below the high set on the 28th December, and today closed below its 21 day EMA for the first time since the beginning of November. So it's a Change of Behaviour compared to the prior pullbacks since the October low...
Read More
03 January, 2024
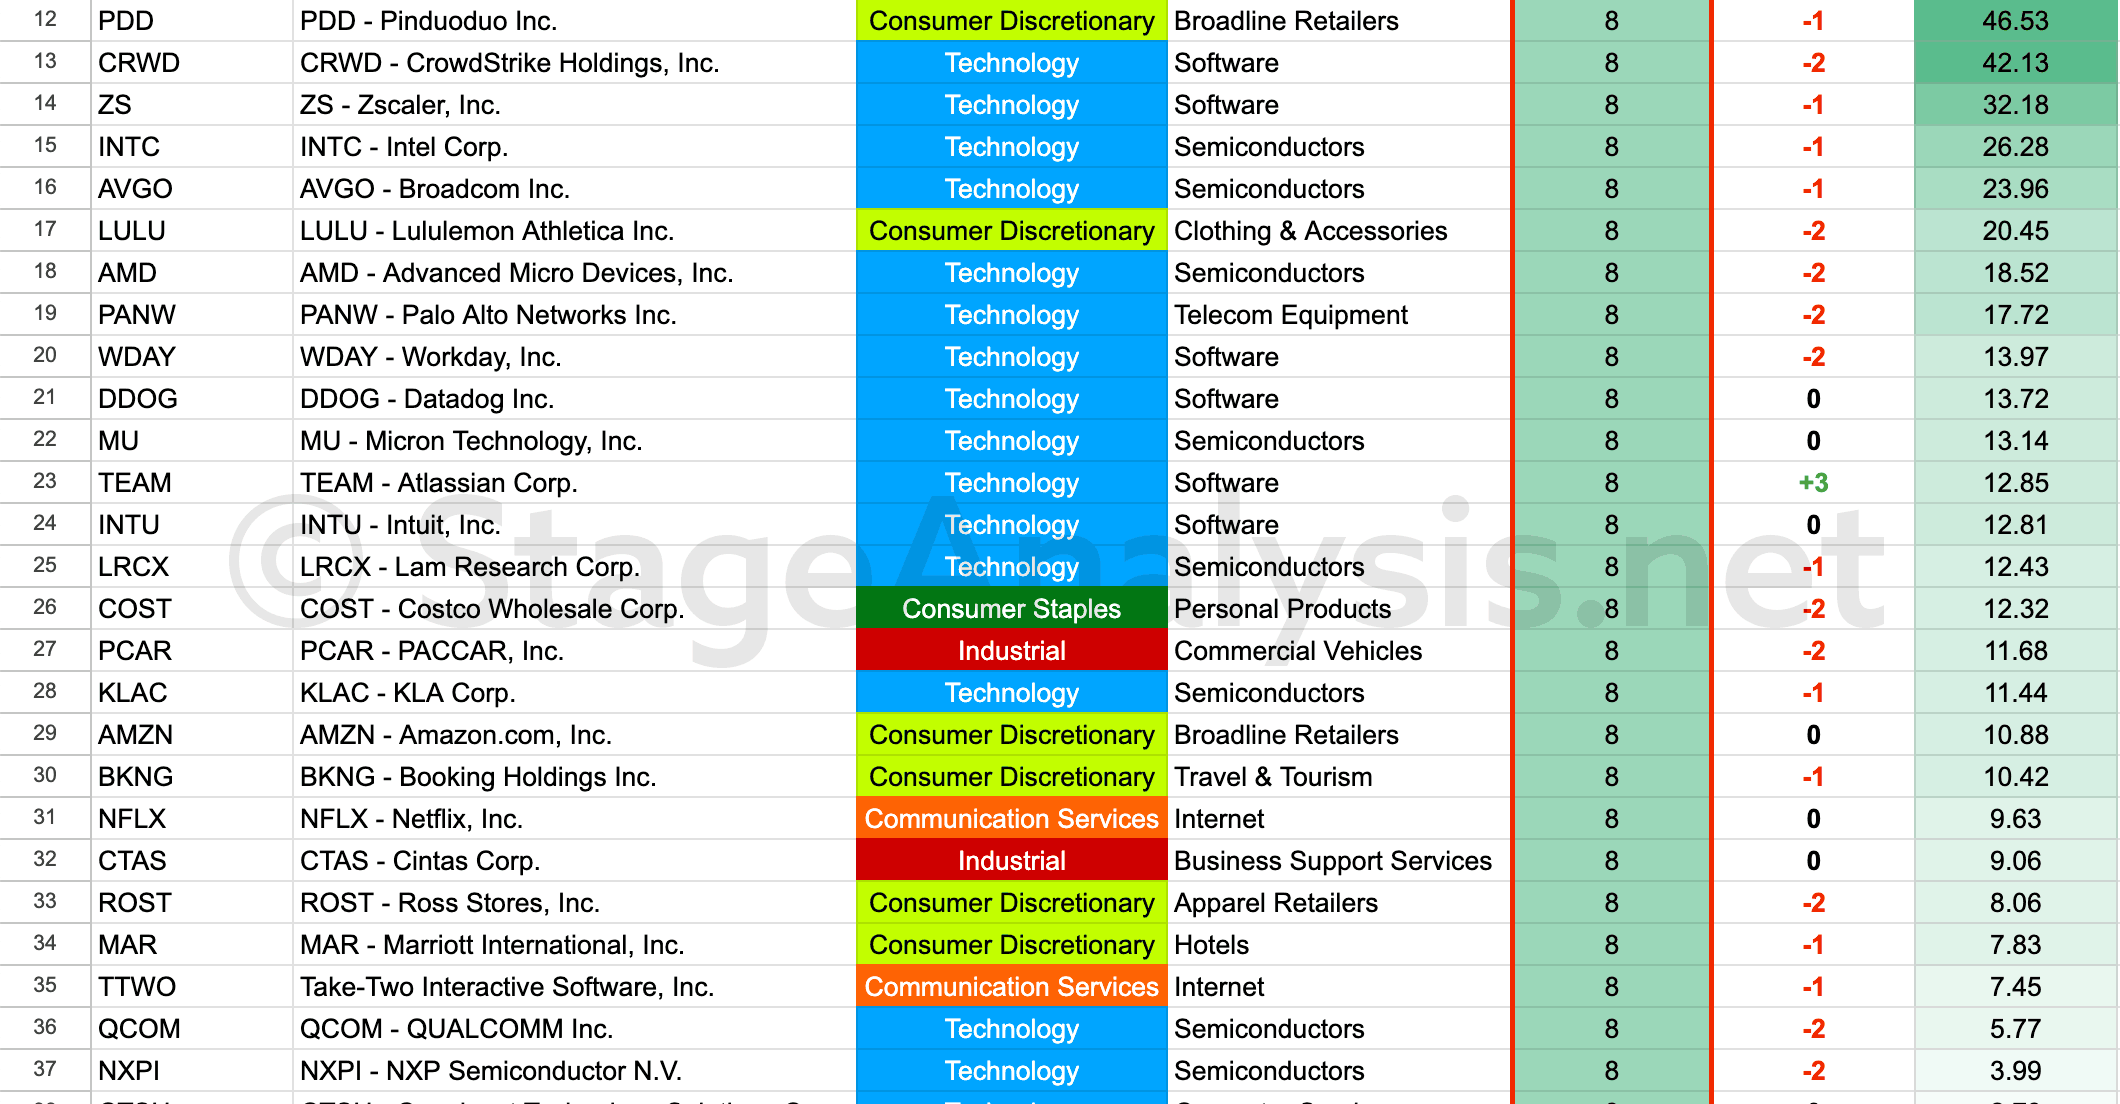
Stage Analysis Technical Attributes Scores – Nasdaq 100
The Stage Analysis Technical Attributes (SATA) score is our proprietary indicator that helps to identify the four stages from Stan Weinstein's Stage Analysis method, using a scoring system from 0 to 10 that rates ten of the key technical characteristics that we look for when analysing the weekly charts.
Read More
02 January, 2024
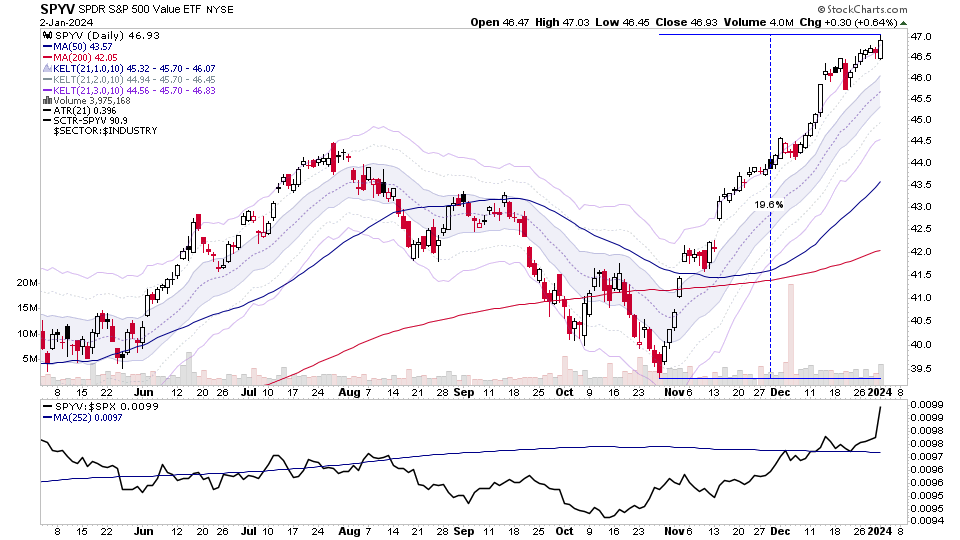
Value Stocks Start the New Year Strong and the US Stocks Watchlist – 2 January 2024
The start of the new year brought rotation from Growth to Value stocks, with growth stocks getting hit hard and value stocks pushing higher. But while the growth glamour stocks have got most of the headlines in the recent rally, you'll note from the S&P 500 Growth ETF (SPYG) and S&P 500 Value ETF (SPYV) comparison above, that Value has actually been leading Growth since around mid October, when the Mansfield Relative Strength line started to turn up in Value and down in Growth versus the S&P 500...
Read More
01 January, 2024
Stage Analysis Members Video – 1 January 2024 (1hr)
Stage Analysis members video discussing the Major US Stock Market Indexes, Futures charts, Industry Groups Relative Strength (RS) Rankings, IBD Industry Group Bell Curve – Bullish Percent, the key Market Breadth Charts to determine the Weight of Evidence, Bitcoin and Ethereum Stages and the most recent US watchlist stocks in detail on multiple timeframes.
Read More
01 January, 2024
S&P 500 Approaching All Time Highs and the US Stocks Watchlist – 1 January 2024
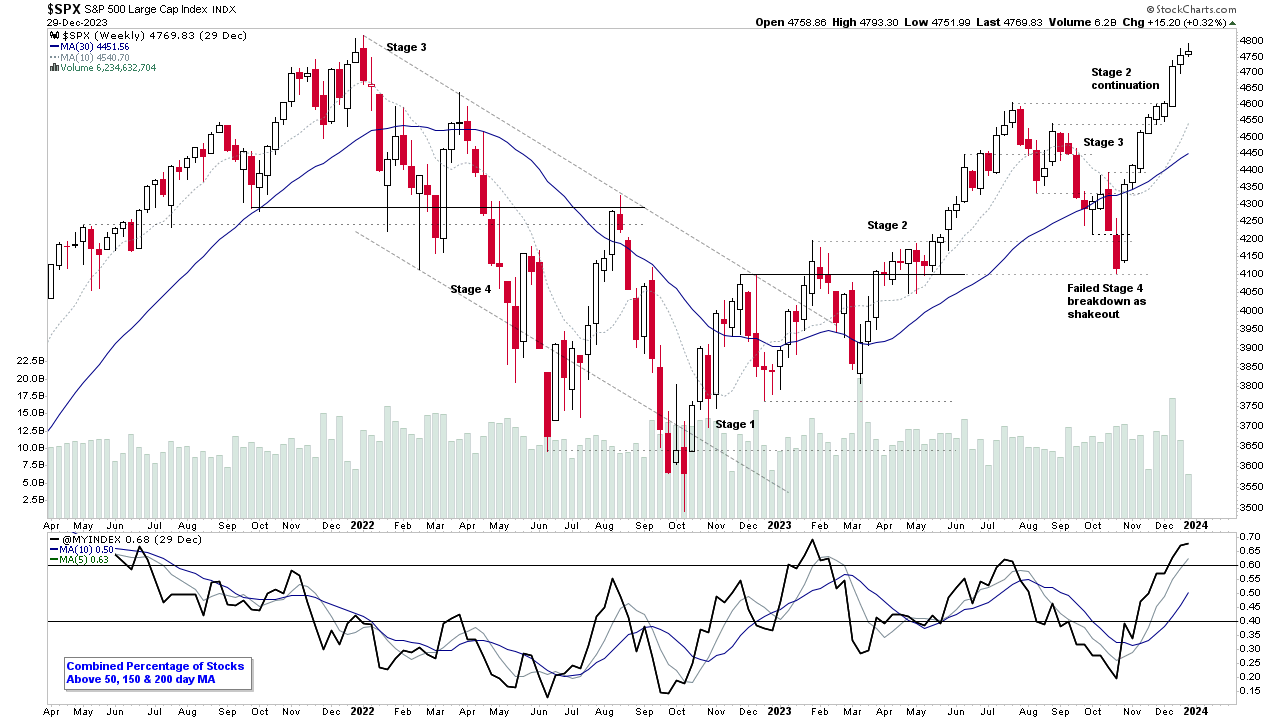
The S&P 500 closed higher for a ninth week in row at 4769.83, to end 2023 just under its all time highs of 4818.62, which was set in the first week of 2022. With the recent strength from the October swing low, it has risen +16.23% with a Lockout Rally and made a Stage 2 continuation breakout in the process...
Read More
30 December, 2023
IBD Industry Groups Bell Curve – Bullish Percent
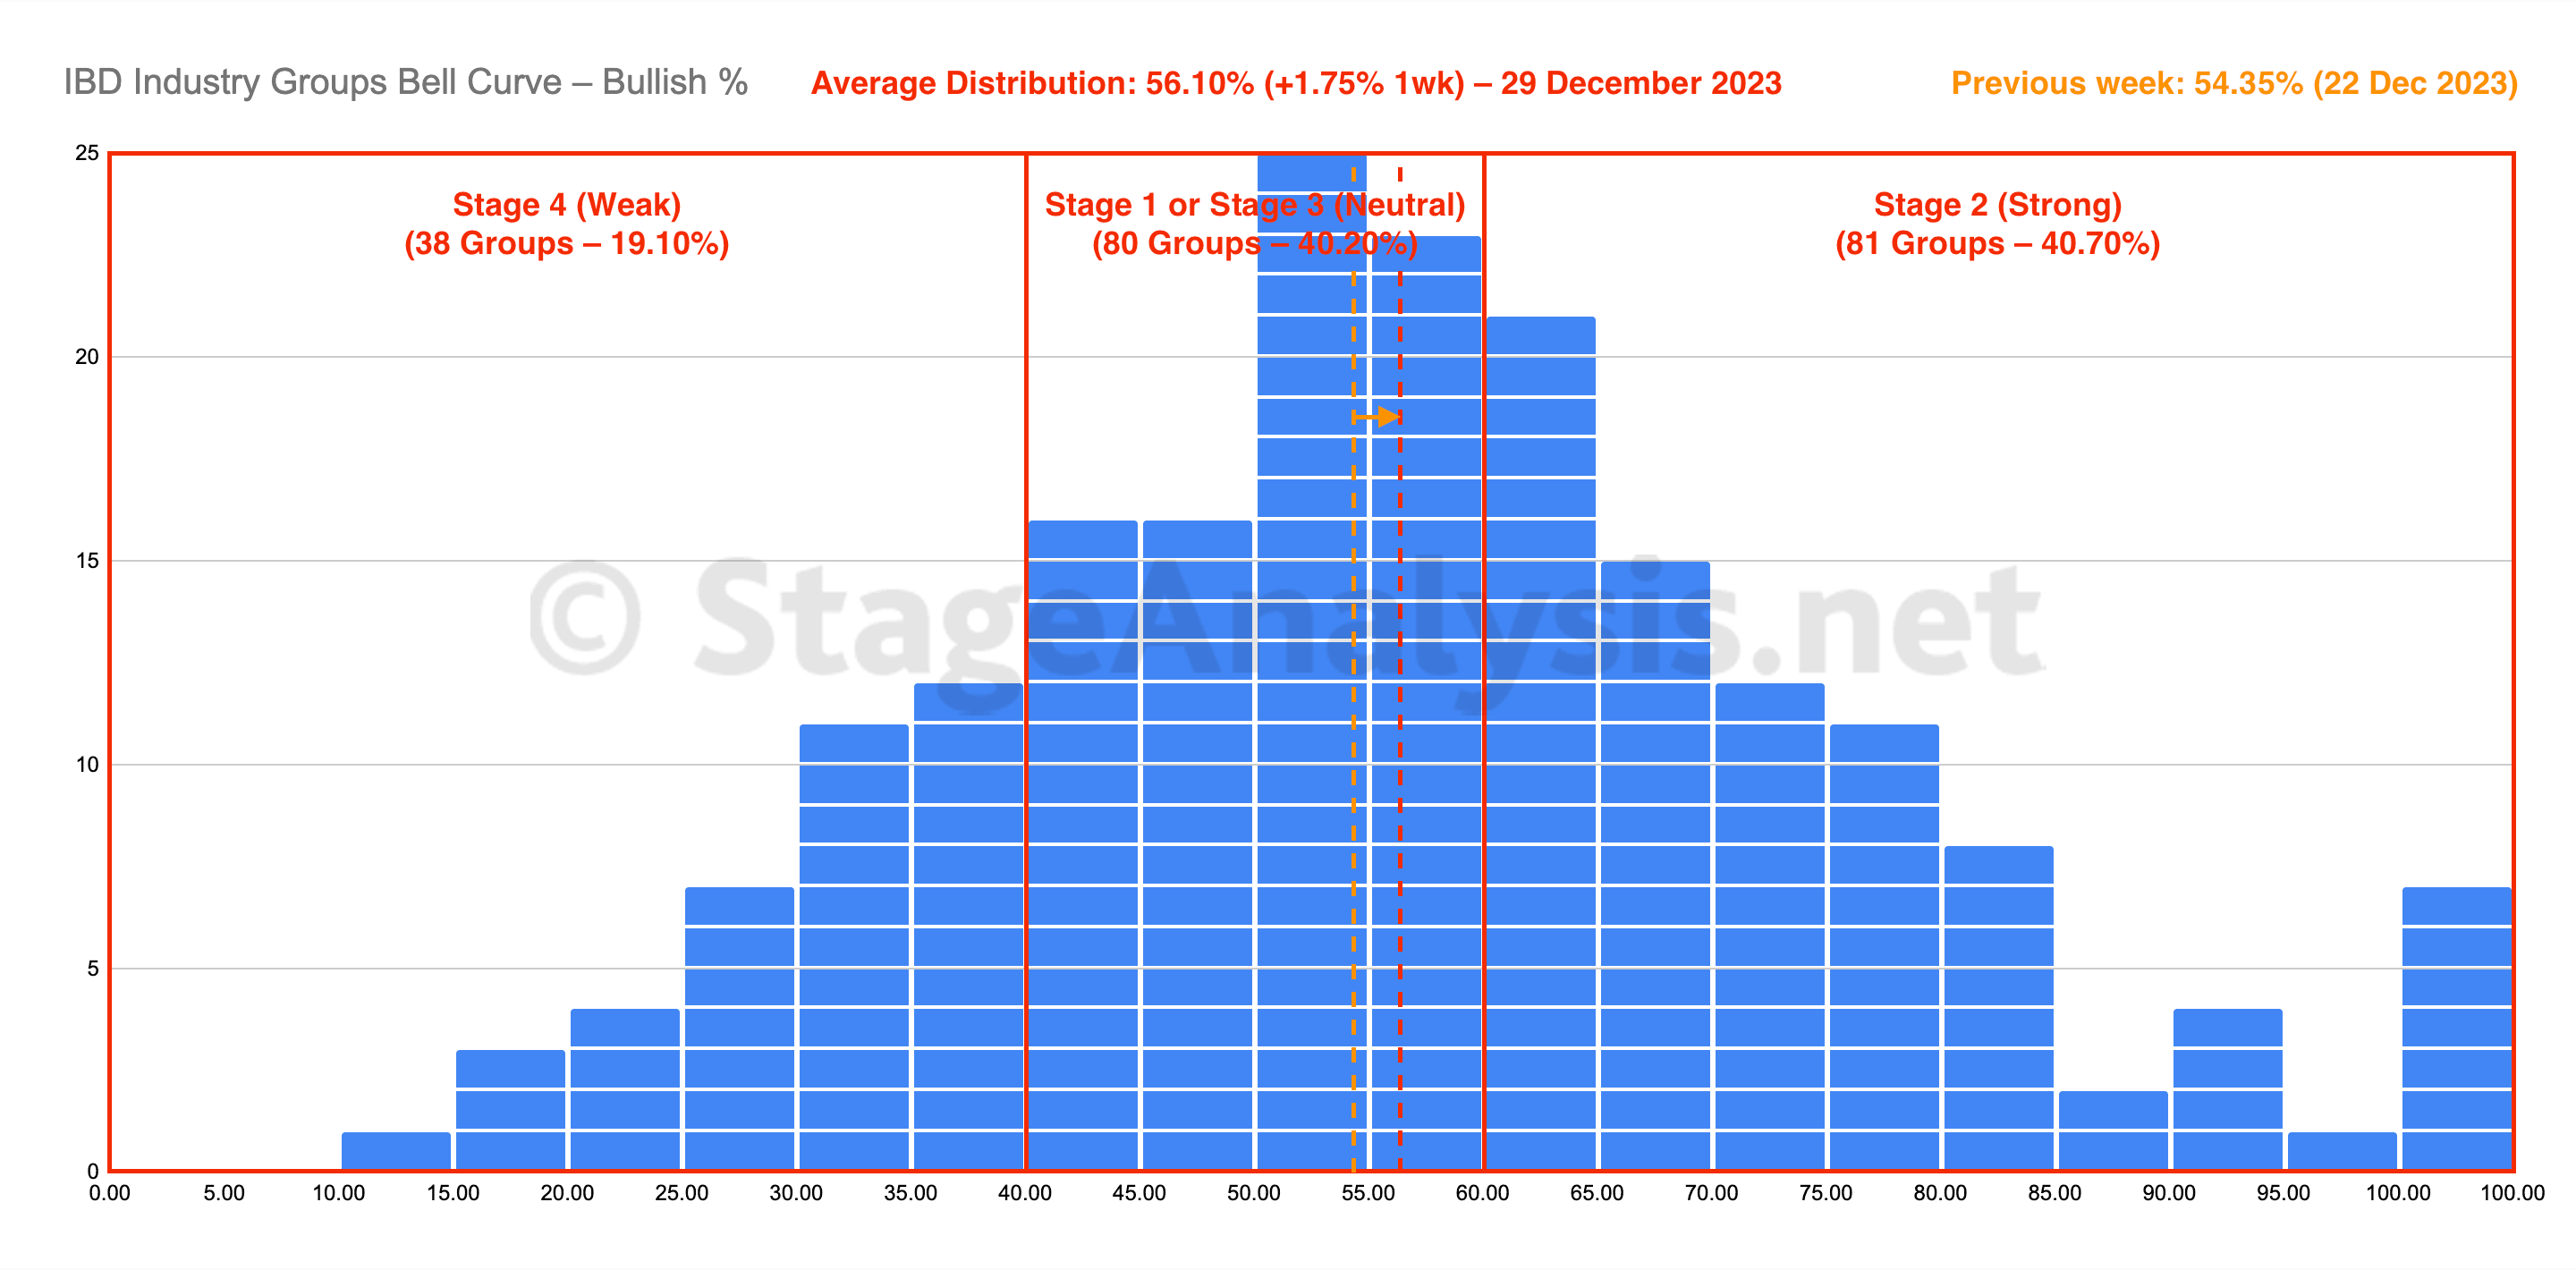
The IBD Industry Groups Bell Curve increased by +1.75% this week to finish at 56.10% overall. The amount of groups in Stage 4 (Weak) decreased by 10 (-5%), and the amount of groups in Stage 2 (Strong) increased by 8 (+4%), while the amount groups in Stage 1 or Stage 3 (Neutral) decreased by 2 (-1%).
Read More
29 December, 2023
Market Breadth: Percentage of Stocks Above their 50 Day, 150 Day & 200 Day Moving Averages Combined
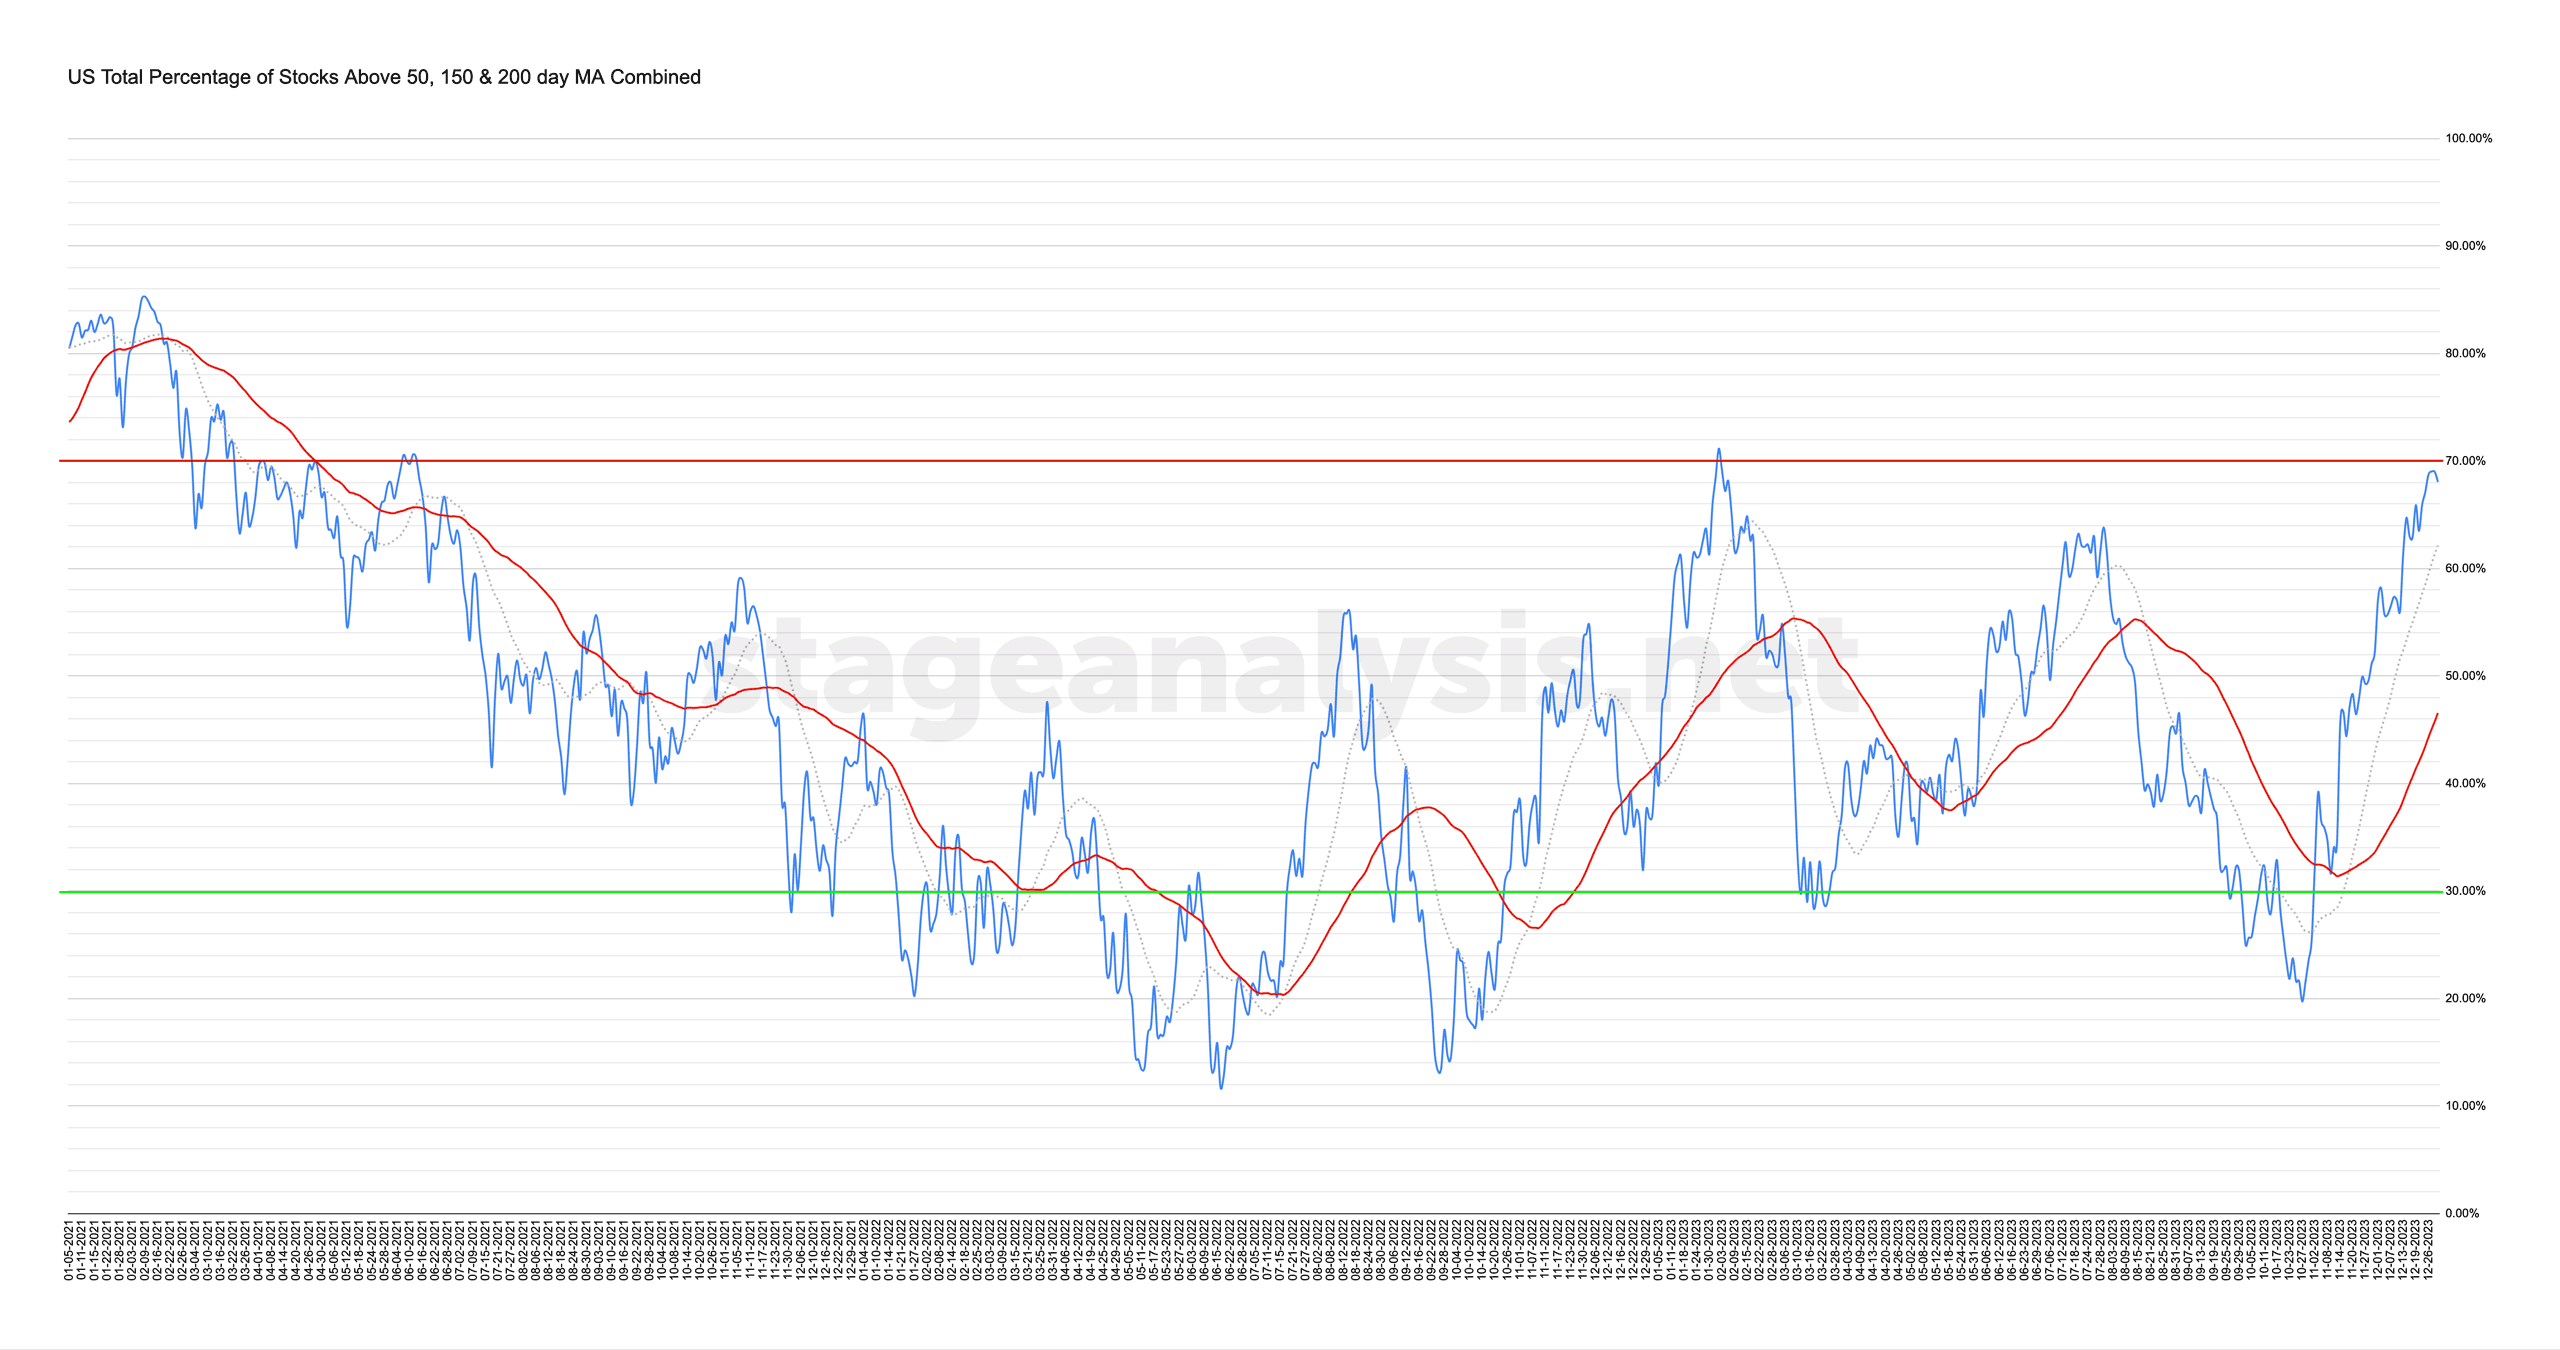
Custom Percentage of Stocks Above Their 50 Day, 150 Day & 200 Day Moving Averages Combined Market Breadth Charts for the Overall US Market, NYSE and Nasdaq for Market Timing and Strategy.
Read More
29 December, 2023
US Stocks Industry Groups Relative Strength Rankings
The purpose of the Relative Strength (RS) tables is to track the short, medium and long term RS changes of the individual groups to find the new leadership earlier than the crowd...
Read More
27 December, 2023
2023 Stage Analysis Stock Leaders – 27 December 2023 (35mins)
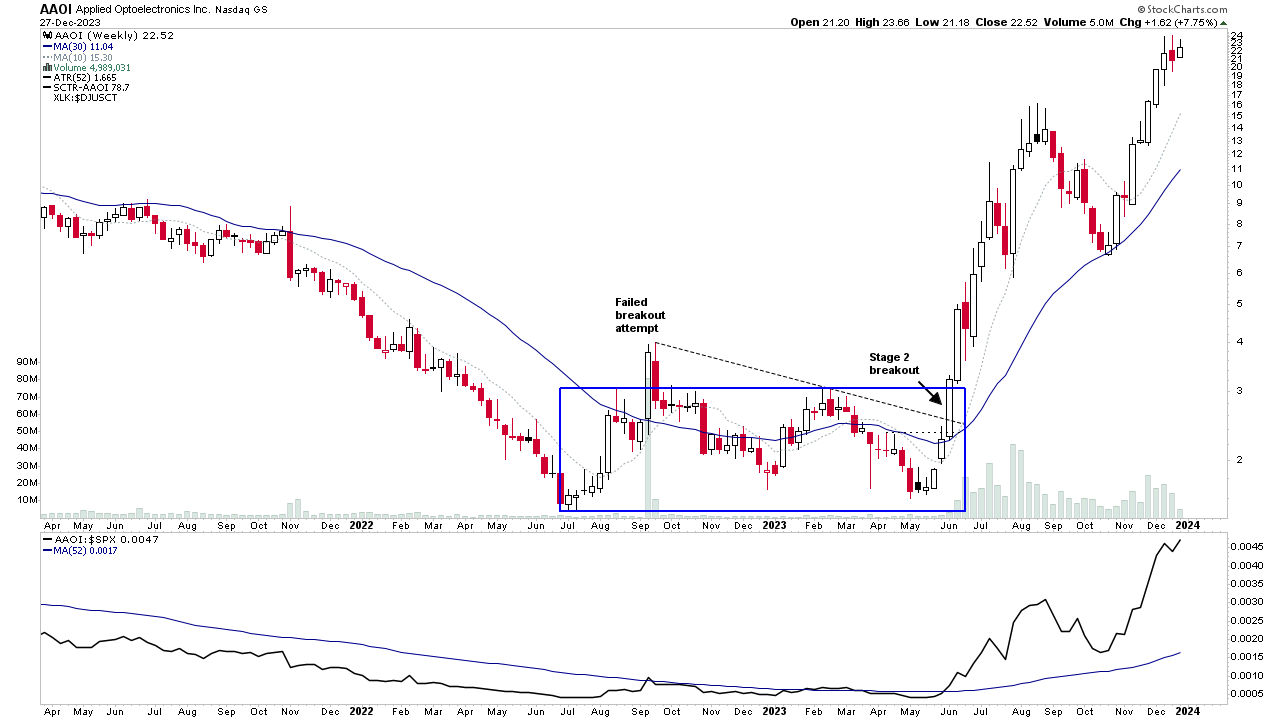
2023 has seen many exceptional Stage 2 advances in individual stocks as the major US indexes moved higher in Stage 2 advances of their own. So this short 35 minute video discusses fifteen of this years best Stage 2 moves and the characteristics that they developed as they moved into early Stage 2, to help you recognise what to look for in future stocks as they move towards the investor method entry point/s.
Read More

