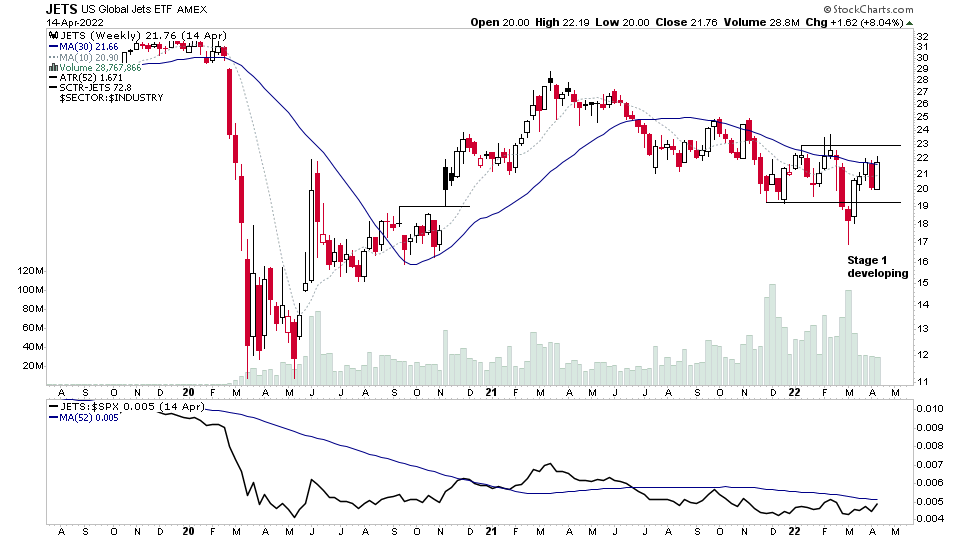
There were 34 stocks for the US stocks watchlist today. JETS, MAR, KBR, UUUU + 30 more...
Read More
Blog
17 April, 2022
US Stocks Watchlist – 17 April 2022
15 April, 2022
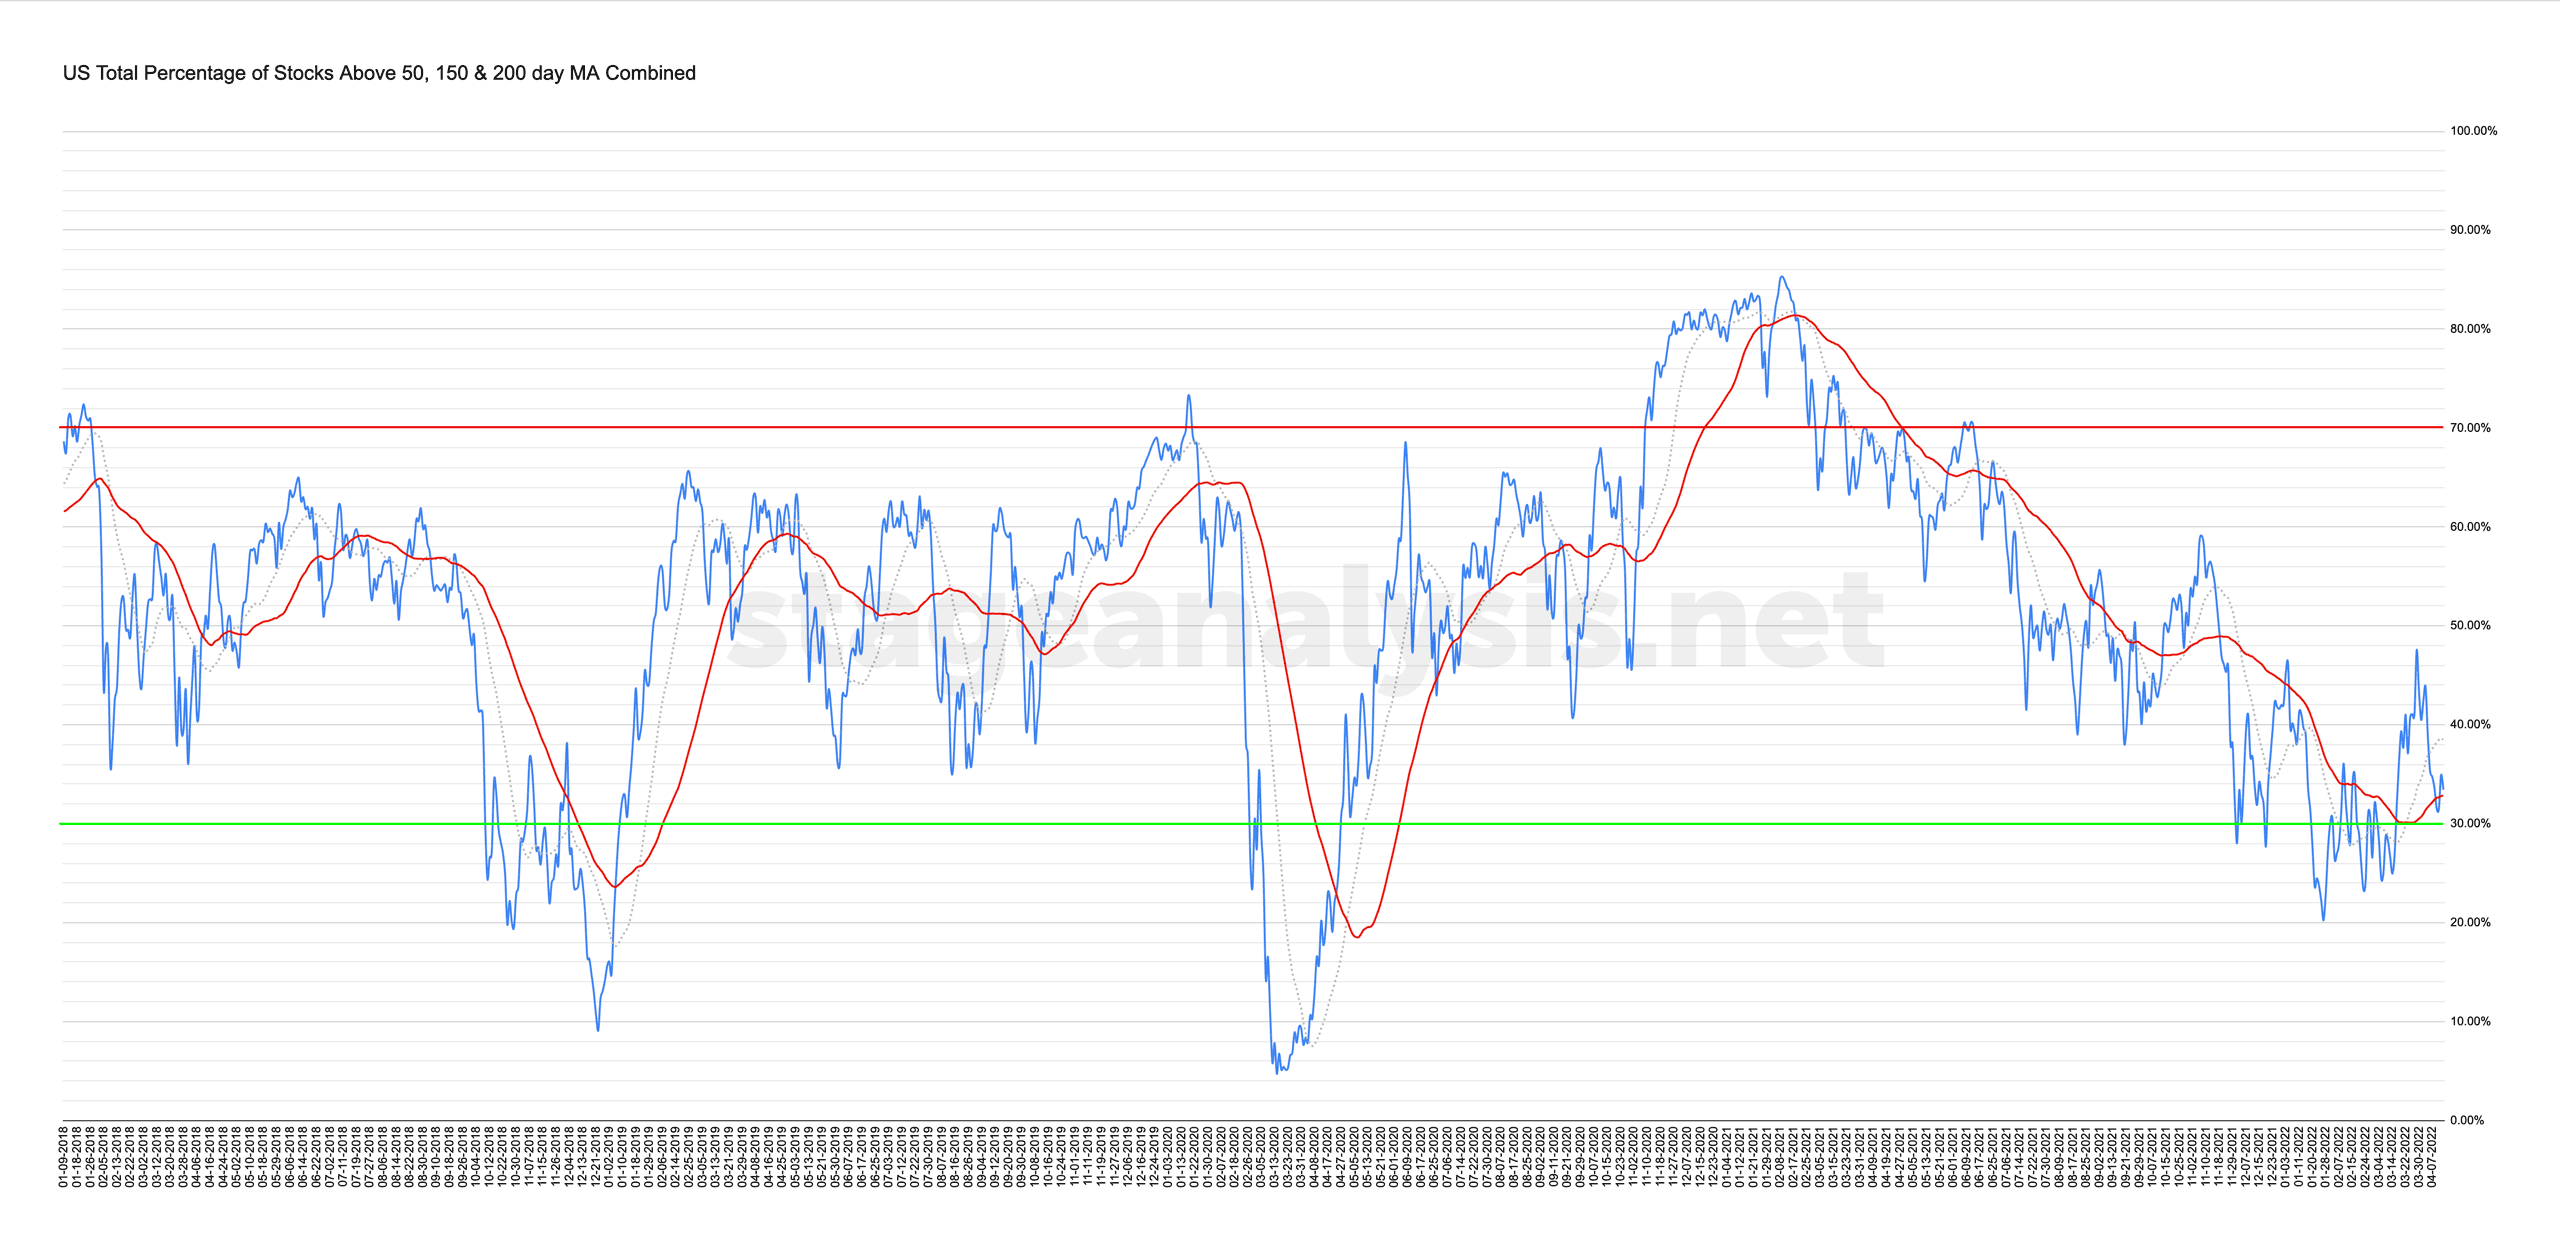
Market Breadth: Percentage of Stocks Above their 50 Day, 150 Day & 200 Day Moving Averages Combined
Custom Percentage of Stocks Above Their 50 Day, 150 Day & 200 Day Moving Averages Combined Market Breadth Charts for the Overall US Market, NYSE and Nasdaq for Market Timing and Strategy.
Read More
15 April, 2022
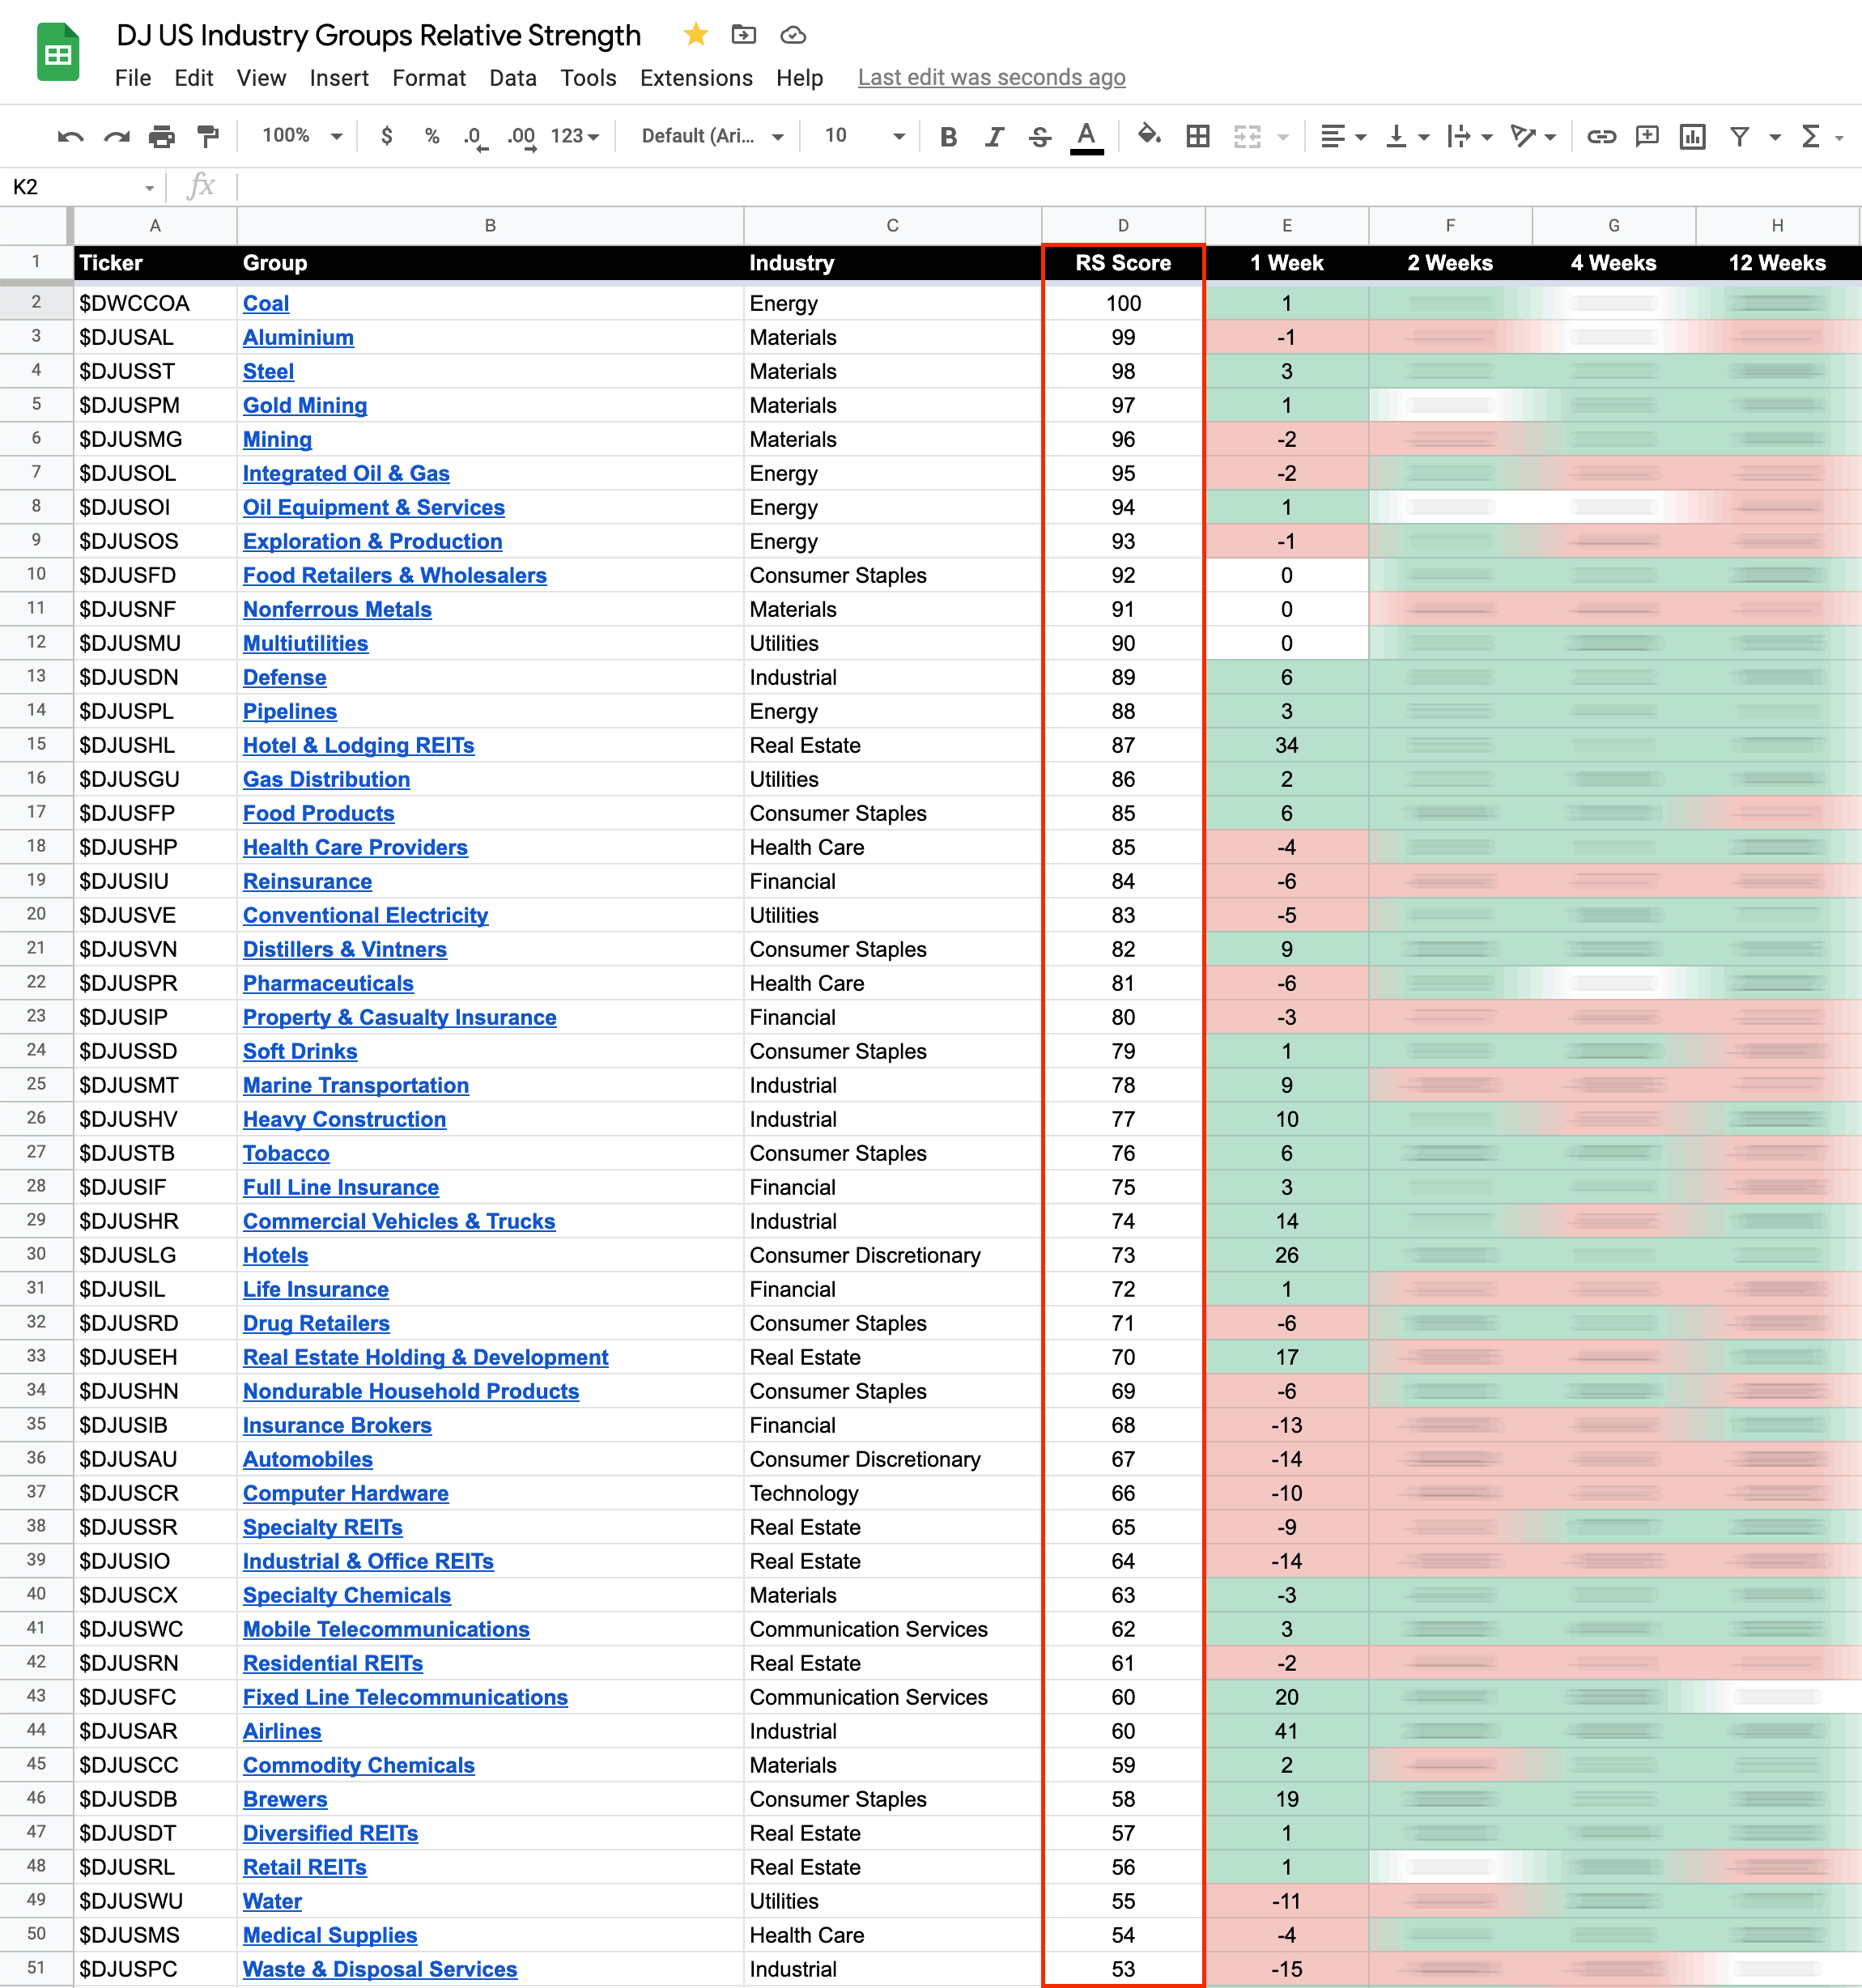
US Stocks Industry Groups Relative Strength Rankings
The purpose of the Relative Strength (RS) tables is to track the short, medium and long term RS changes of the individual groups to find the new leadership earlier than the crowd...
Read More
14 April, 2022
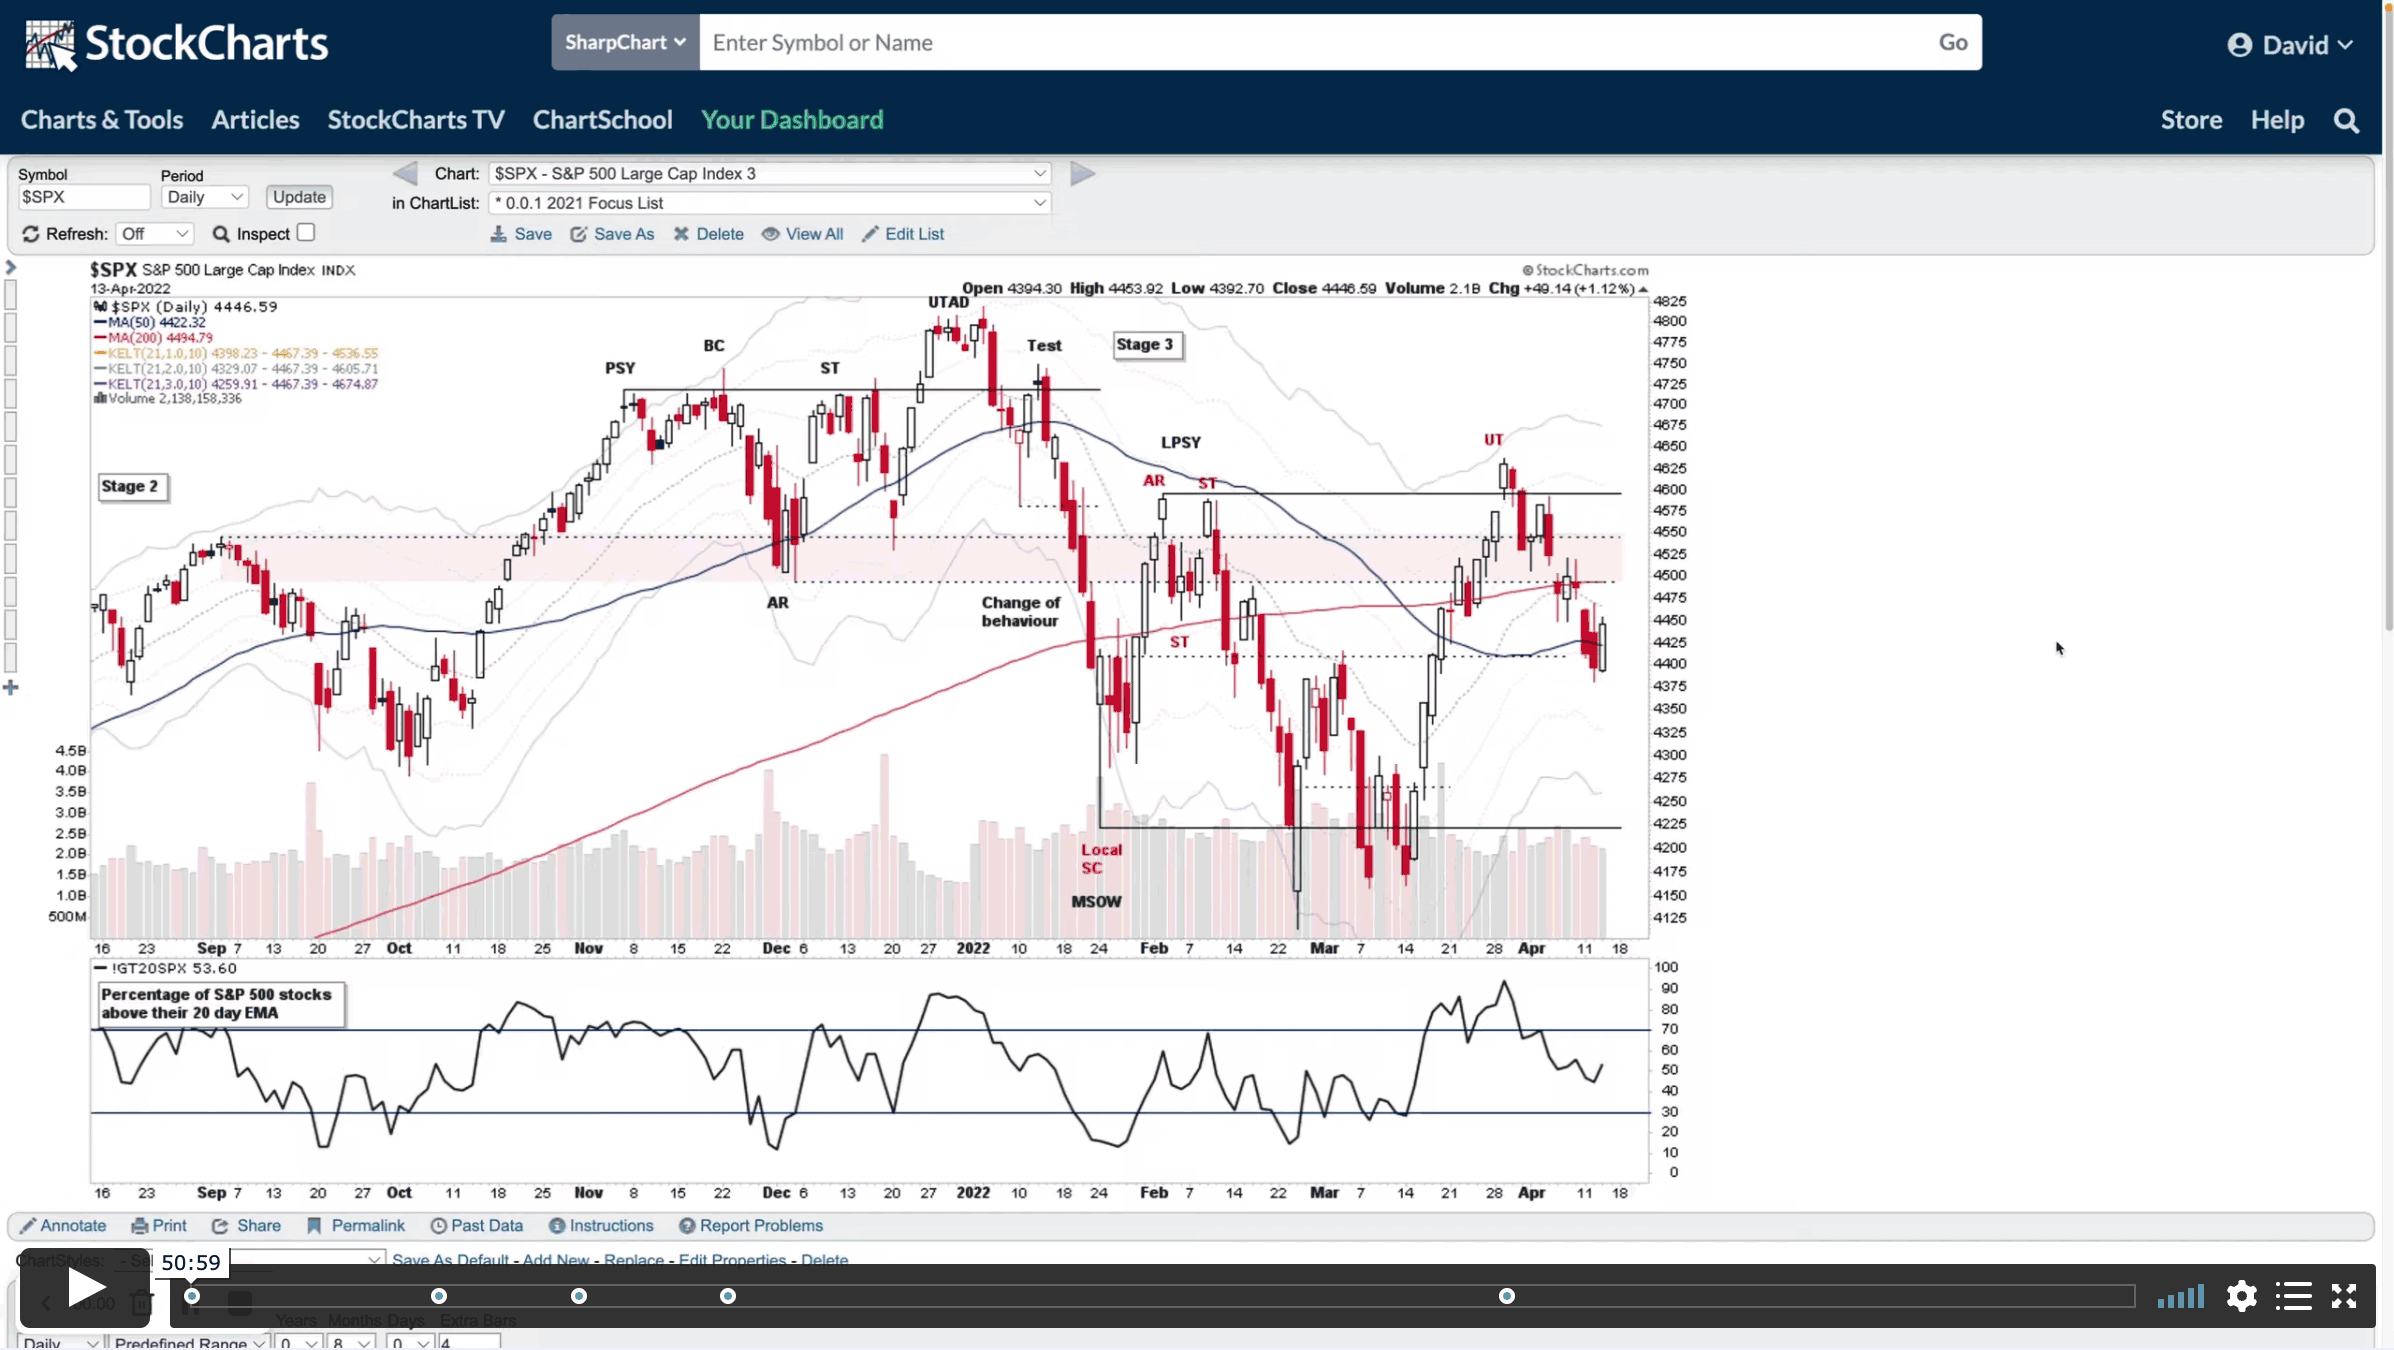
Stage Analysis Members Midweek Video - 14 April 2022 (50 mins)
The Stage Analysis Members Midweek Video covers the major indexes, short term market breadth charts, AAPL and TSLA attempts to the hold their short term MAs.The group themes from the last week, and the US watchlist stocks in more detail...
Read More
13 April, 2022
Stock Market Wild Ride Continues – Attempts to Hold Short Term Moving Averages in Key Stocks and the US Stocks Watchlist – 13 April 2022
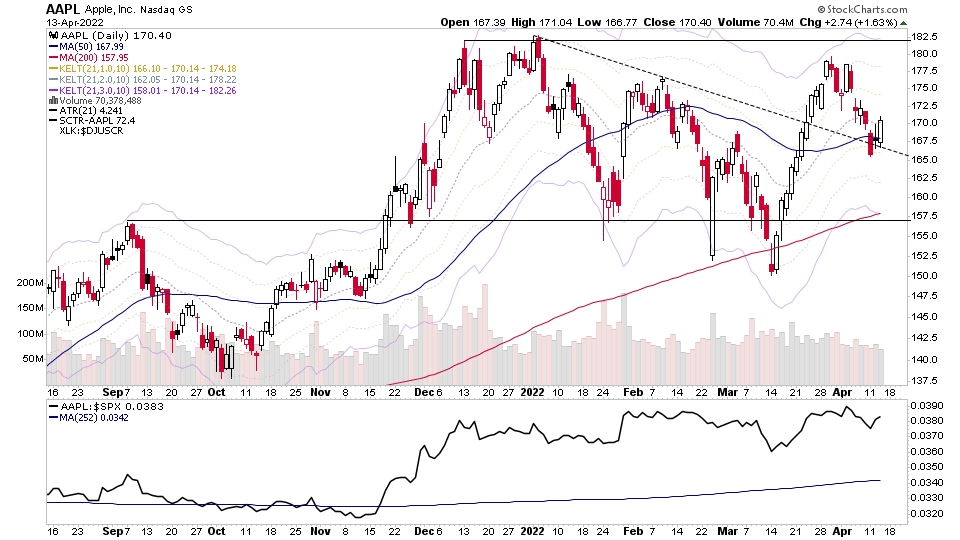
AAPL closed the day back above both its 50 day MA and the short term 21 day EMA and continues to hold the at top of the most recent down trendline. TSLA also revered back higher through its short term 21 day MA, as did many other stocks today, with a very high reading on the daily scan that I run for that of over 100...
Read More
12 April, 2022
S&P 500 Fails To Hold the 50 Day MA for a Second Day and the US Stocks Watchlist – 12 April 2022
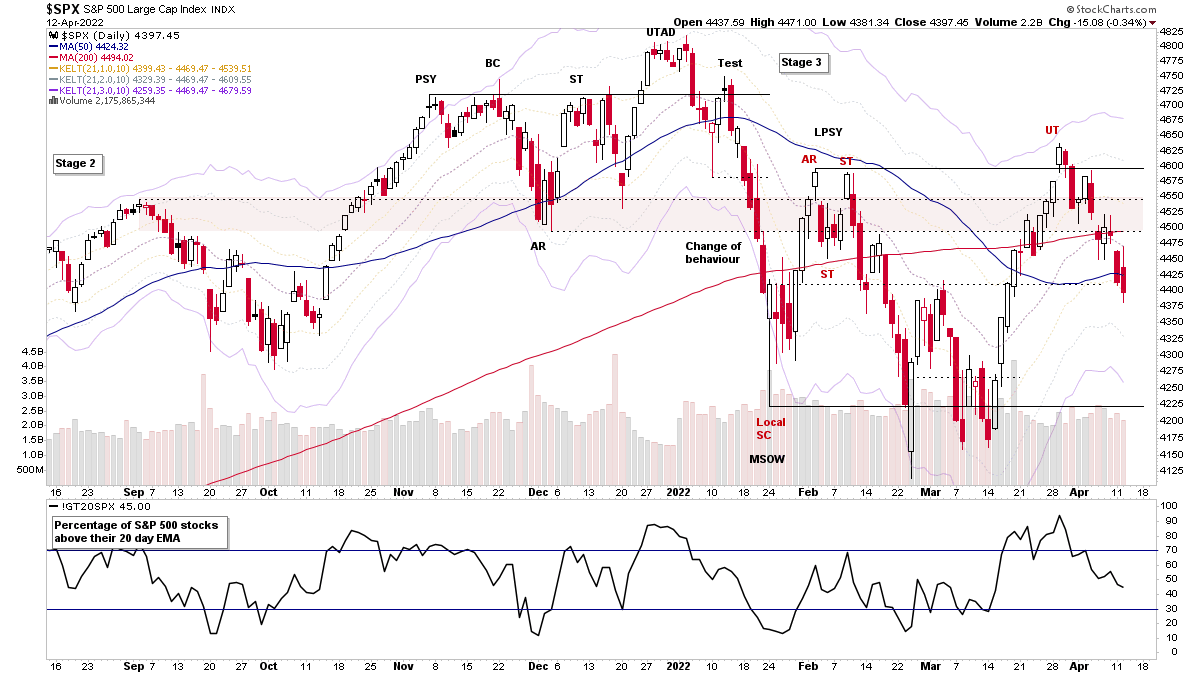
The S&P 500 opened back above the 50 day MA today, but the early enthusiasm soon diminished, and it rolled over at the short term 21 day EMA and turned lower again. Closing the day back below the 50 day MA for a second day and also the -1x ATR(21 day) level...
Read More
11 April, 2022
Stock Market Weakness Continues – Plus The US Stocks Watchlist – 11 April 2022
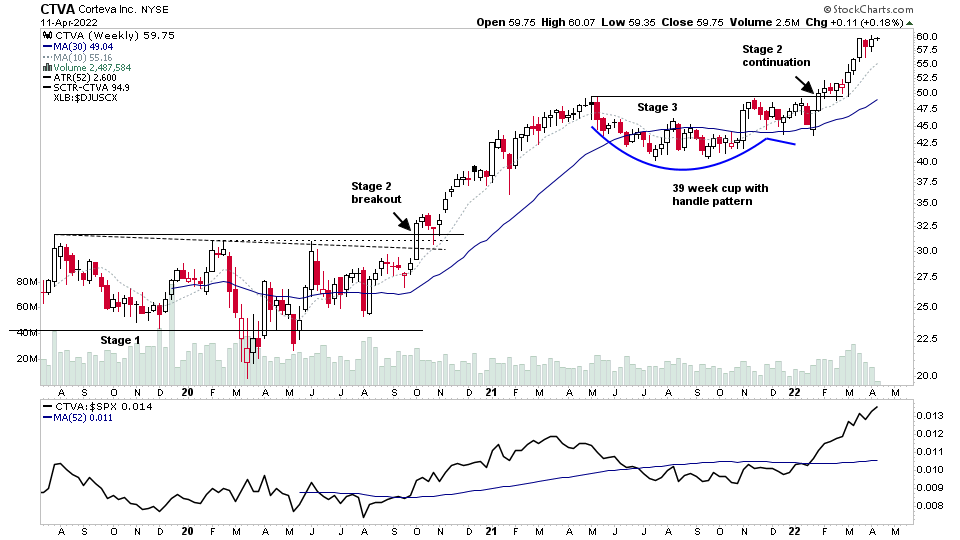
The broad market came under more pressure today, but I thought it would be interesting to focus on some of the weekly charts of the mega cap stocks which are currently struggling in various Phases of Stage 3...
Read More
10 April, 2022
Stage Analysis Members Weekend Video – 10 April 2022 (1hr 42mins)
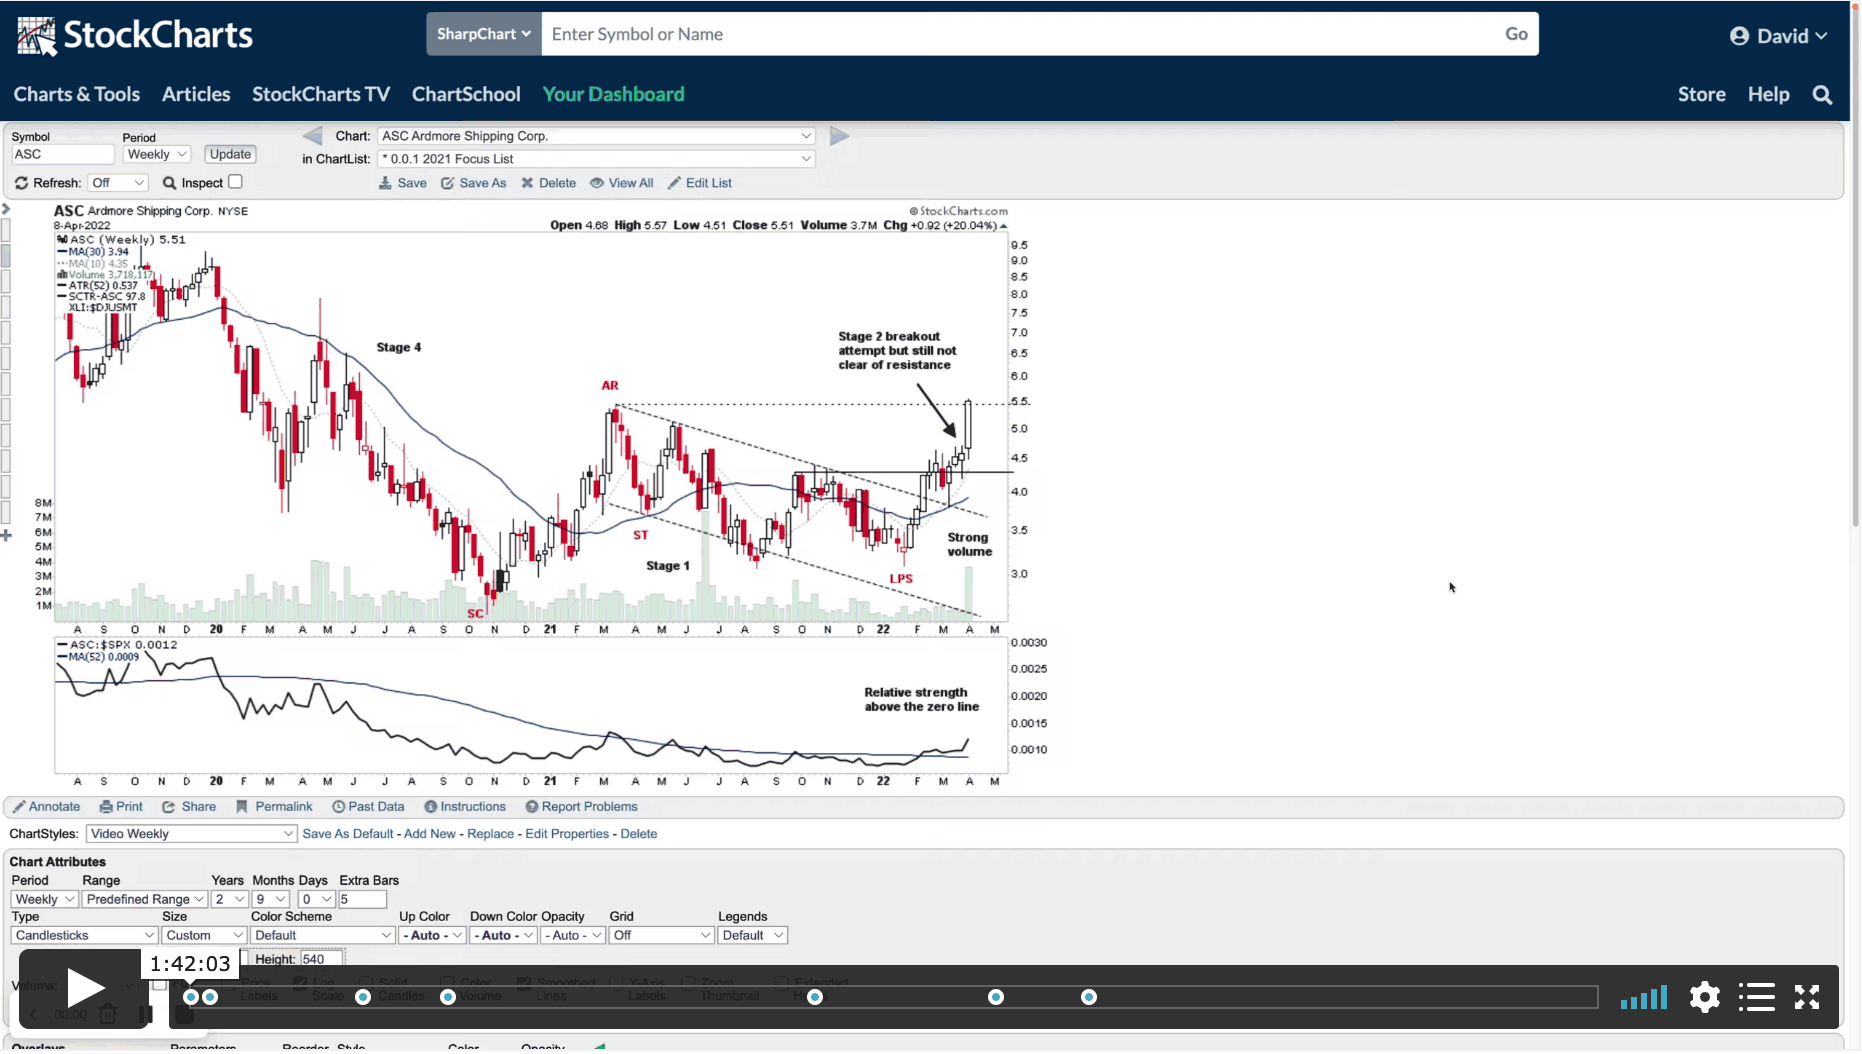
This weekends Stage Analysis Members Video features the Major Indexes – Nasdaq, S&P 500, Russell 2000, Sector Relative Strength, Market Breadth charts to determine the Weight of Evidence, Industry Group Relative Strength. A Group Focus on the Uranium Stocks and the US Stocks Watchlist in detail with marked up charts and explanations of the group themes and what I'm looking for in various stocks.
Read More
10 April, 2022
US Stocks Watchlist – 10 April 2022
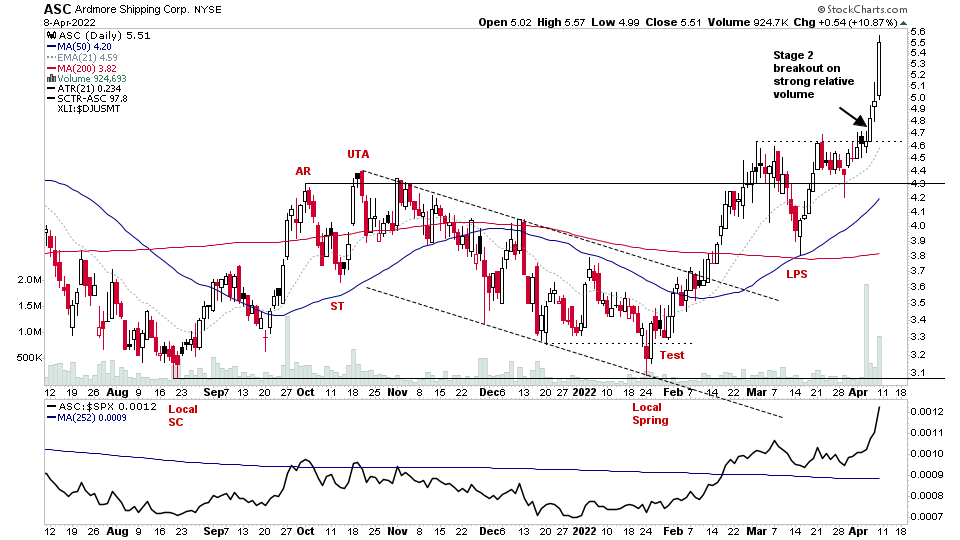
There were 44 stocks for the US stocks watchlist today. ASC, ACHC, GFI, LAC + 40 more...
Read More
09 April, 2022
Sector Breadth: Percentage of US Stocks Above Their 150 day (30 Week) Moving Averages
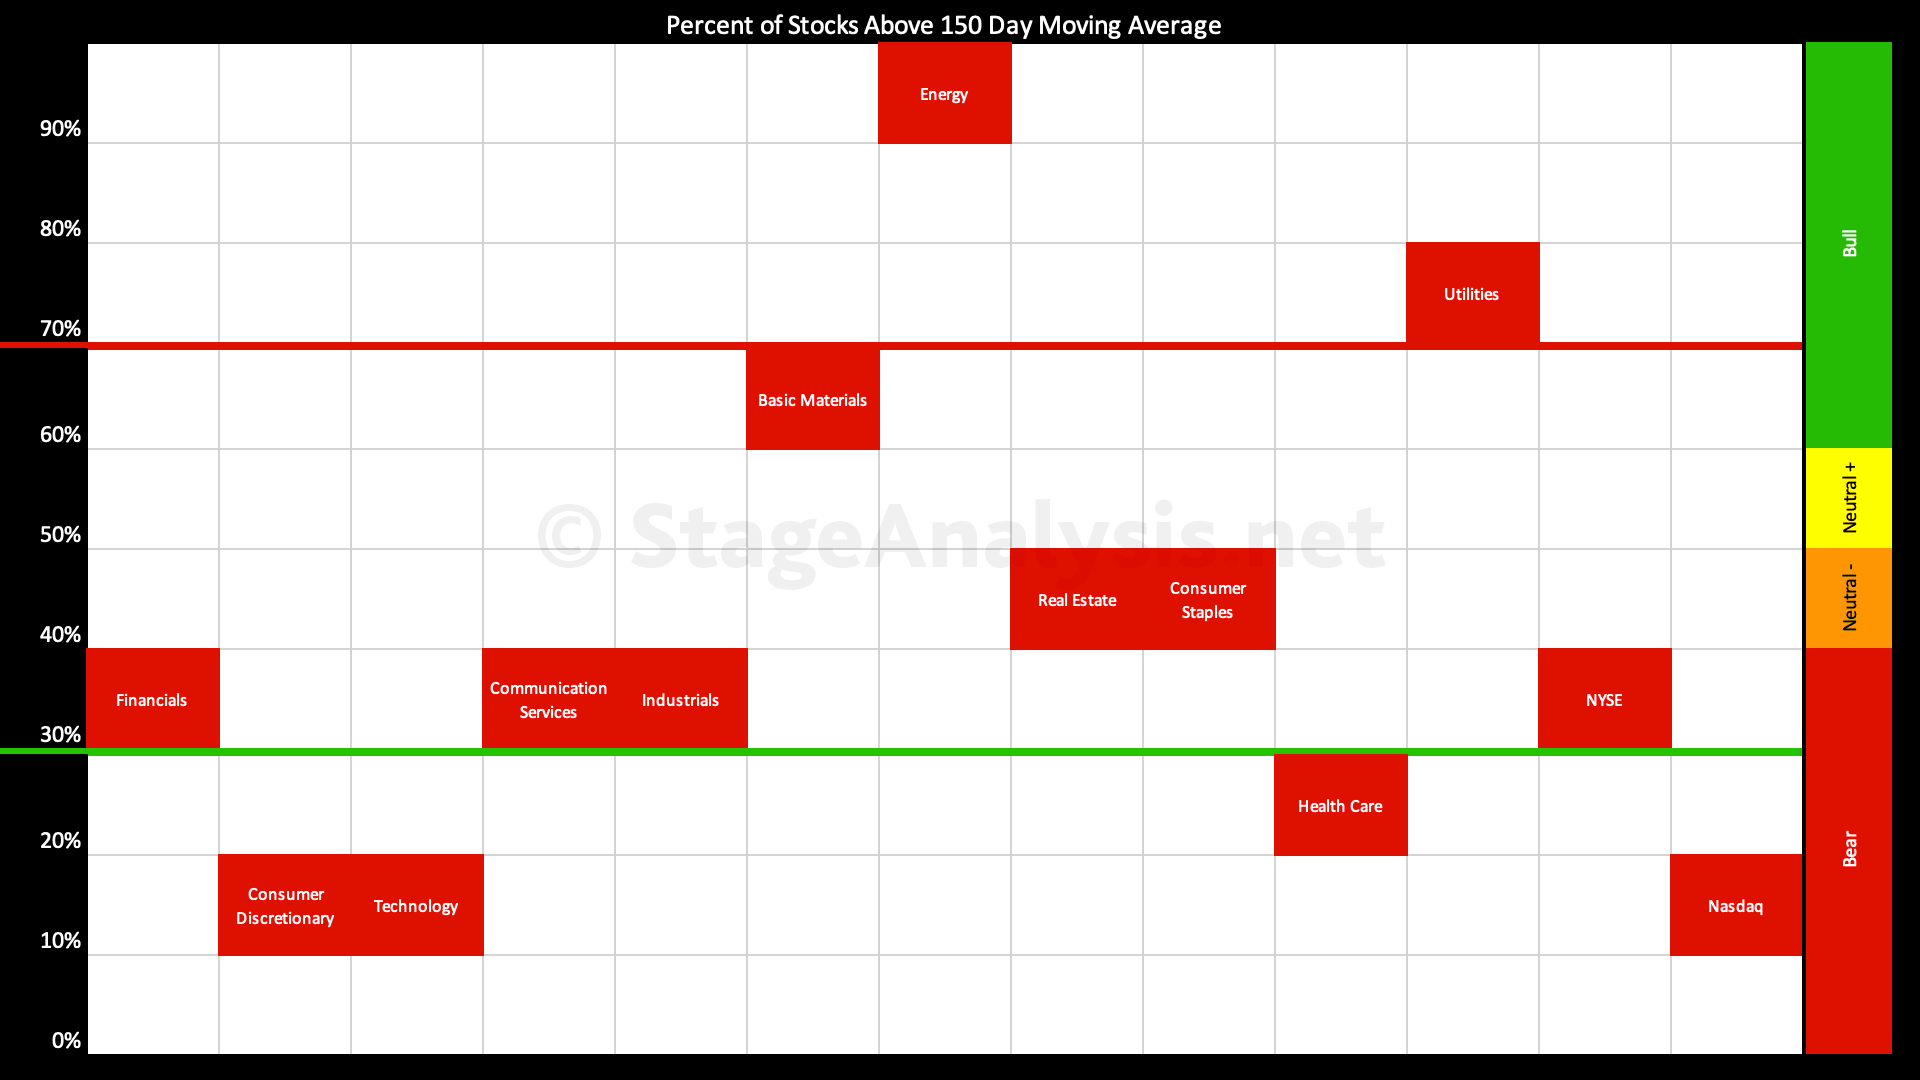
Declines across the entire US stock market this week with the overall average dropping back to 43.93%, which as you can see from the sector data is being propped up by the lingering strength in Energy, Utilities, and Basic Materials. While the rest of the market is lagging, especially the Consumer Discretionary and Technology sectors – which have less than 20% of stocks in each above their medium term 150 day (30 week) moving averages...
Read More

