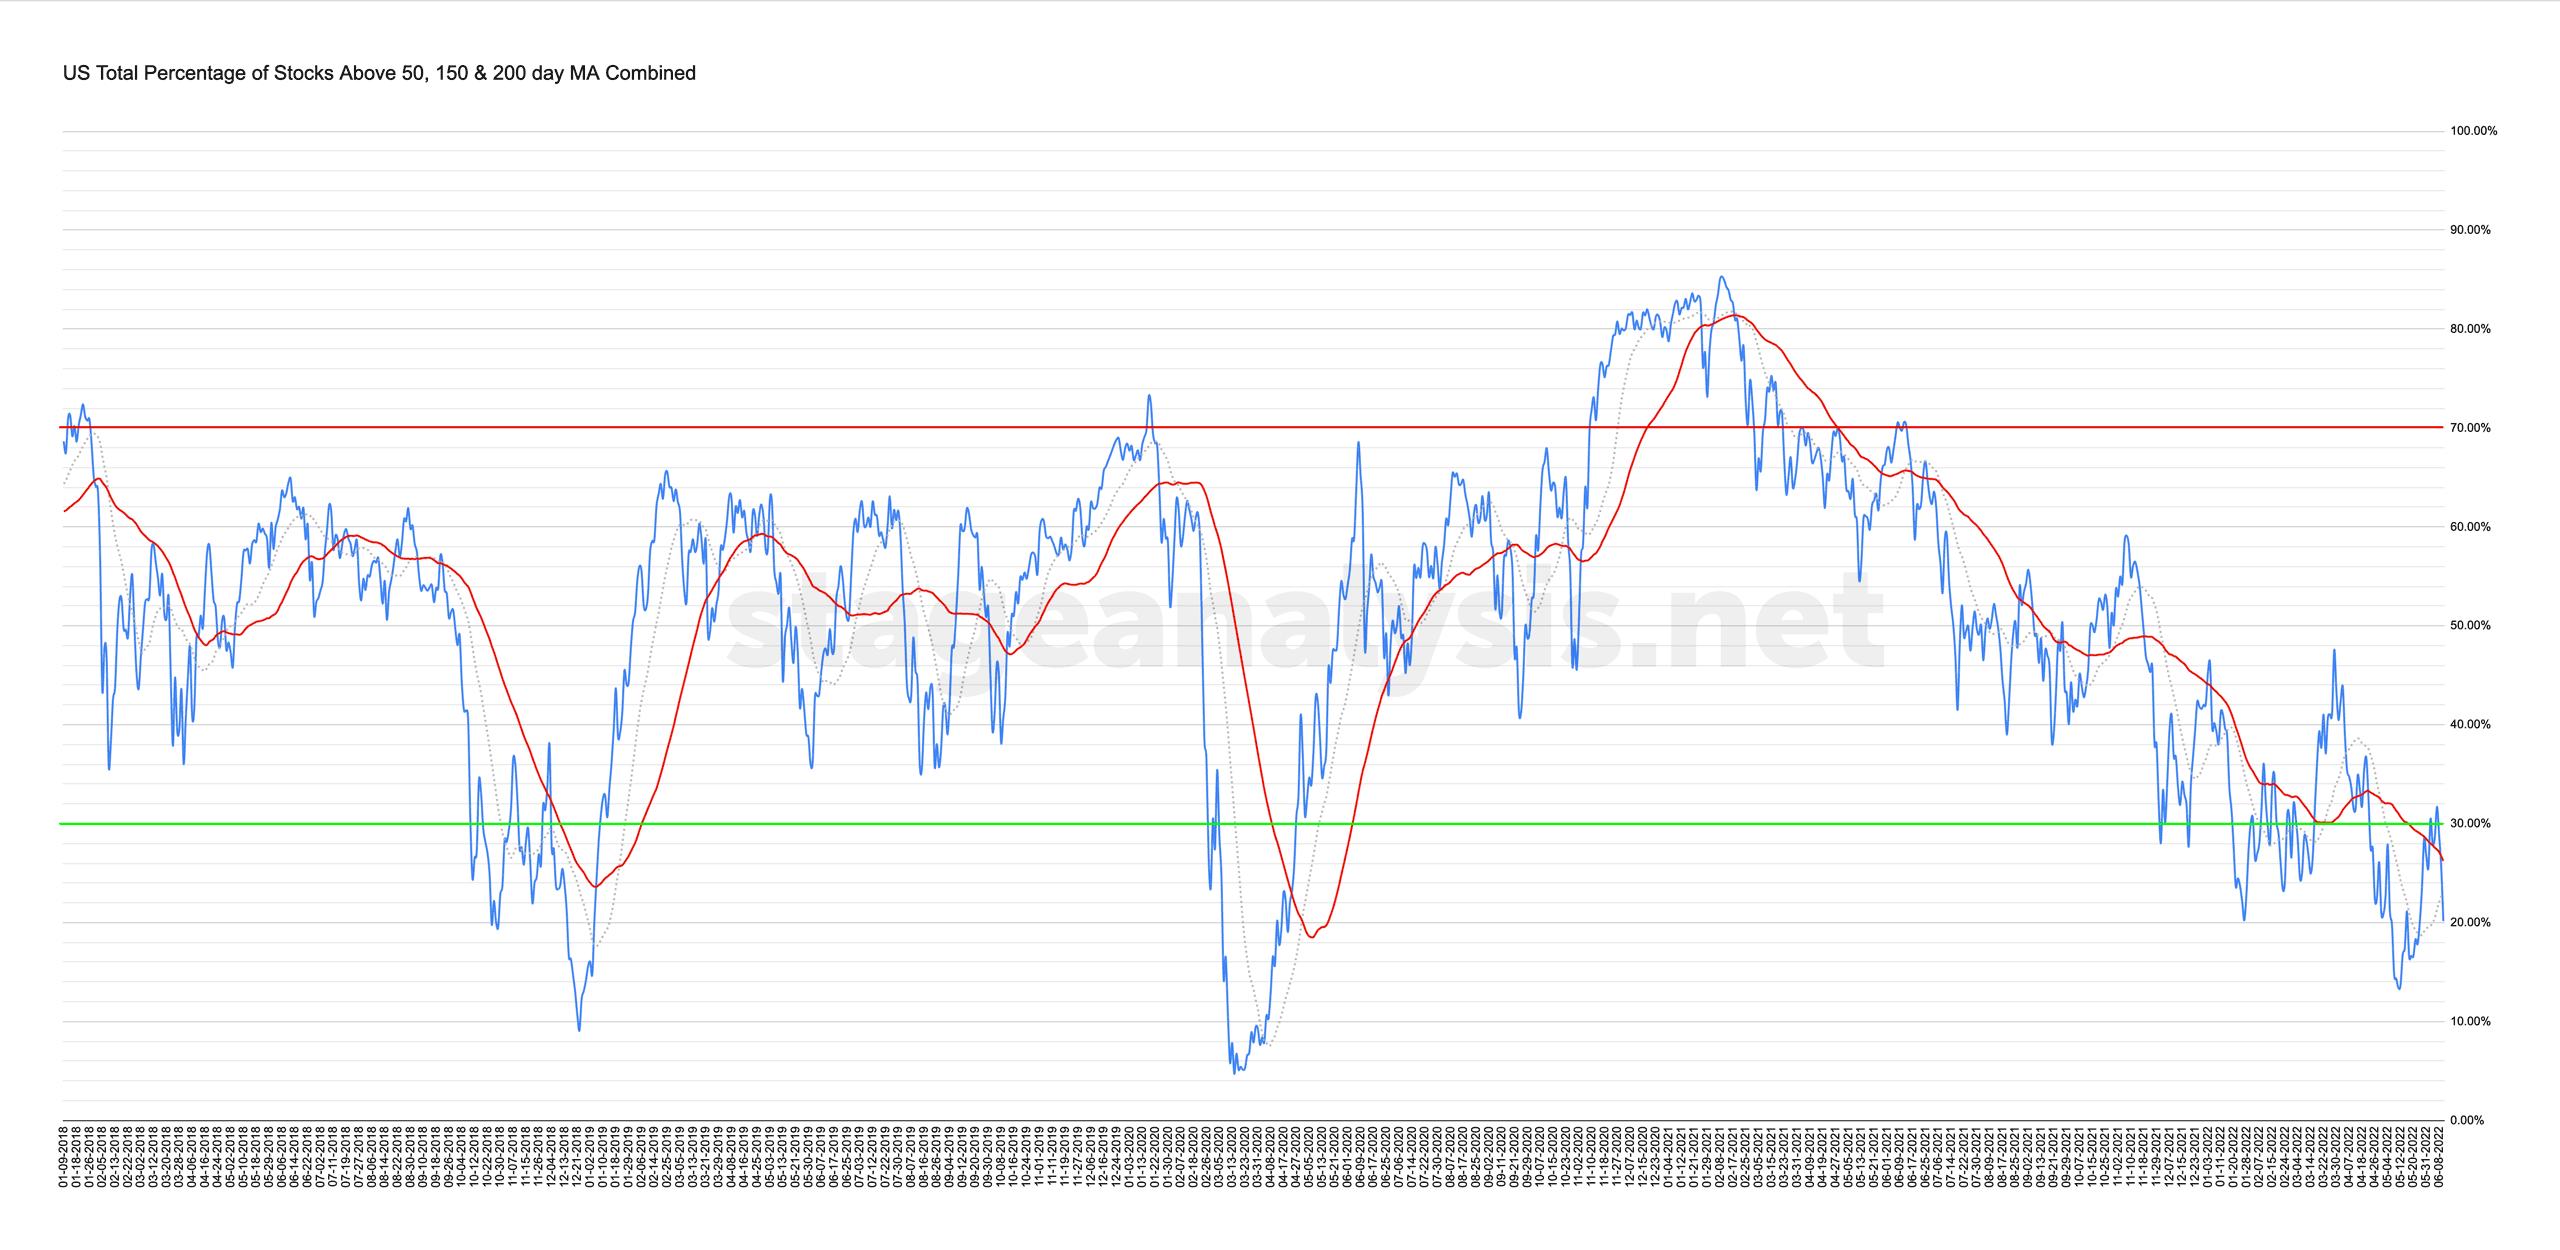
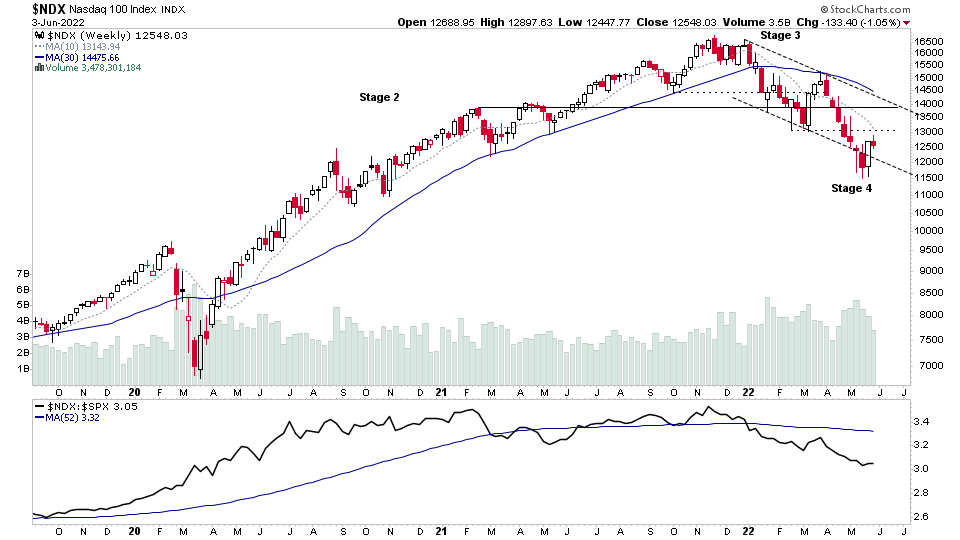
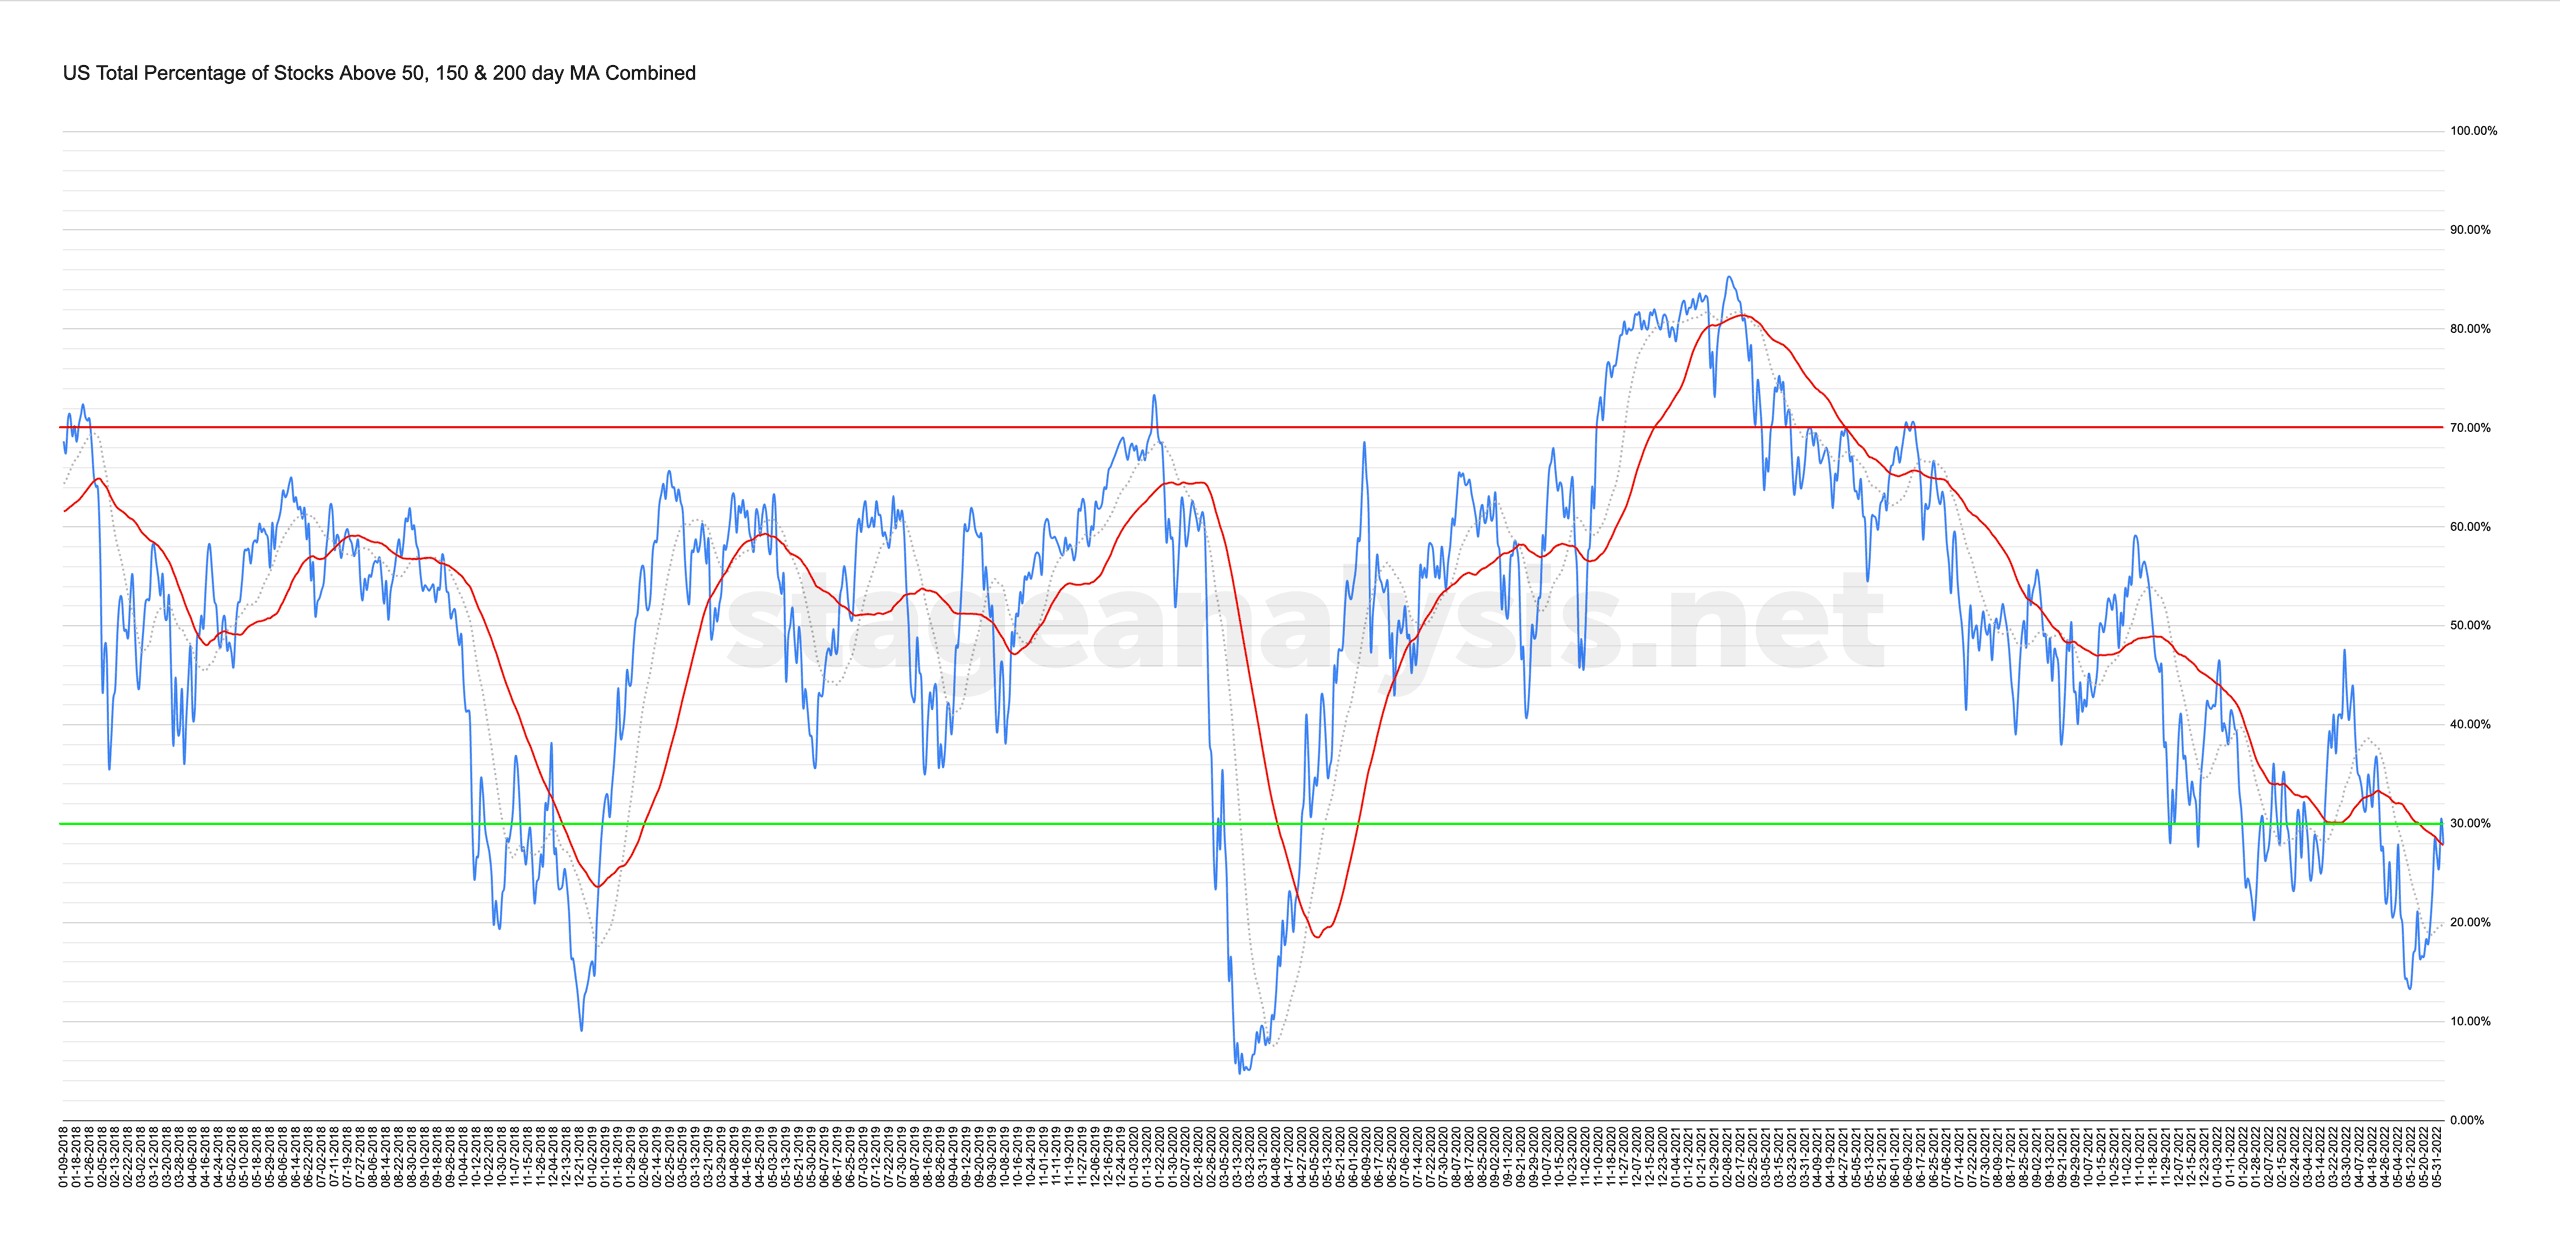
Custom Percentage of Stocks Above Their 50 Day, 150 Day & 200 Day Moving Averages Combined Market Breadth Charts for the Overall US Market, NYSE and Nasdaq for Market Timing and Strategy.
Read More
Blog
10 June, 2022
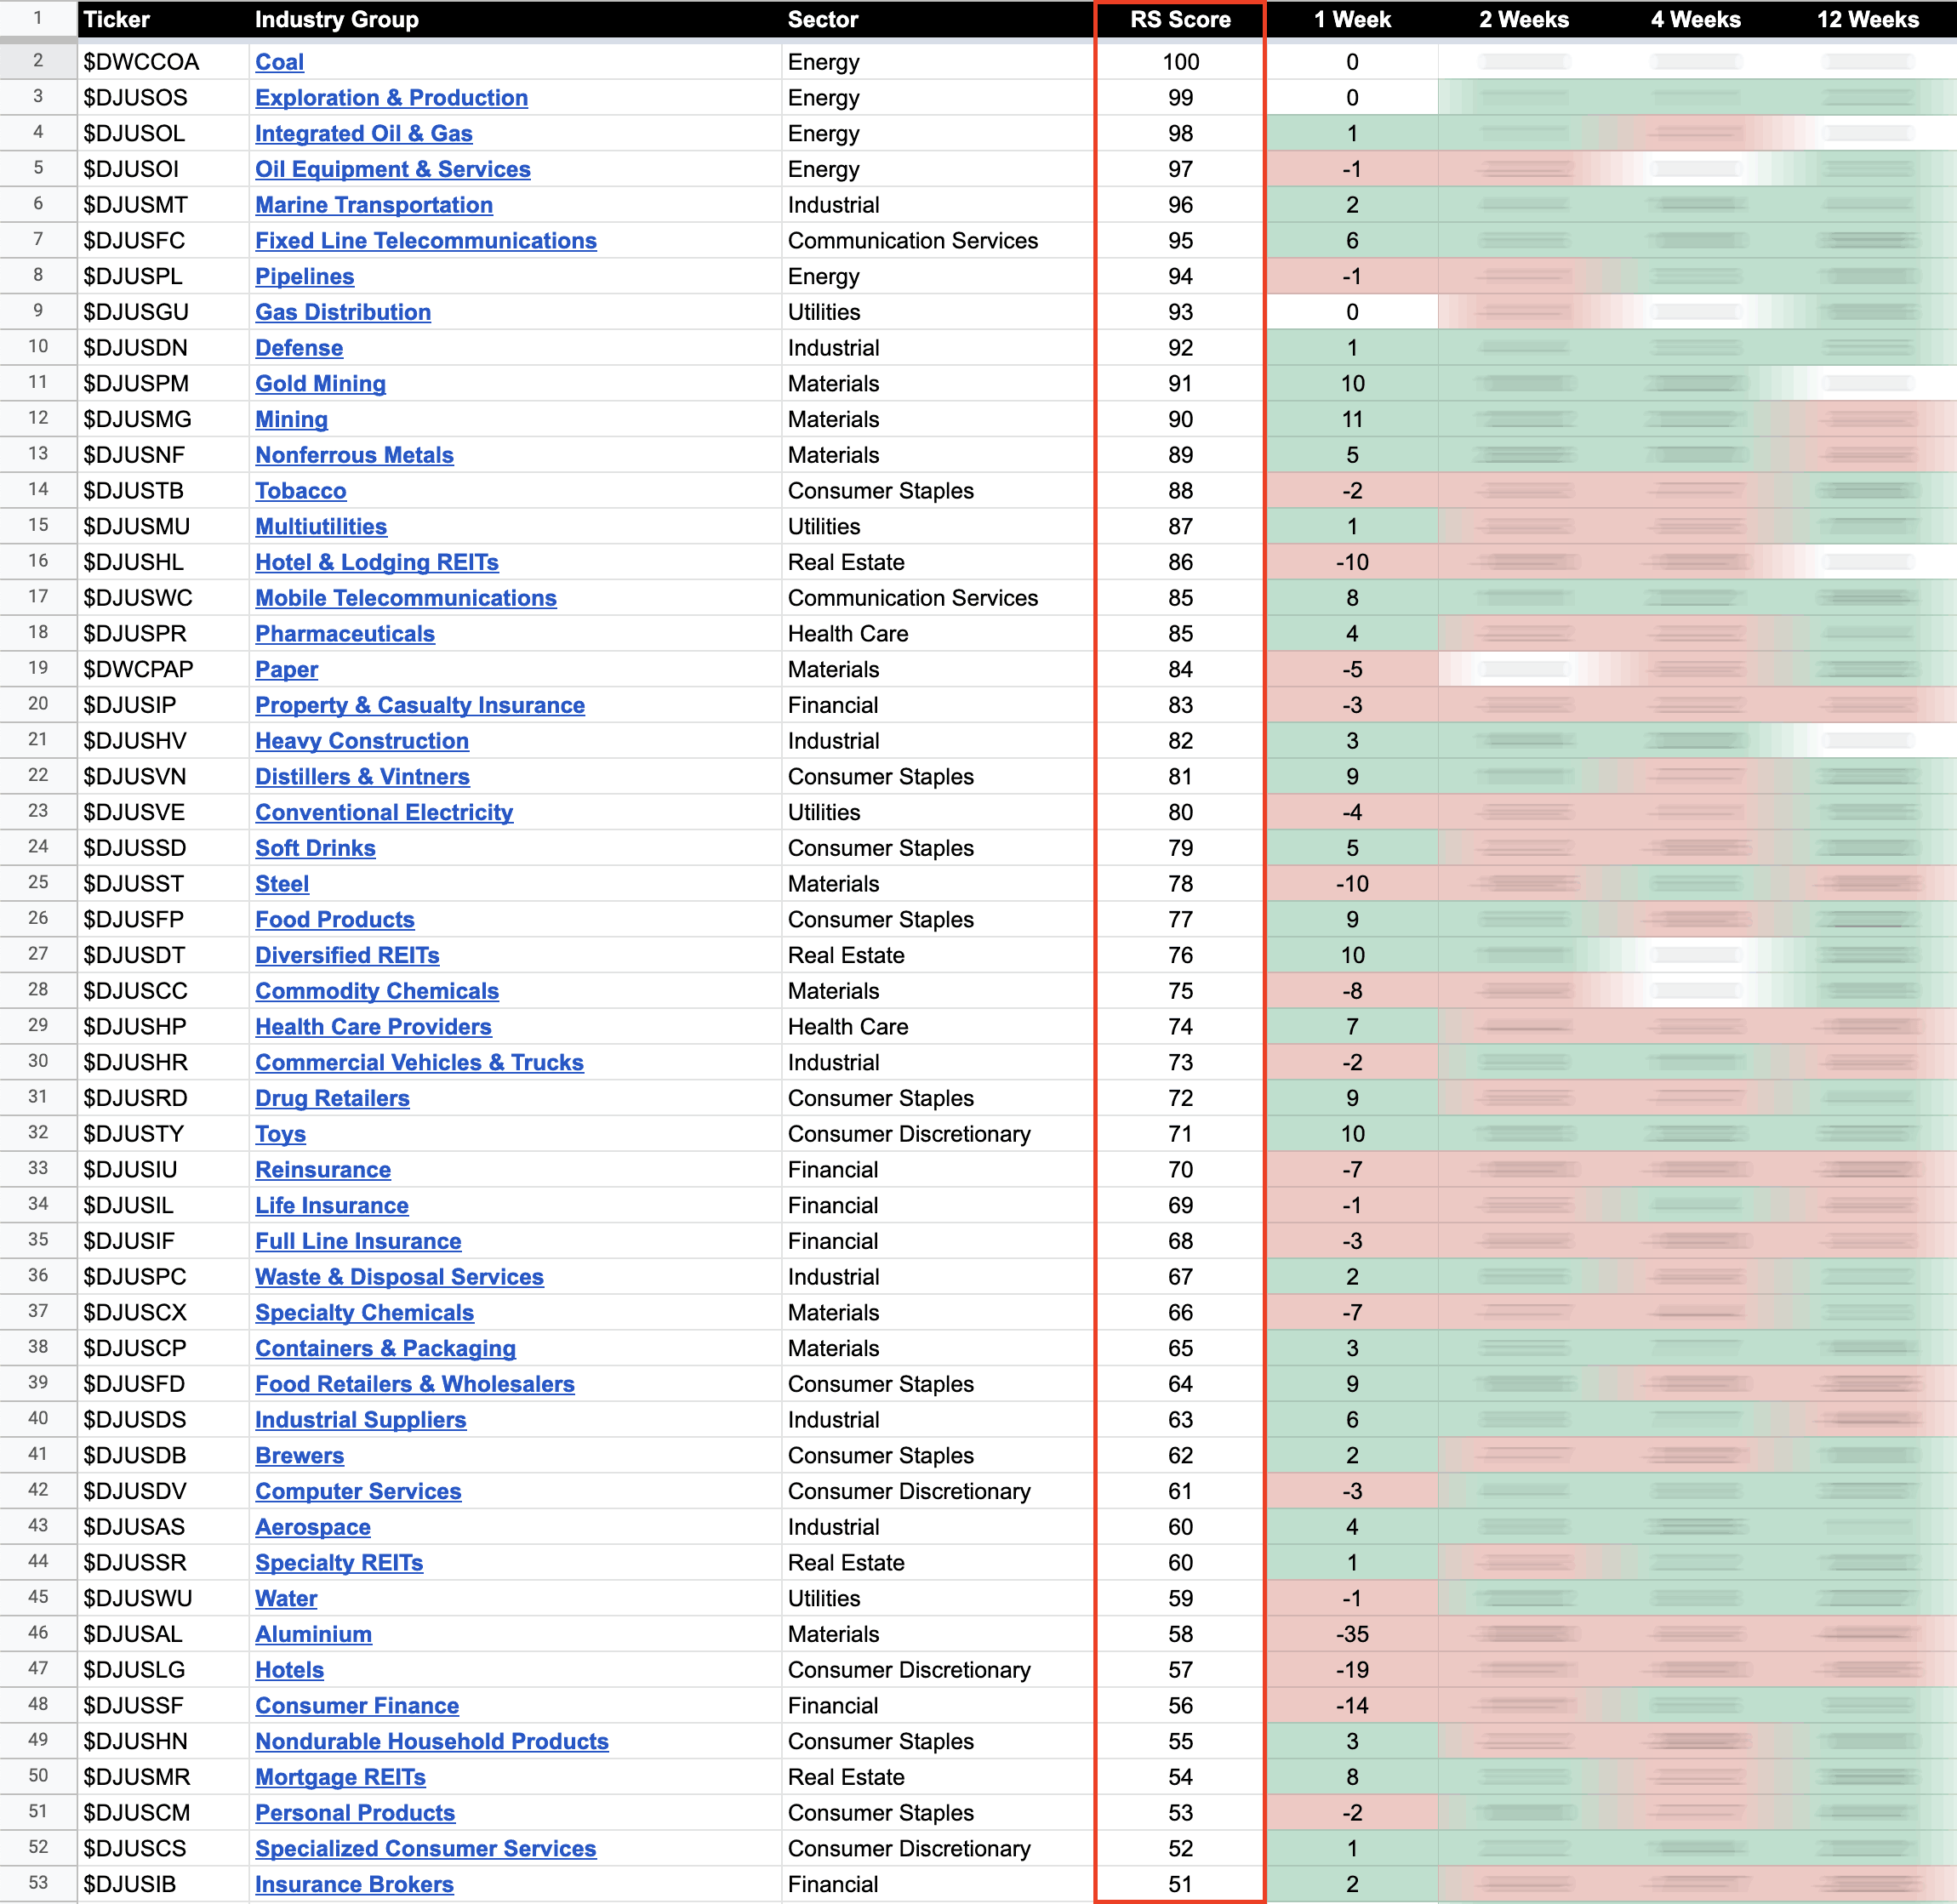
US Stocks Industry Groups Relative Strength Rankings
The purpose of the Relative Strength (RS) tables is to track the short, medium and long term RS changes of the individual groups to find the new leadership earlier than the crowd...
Read More
09 June, 2022
Stage 4 Trend Reasserts Itself – 10 June 2022
Broad based selling today with stocks accelerating to the downside in the afternoon session after initially attempting to hold up during the morning, and if you zoom into the intraday 2 hour chart...
Read More
08 June, 2022
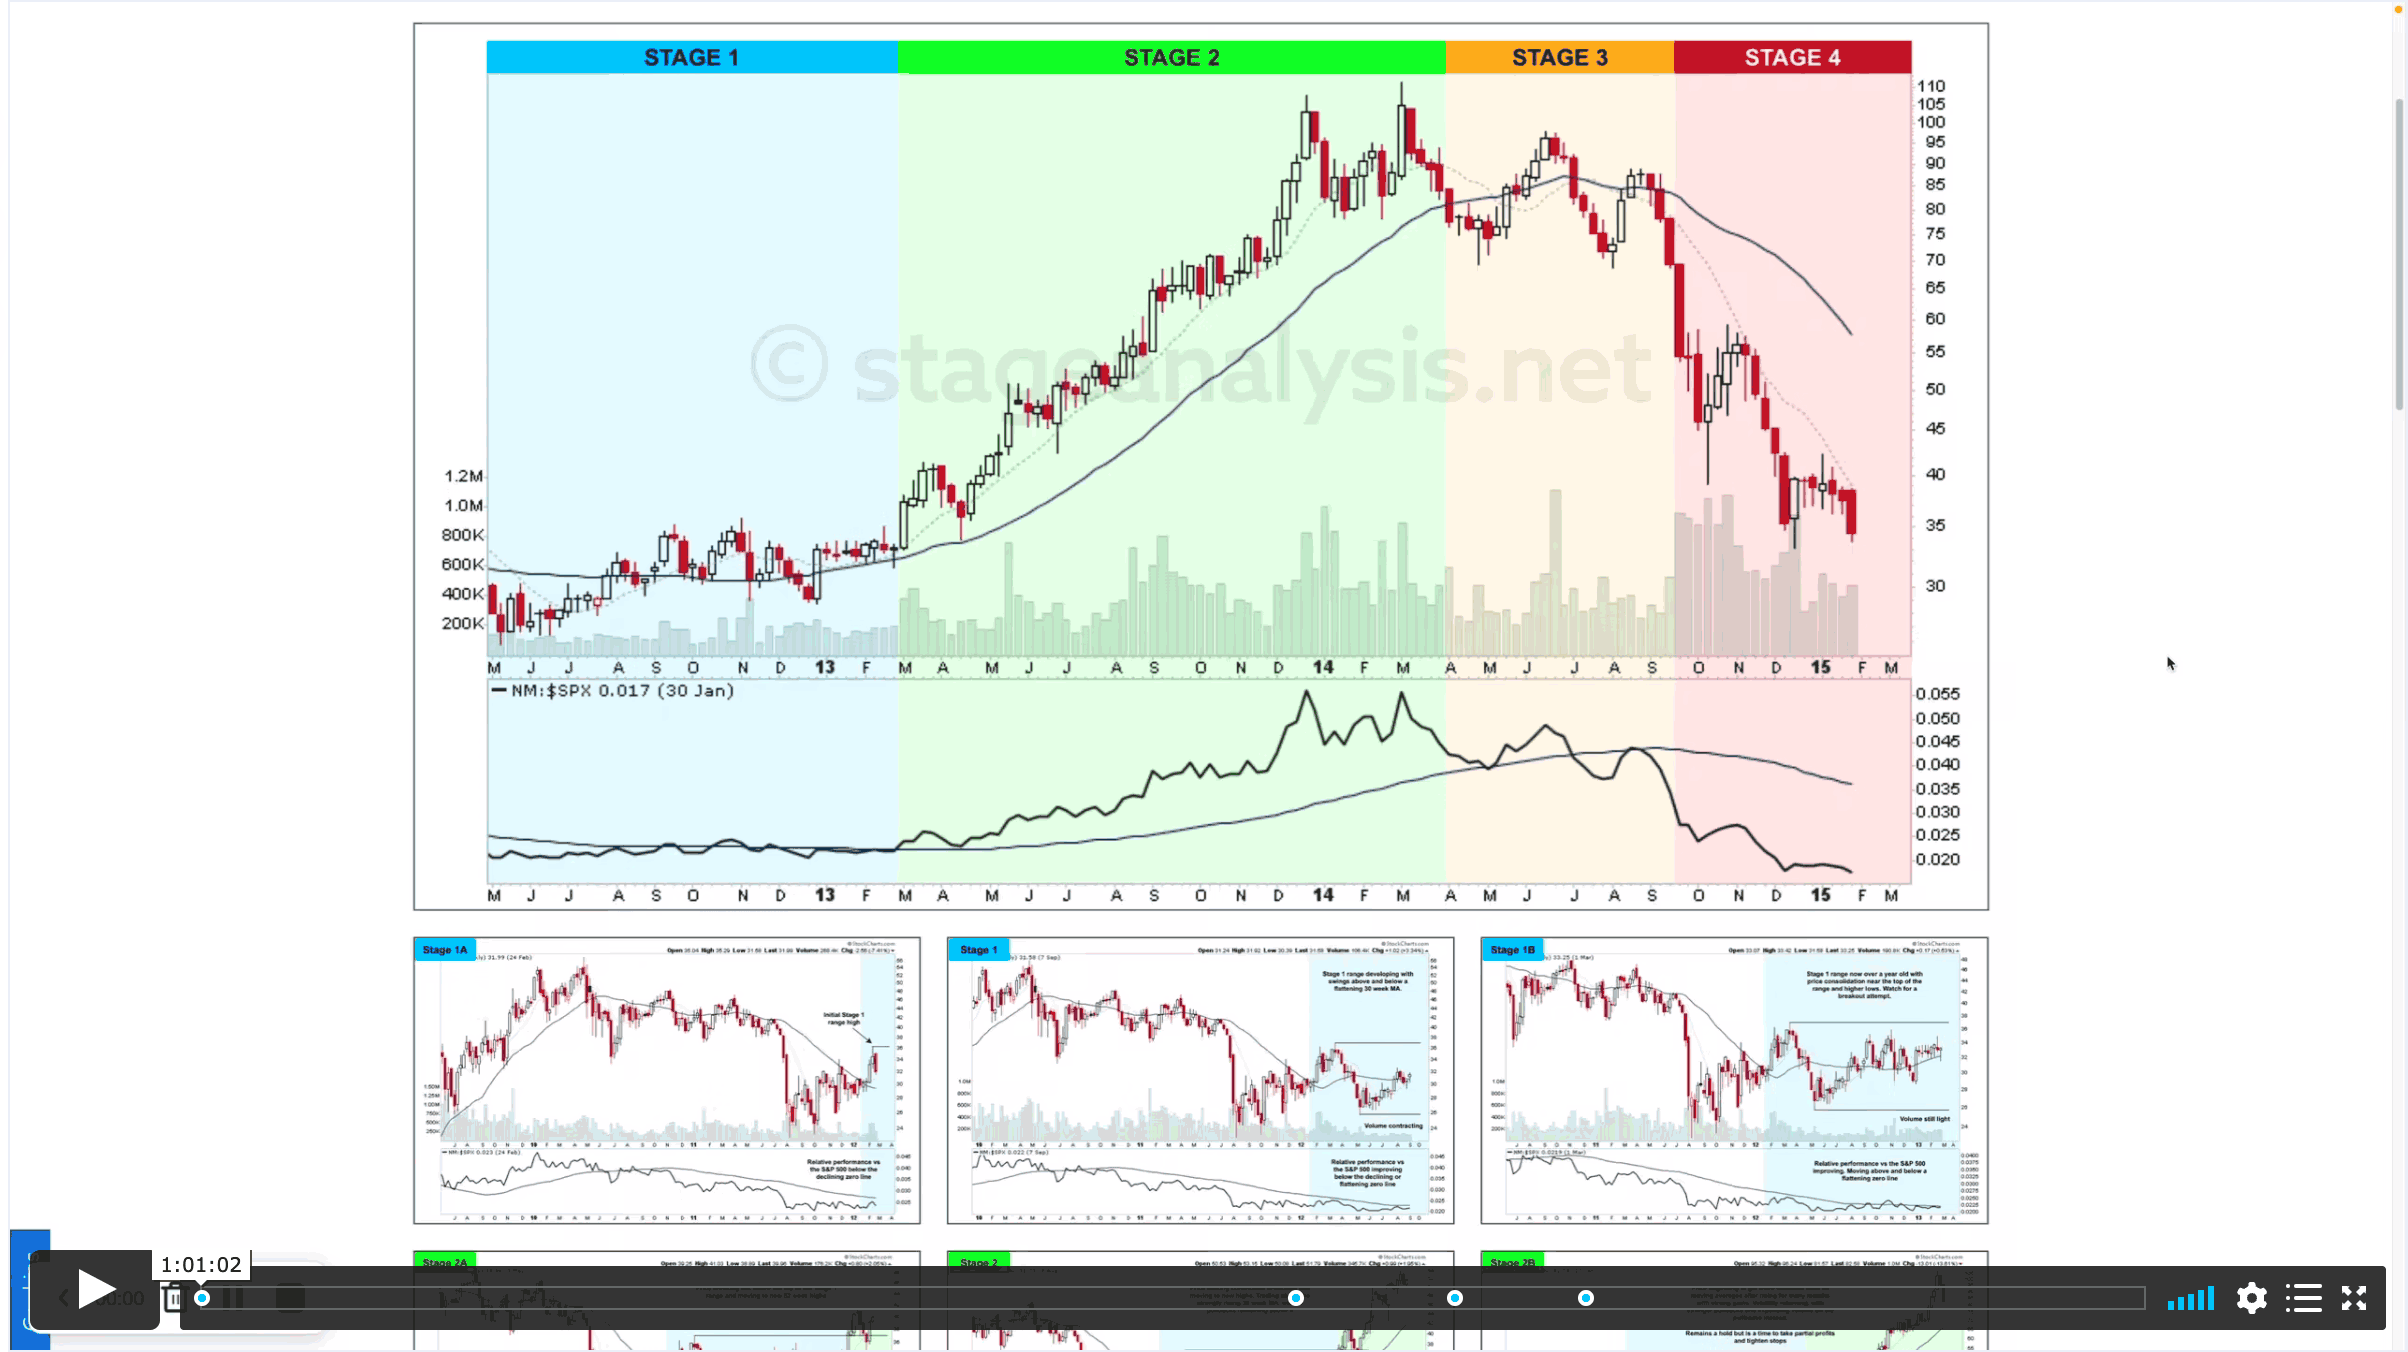
Stage Analysis Members Midweek Video – Searching for Stage 1 Bases in the Software Group – 8 June 2022 (1hr)
This weeks Stage Analysis Members midweek video features a special on the searching for Stage 1 Bases in the Software Group, as numerous software stocks have been appearing in the watchlist scans over the last month or so and exhibiting a change of behaviour...
Read More
07 June, 2022
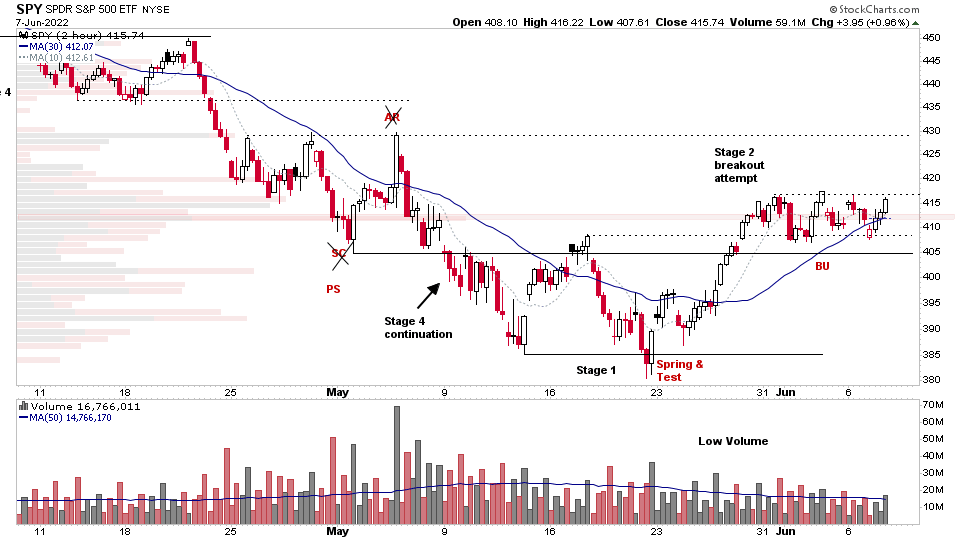
S&P 500 Rebounds from Short Term Moving Average Test and the US Stocks Watchlist – 7 June 2022
The S&P 500 gapped lower at the open, but rebounded from around its short term 21 day EMA early in the session and progressed steadily higher through the day to close near its highs at +0.95%...
Read More
07 June, 2022
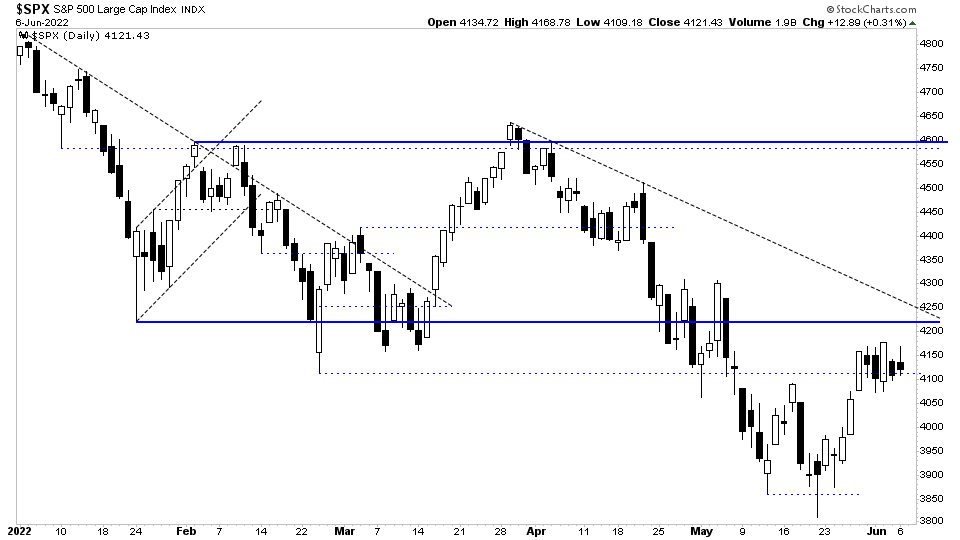
US Stock Market Continues to Digest the Recent Stage 4 Counter Trend Rally – 6 June 2022
The S&P 500 continues to digest the recent run up from the lows in a tight consolidation pattern (flag) with a higher high and a higher low than yesterdays bar today, but with a close at the lower end of the range.
Read More
05 June, 2022
Stage Analysis Members Weekend Video – 5 June 2022 (1hr 36mins)
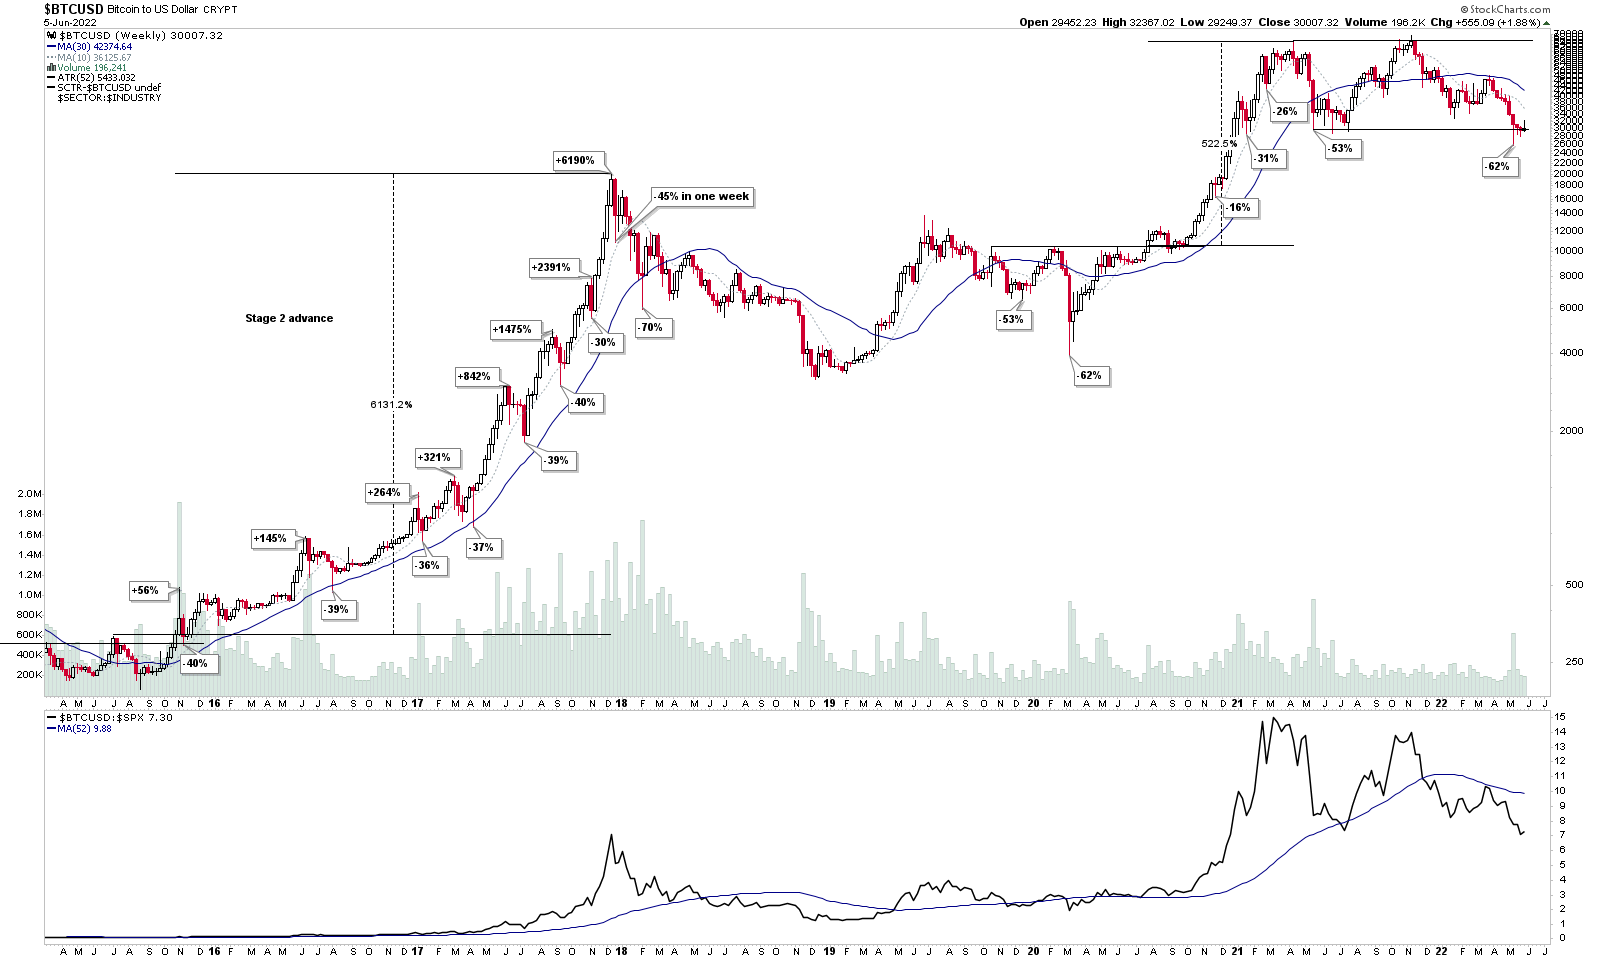
This weekends Stage Analysis Members Video features Stage Analysis of the major crypto coins – Bitcoin and Ethereum on multiple timeframes. And then in the members only portion of the video the usual Forest to the Trees approach...
Read More
05 June, 2022
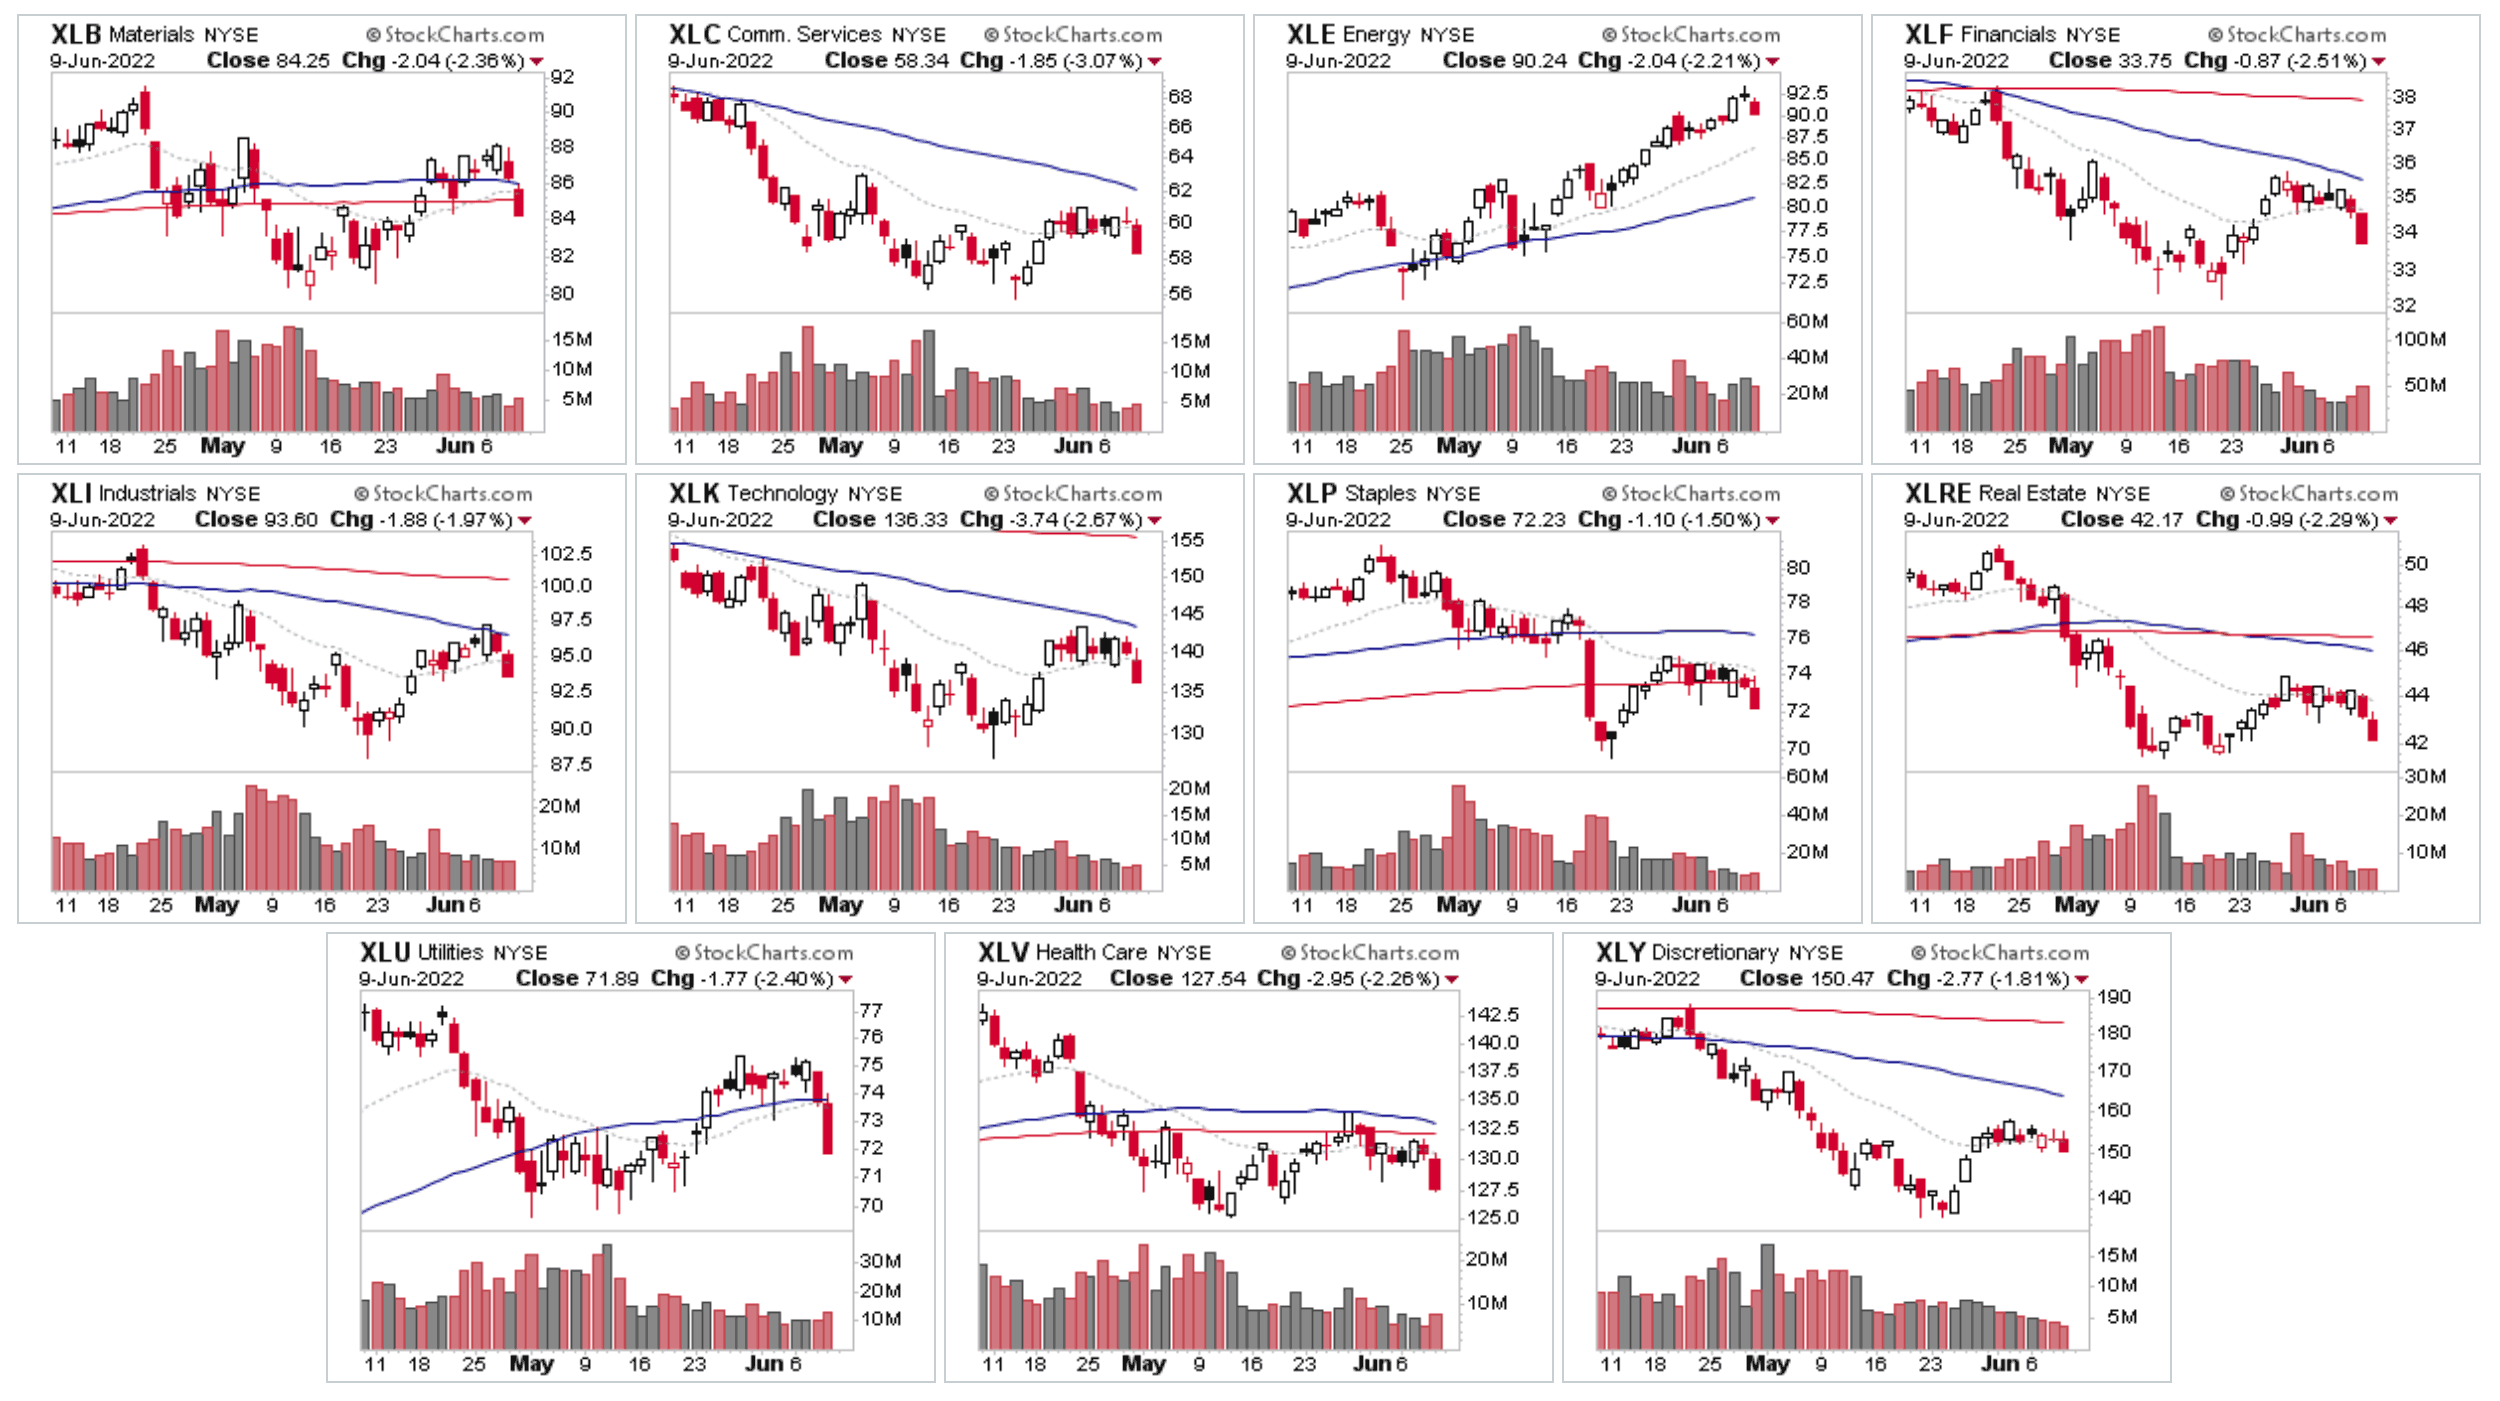
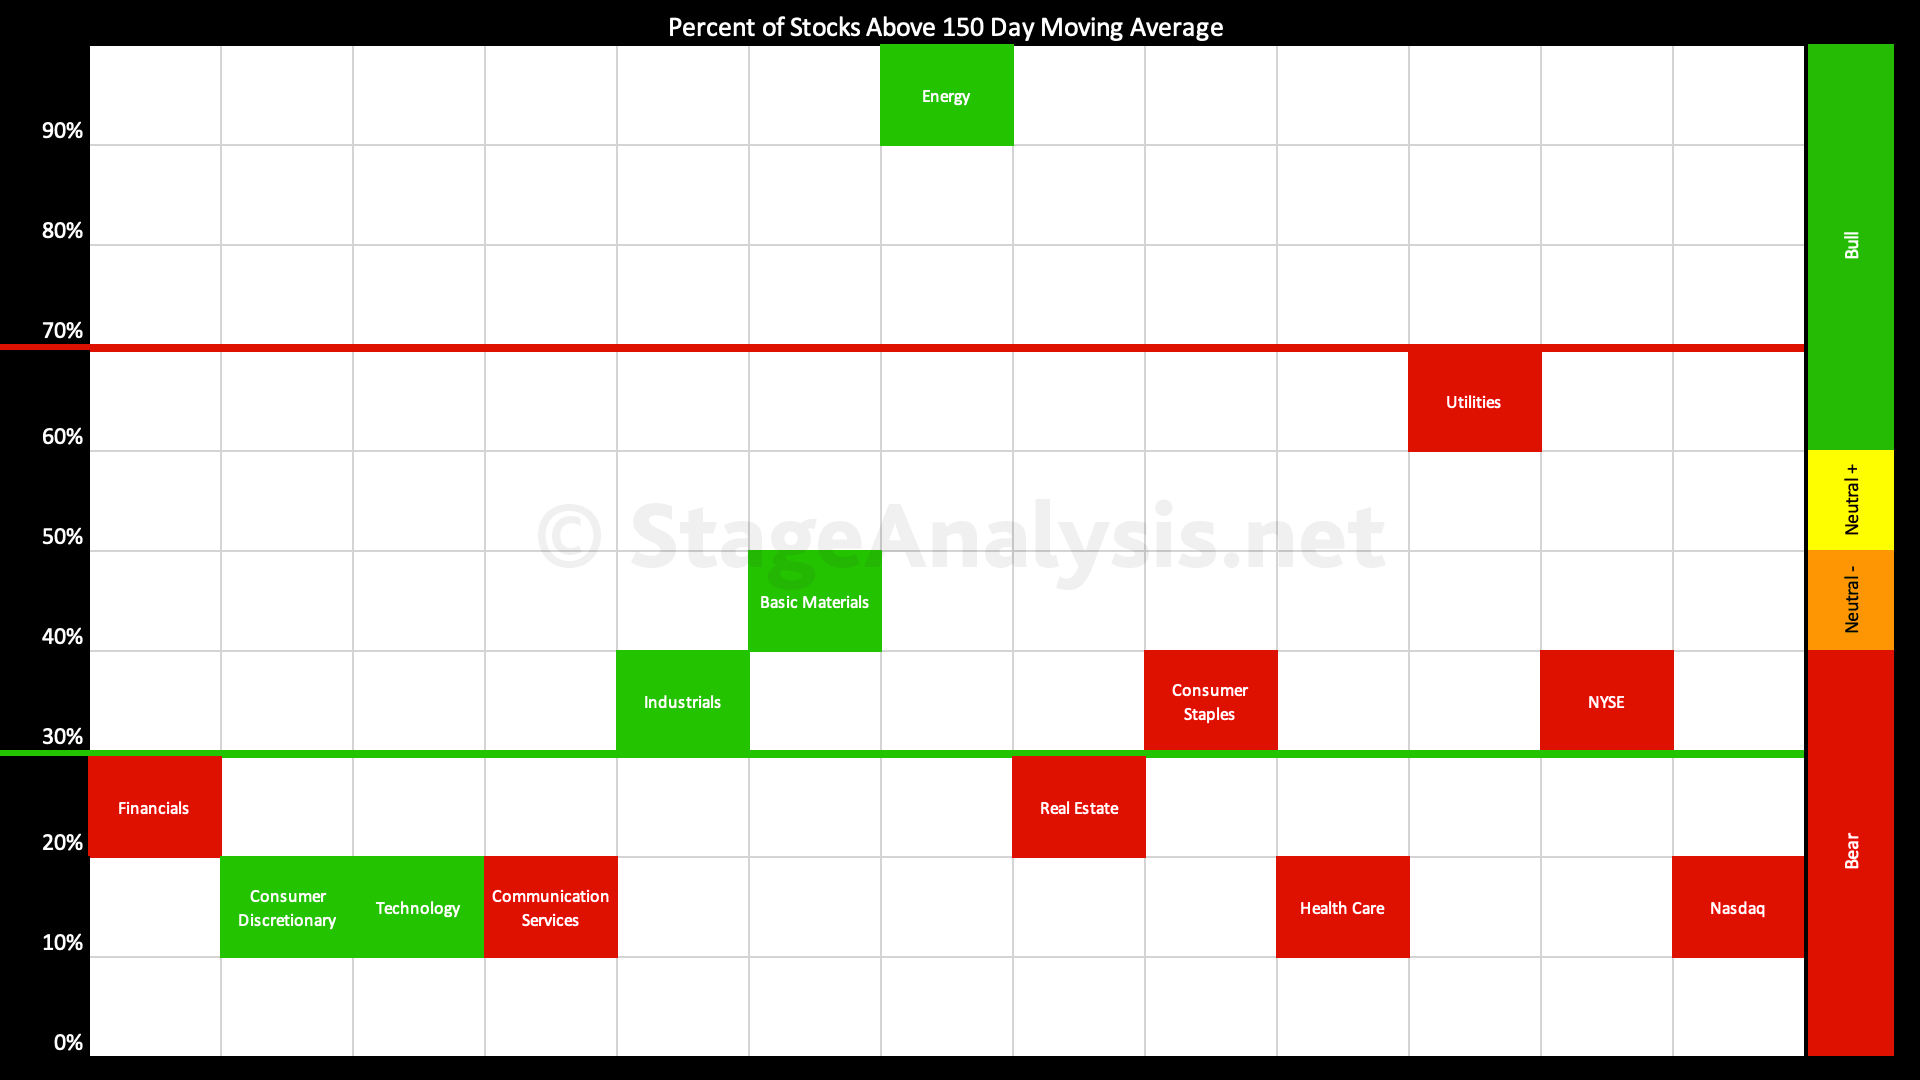
Sector Breadth: Percentage of US Stocks Above Their 150 day (30 Week) Moving Averages
Energy remains the leading group in the Stage 2 zone, and has pushed back above the 90% level once more. I talked in the previous post about looking for new leadership in sectors that reverse strongly back out of the lower zone, of which Basic Materials and Industrials have been the first movers in the last few weeks.
Read More
05 June, 2022
US Markets Consolidate at Resistance in Stage 4 and the US Stocks Watchlist – 5 June 2022
The majority of the major US market indexes all closed another week in Stage 4, except the AMEX, which continues to push towards new highs in Stage 2...
Read More
04 June, 2022
Market Breadth: Percentage of Stocks Above their 50 Day, 150 Day & 200 Day Moving Averages Combined
Custom Percentage of Stocks Above Their 50 Day, 150 Day & 200 Day Moving Averages Combined Market Breadth Charts for the Overall US Market, NYSE and Nasdaq for Market Timing and Strategy.
Read More

