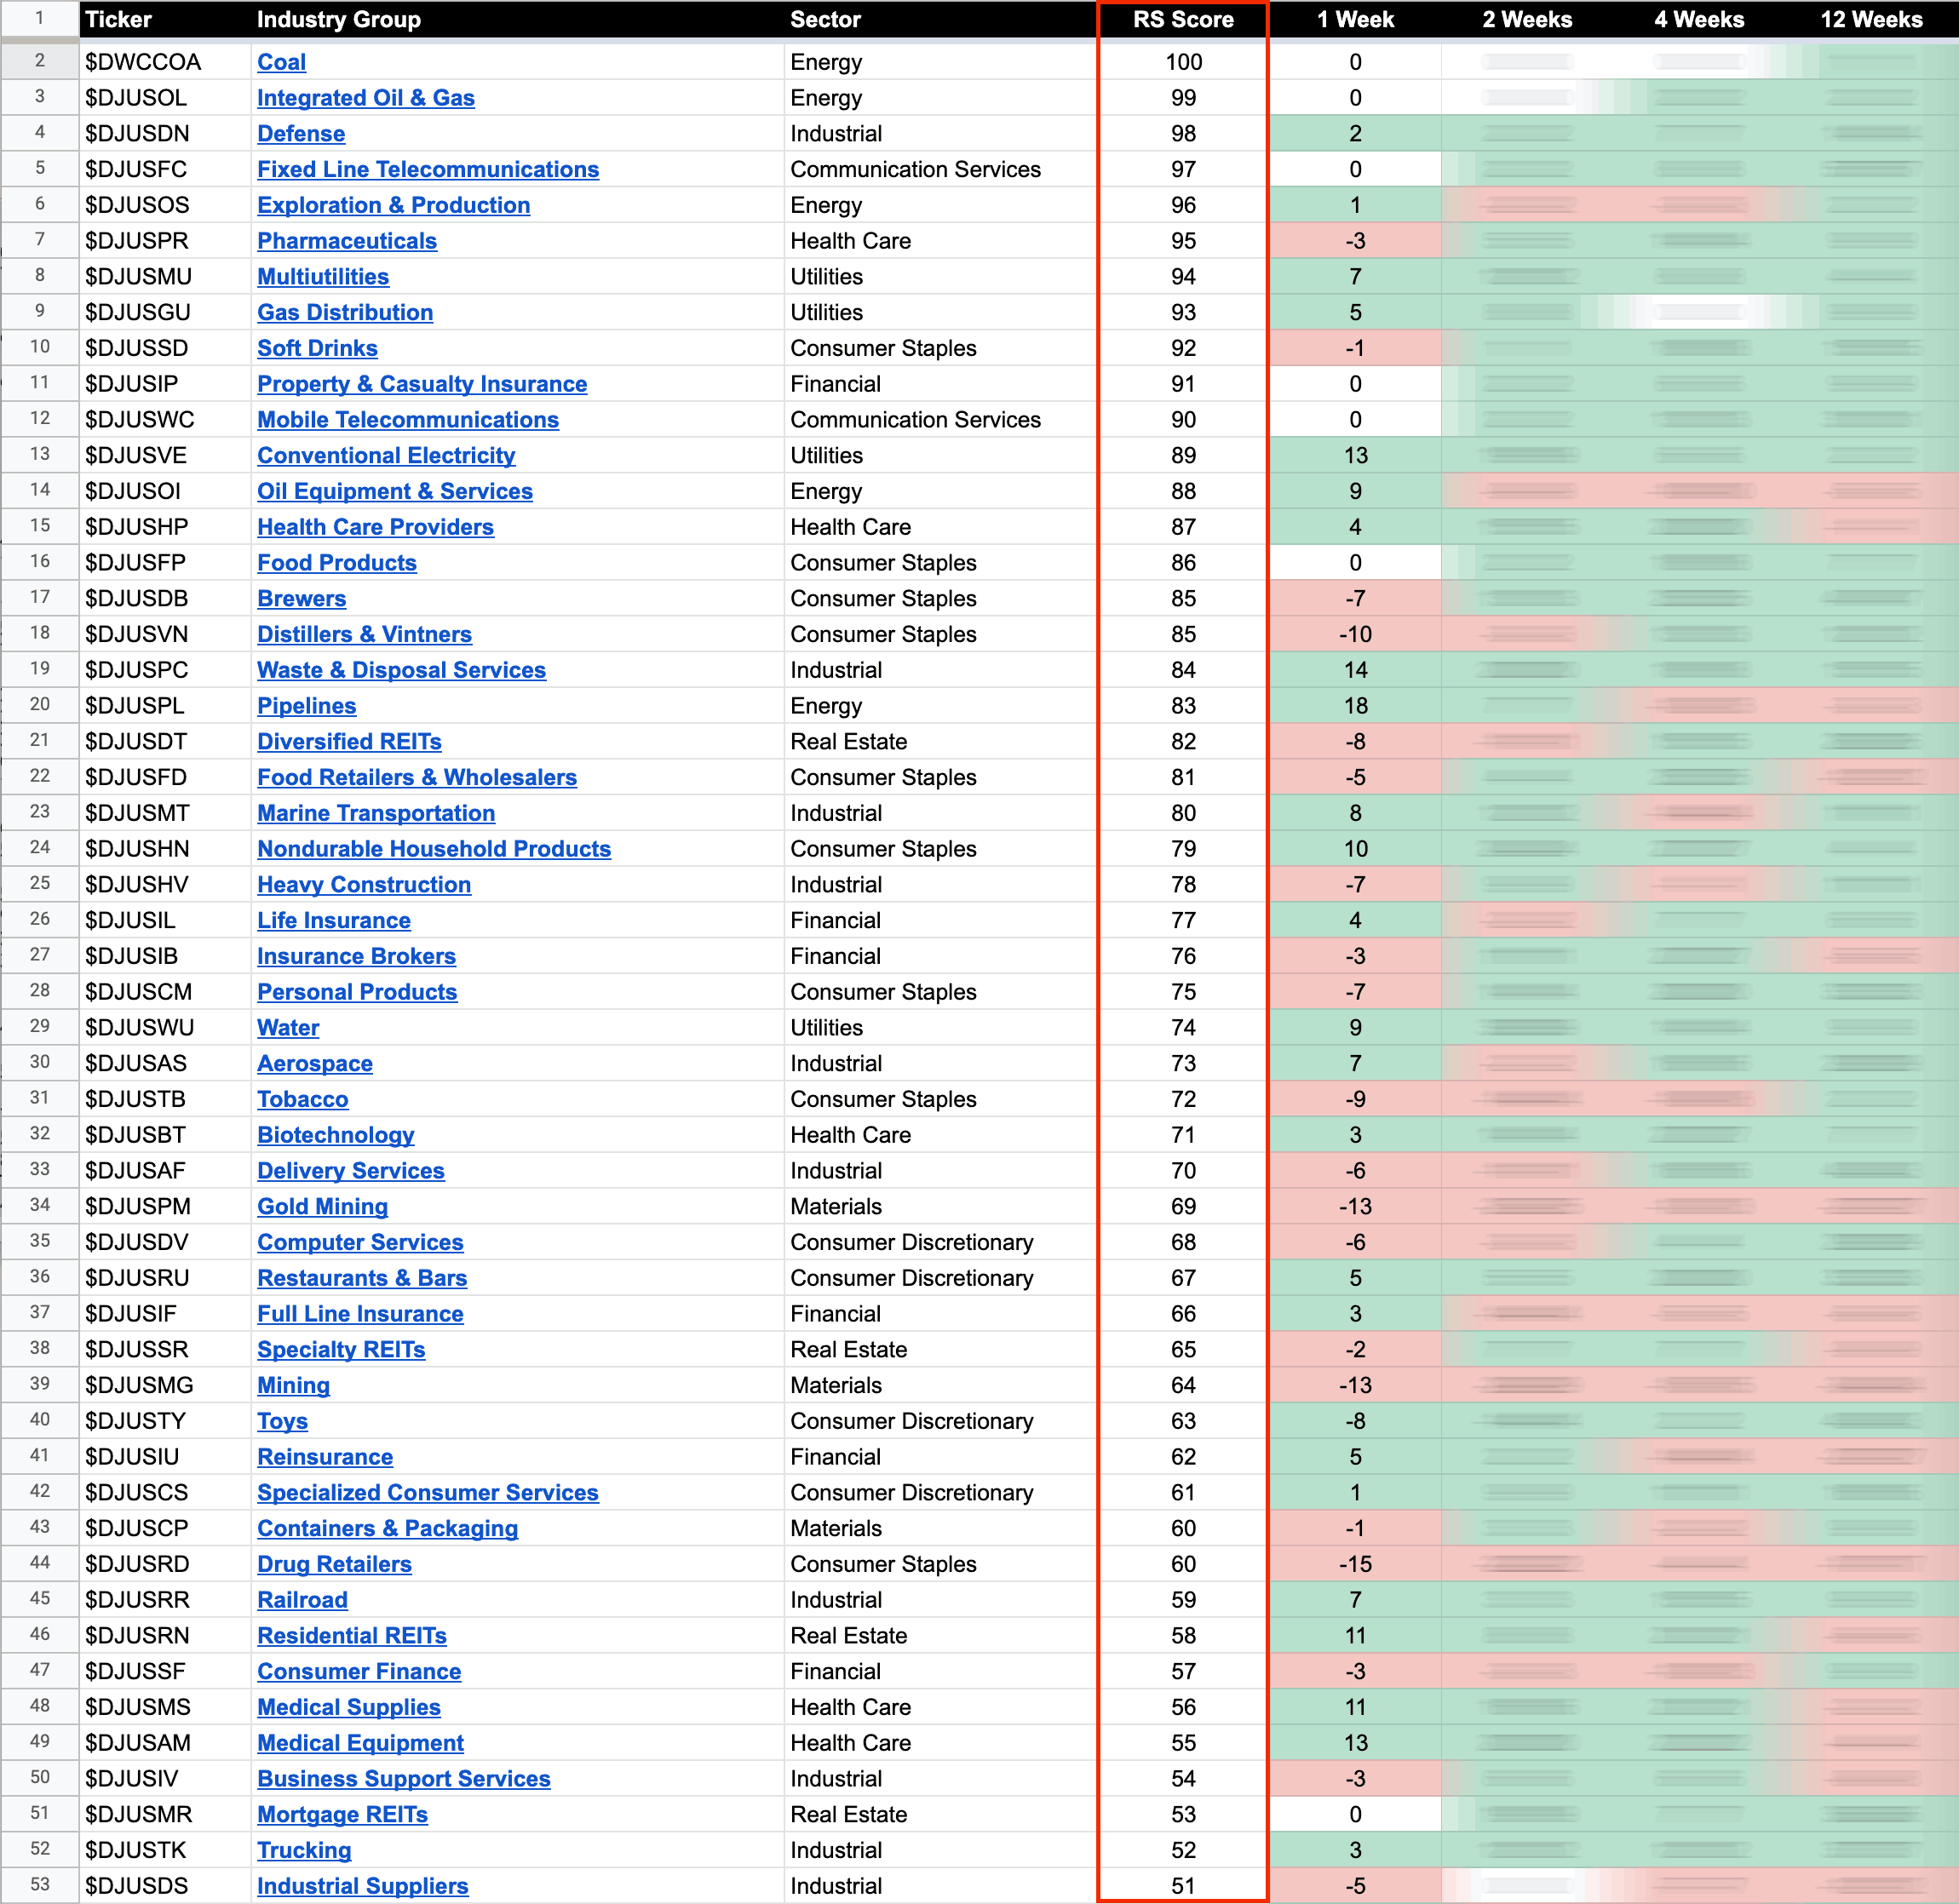
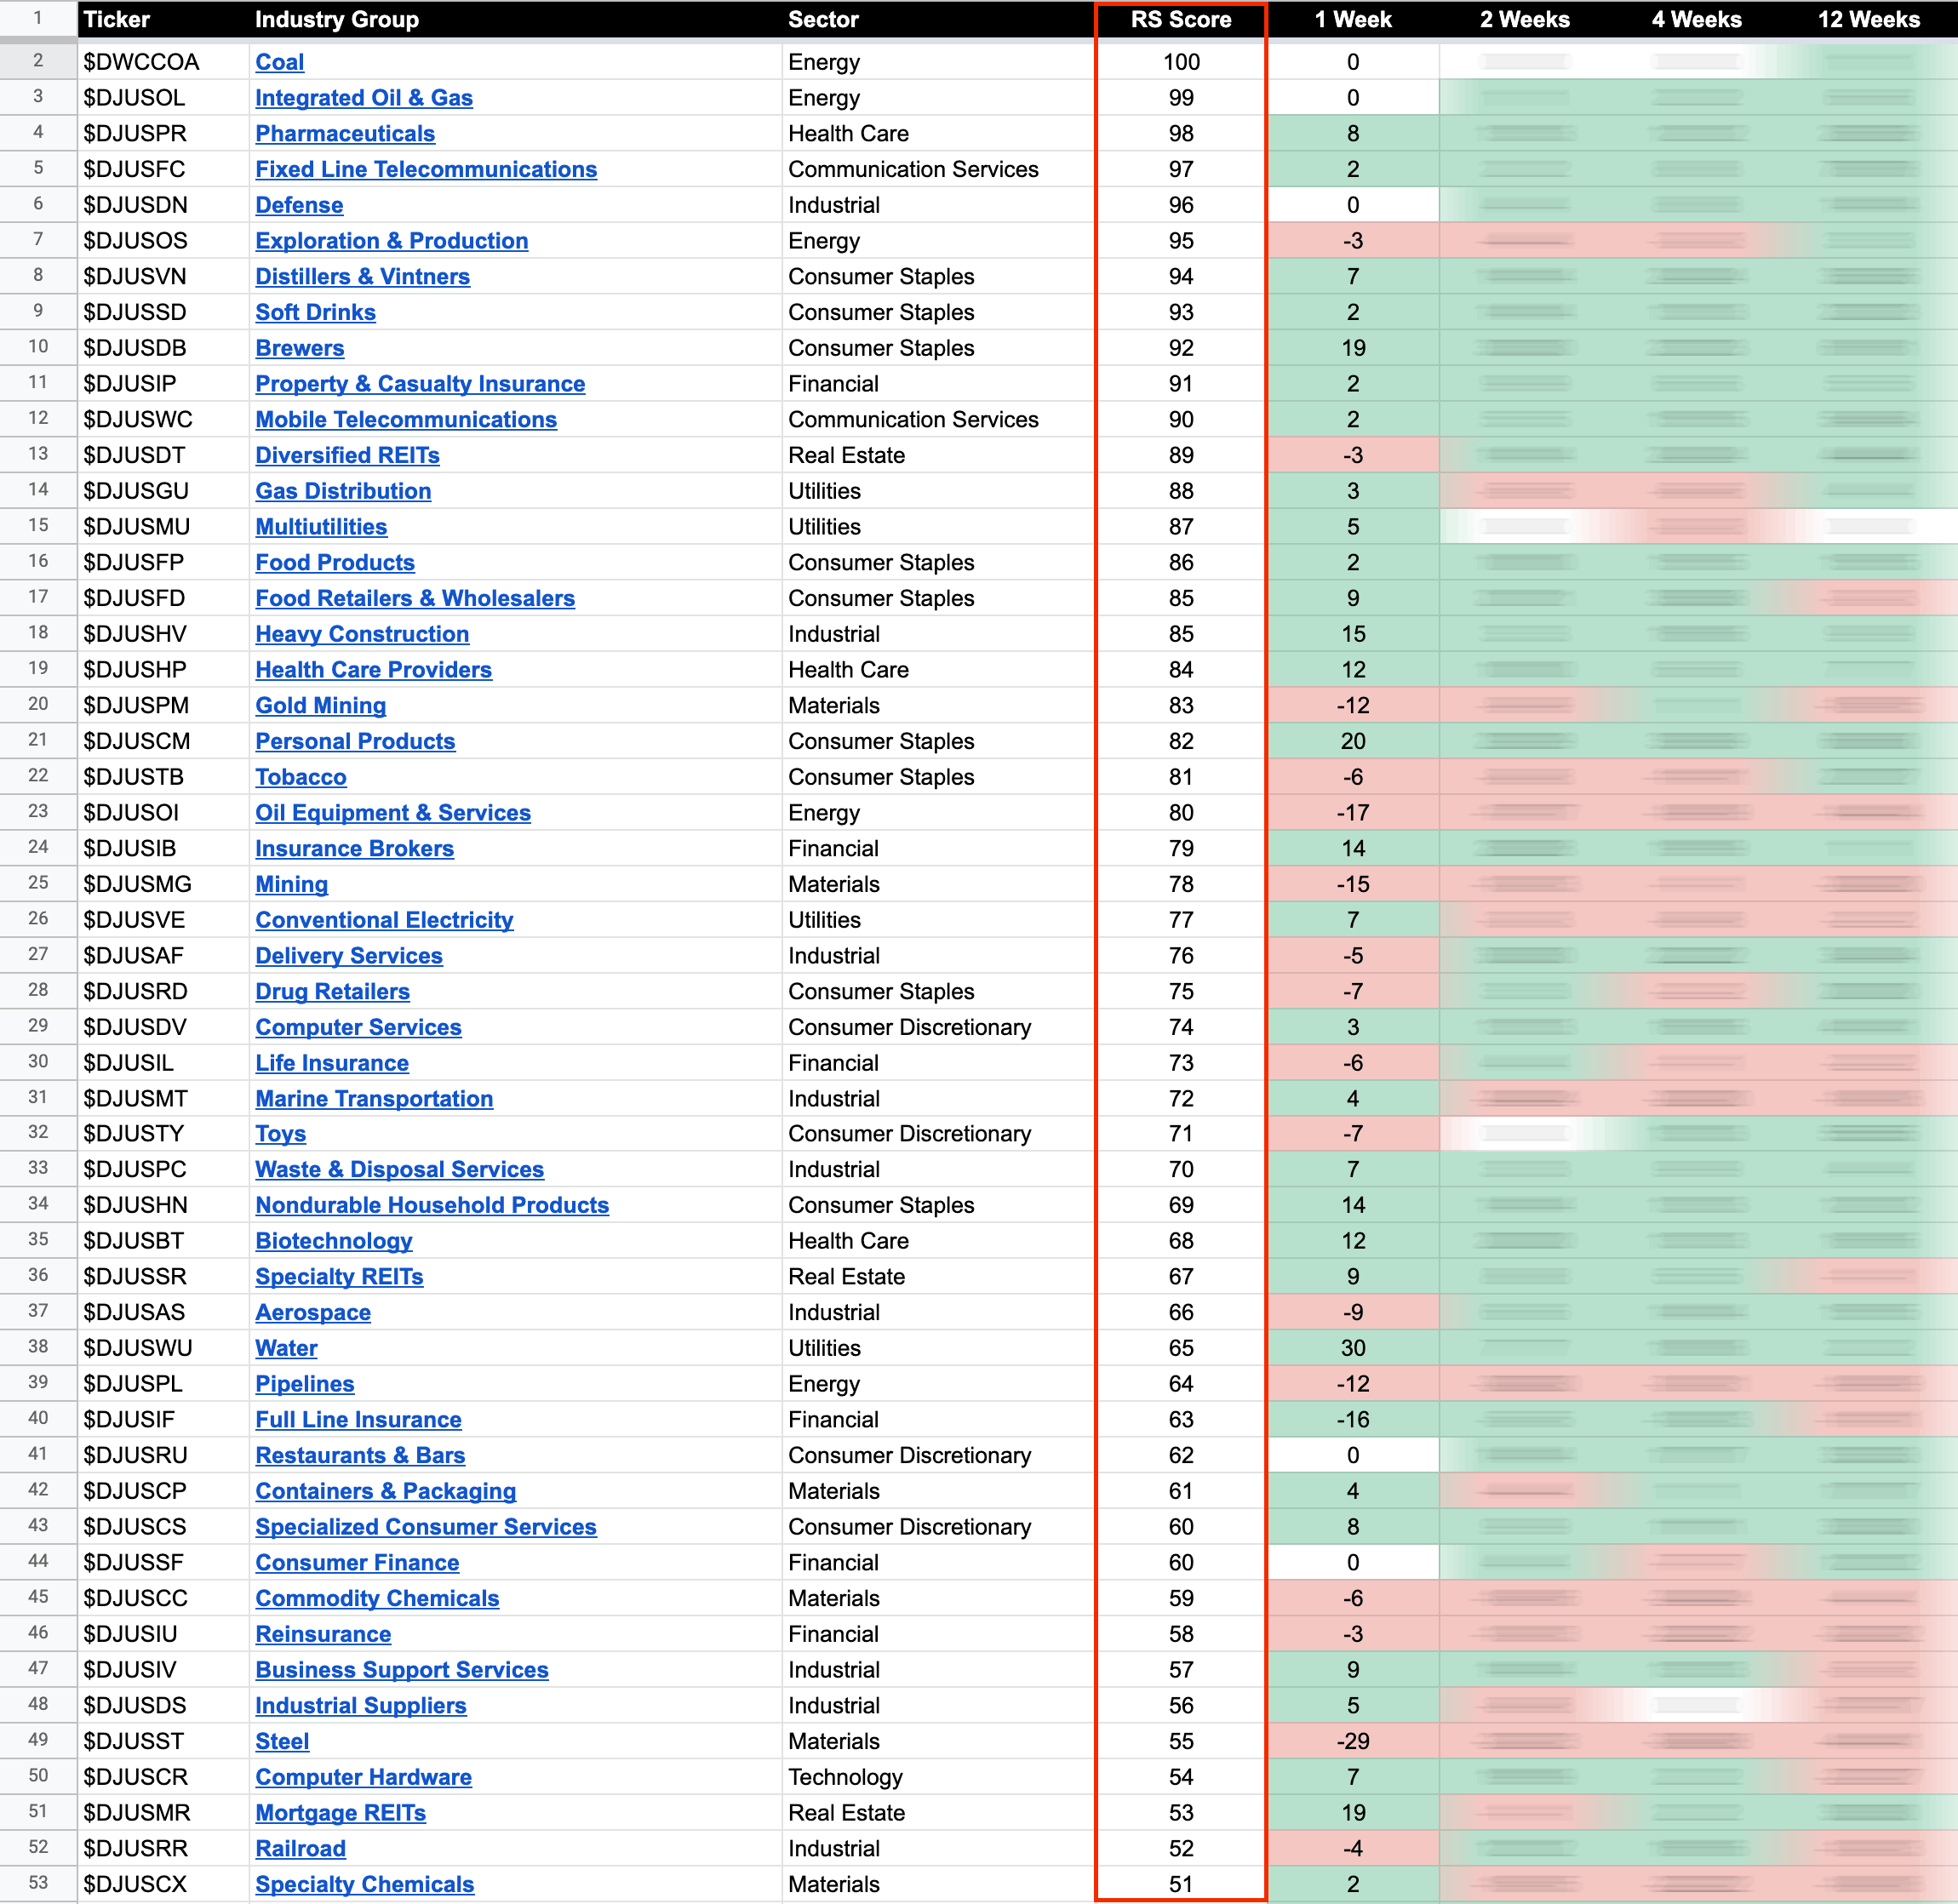
The purpose of the Relative Strength (RS) tables is to track the short, medium and long term RS changes of the individual groups to find the new leadership earlier than the crowd...
Read More
Blog
01 July, 2022
US Stocks Industry Groups Relative Strength Rankings
30 June, 2022
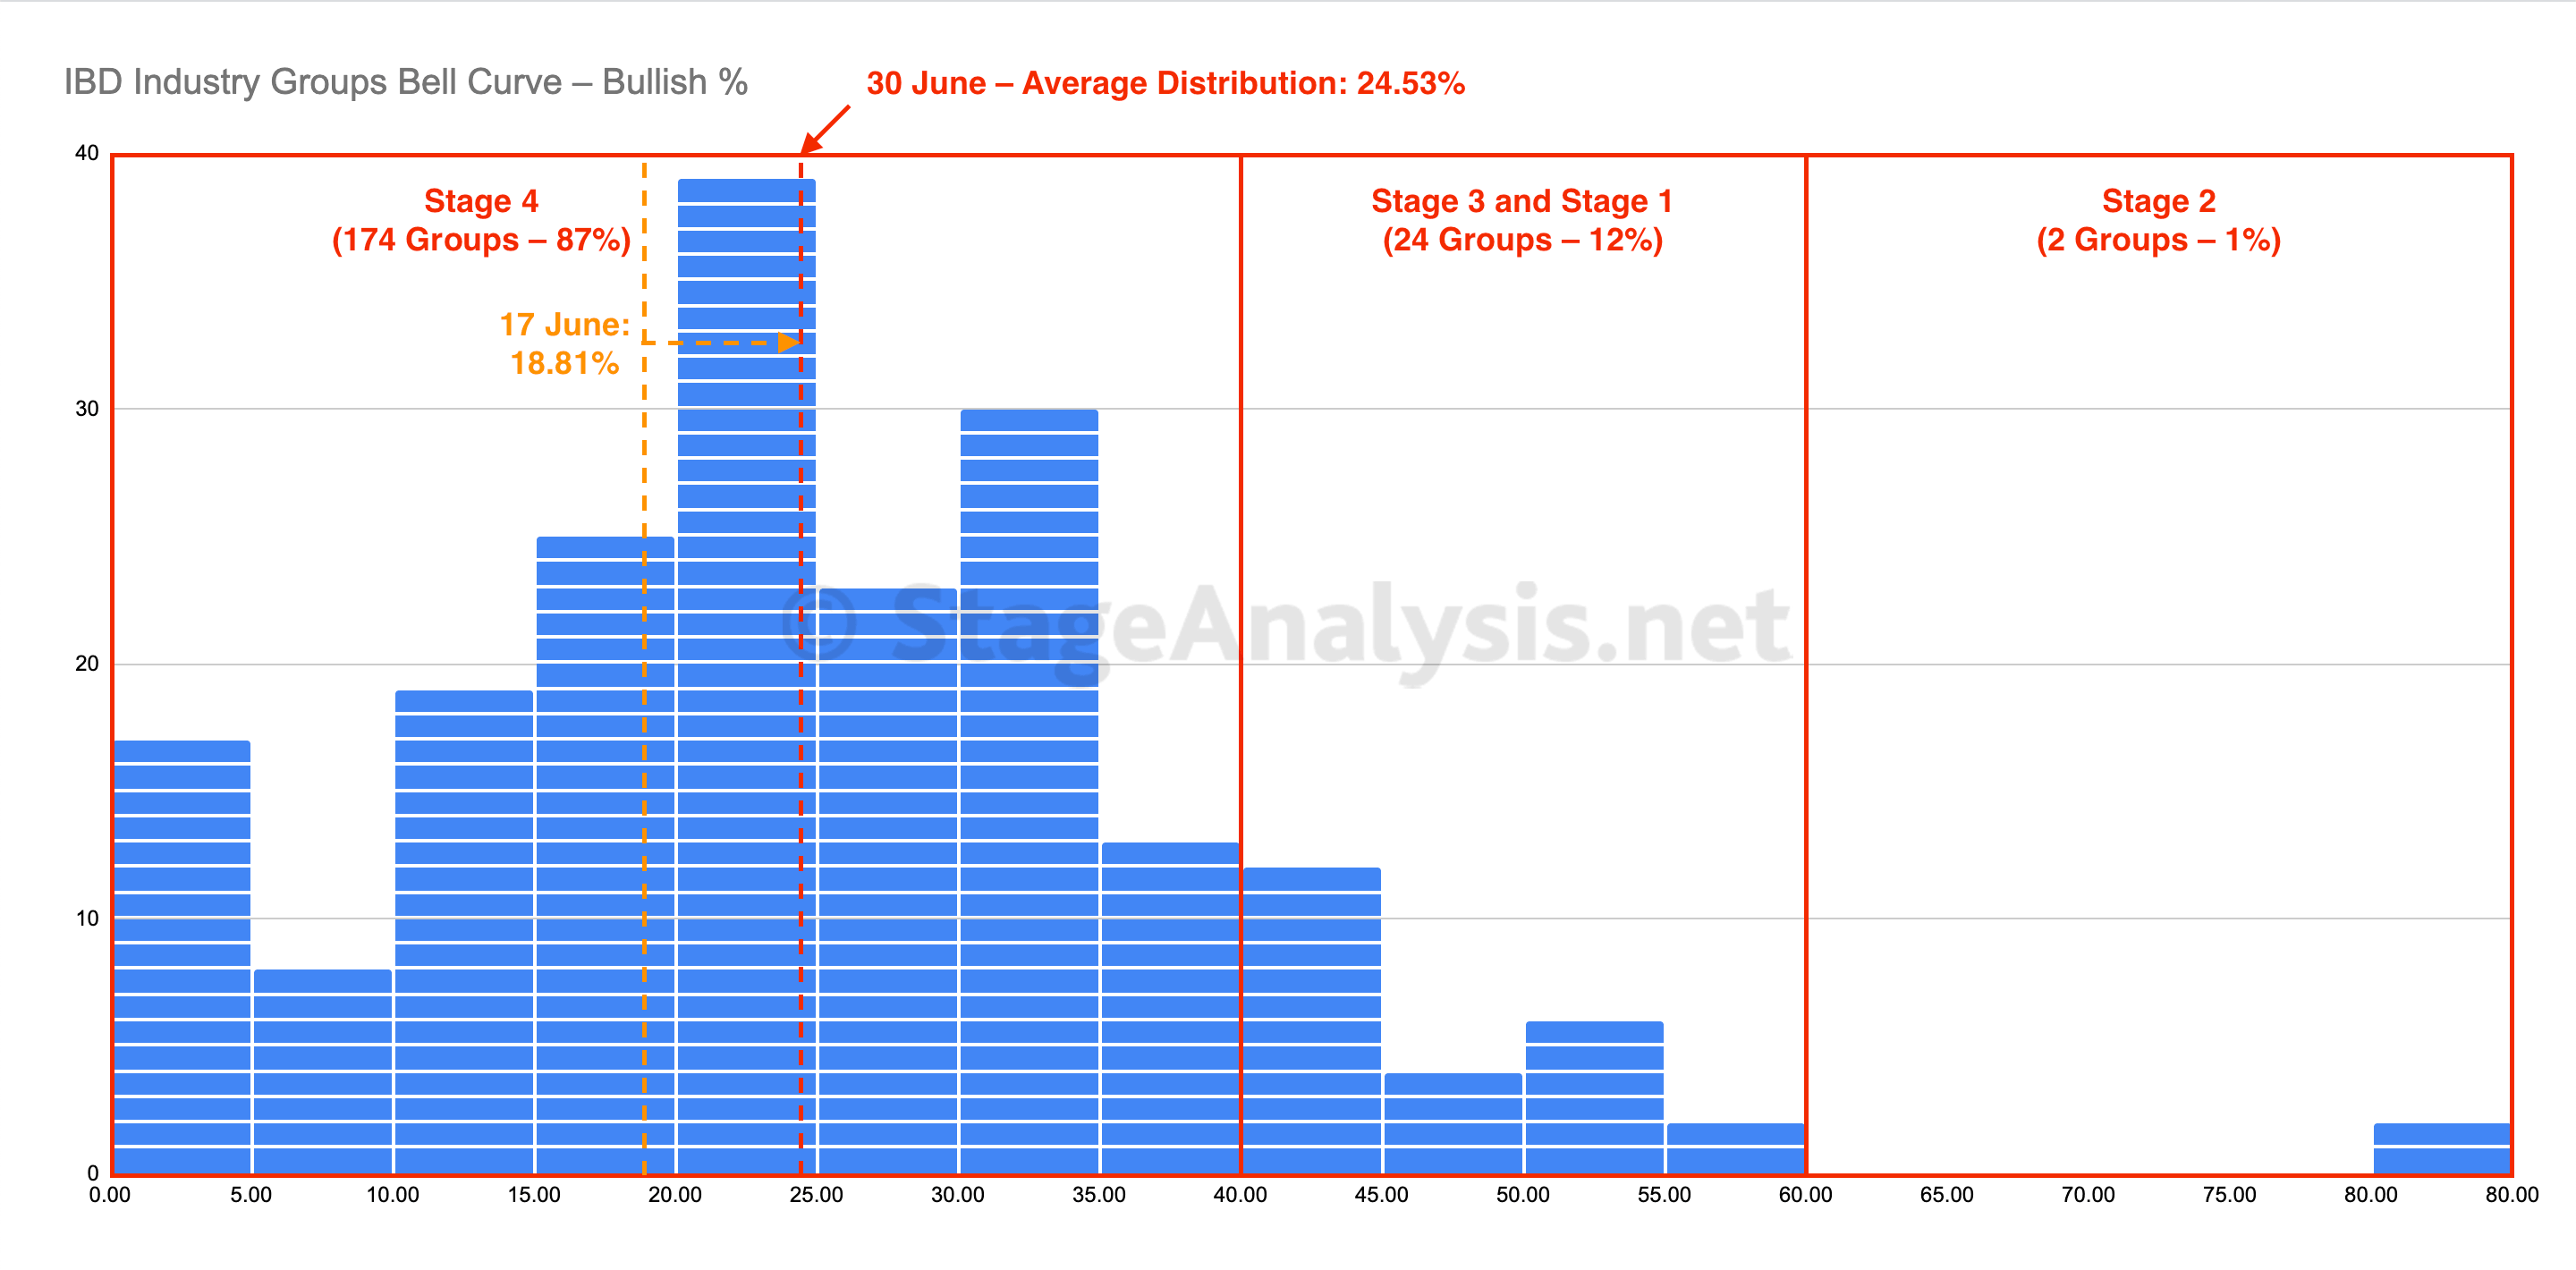
IBD Industry Groups Bell Curve – Bullish Percent
The IBD Industry Groups Bell Curve – Bullish Percent has improved slightly over the last few weeks with a gain of +5.72%, which moves the average distribution of the 200 Investors Business Daily (IBD) Industry Groups to 24.53%...
Read More
29 June, 2022
Stock Market Update and US Stocks Watchlist – 29 June 2022
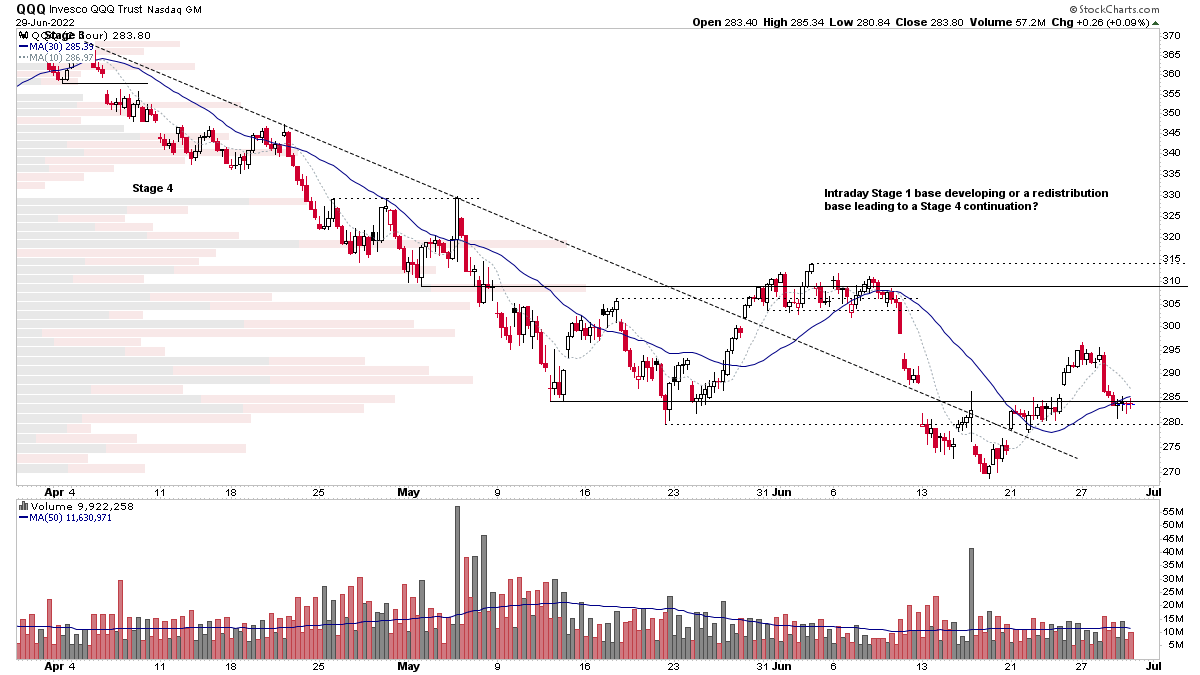
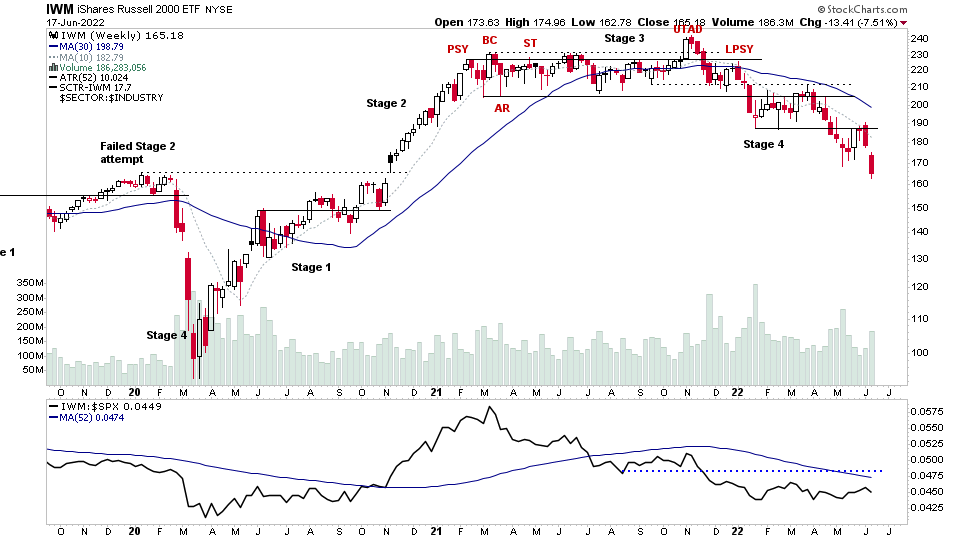
While there is no denying that the US stock market is currently in a major Stage 4 decline, with every major US stock index in Stage 4 on the weekly timeframe that the primary Stages are determined on. The more recent price action over the last month is much more subjective, as it differs across the indexes...
Read More
26 June, 2022
Stock Market Update and US Stocks Watchlist – 26 June 2022
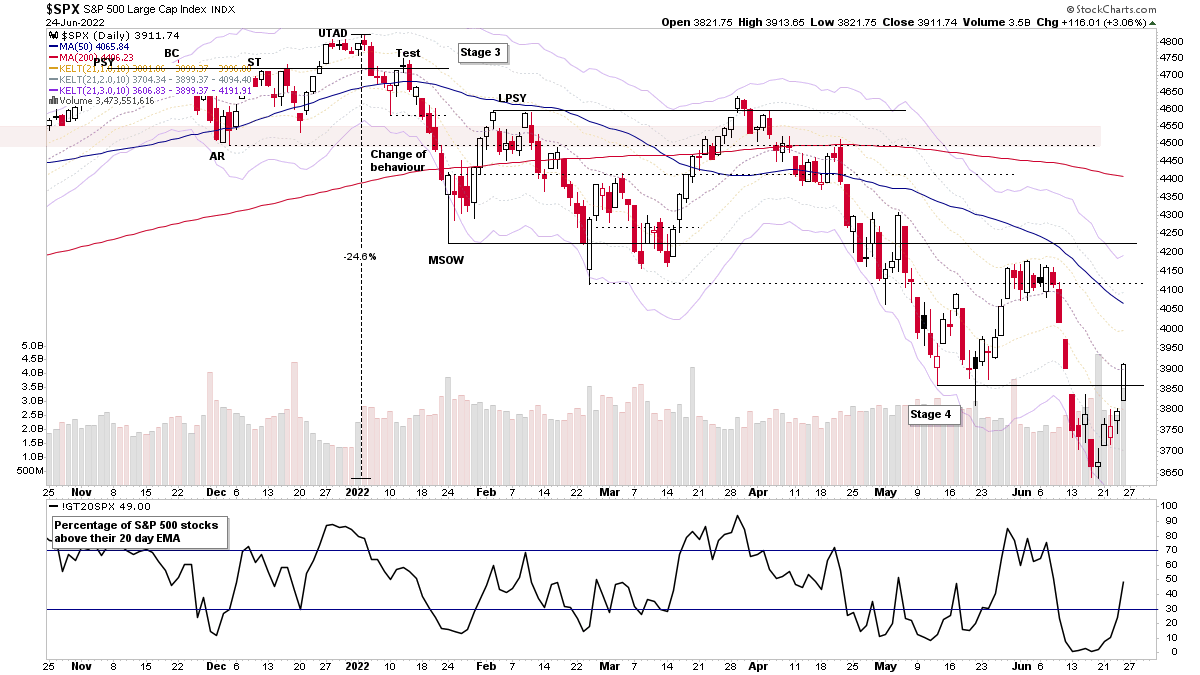
The stock market saw strong moves on Friday with the 5th attempt at a Follow Through Day (FTD) forming of this Stage 4 decline, which coincided with other short-term signals...
Read More
25 June, 2022
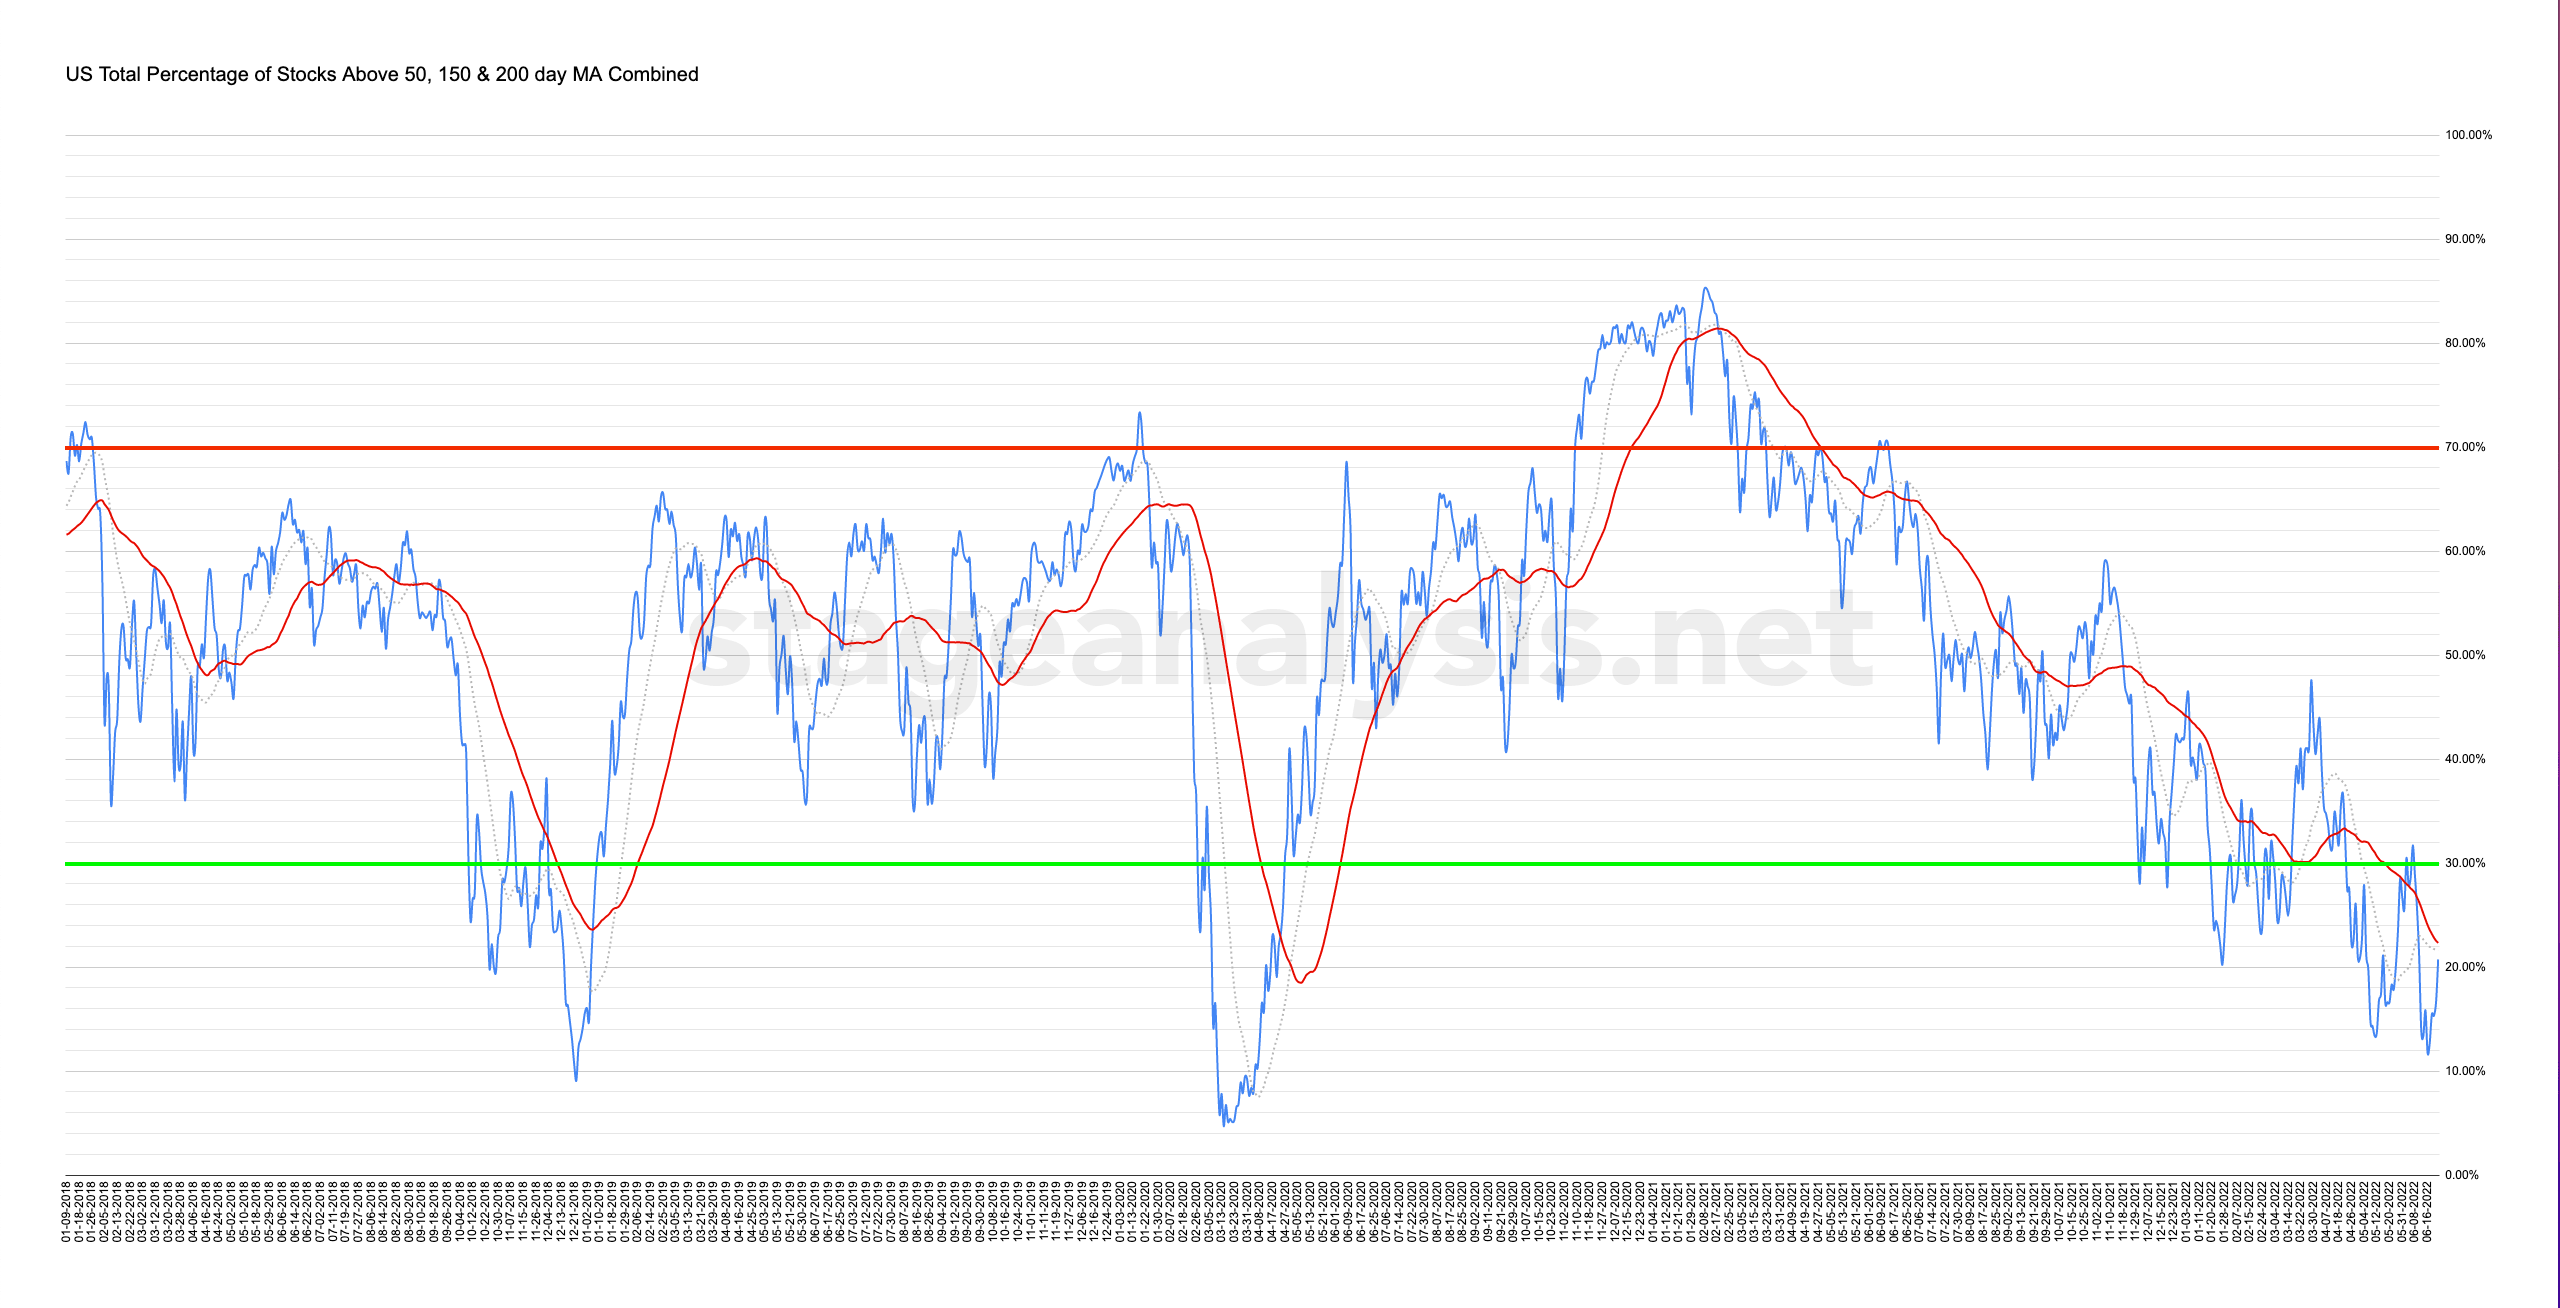
Market Breadth: Percentage of Stocks Above their 50 Day, 150 Day & 200 Day Moving Averages Combined
Custom Percentage of Stocks Above Their 50 Day, 150 Day & 200 Day Moving Averages Combined Market Breadth Charts for the Overall US Market, NYSE and Nasdaq for Market Timing and Strategy.
Read More
24 June, 2022
US Stocks Industry Groups Relative Strength Rankings
The purpose of the Relative Strength (RS) tables is to track the short, medium and long term RS changes of the individual groups to find the new leadership earlier than the crowd...
Read More
22 June, 2022
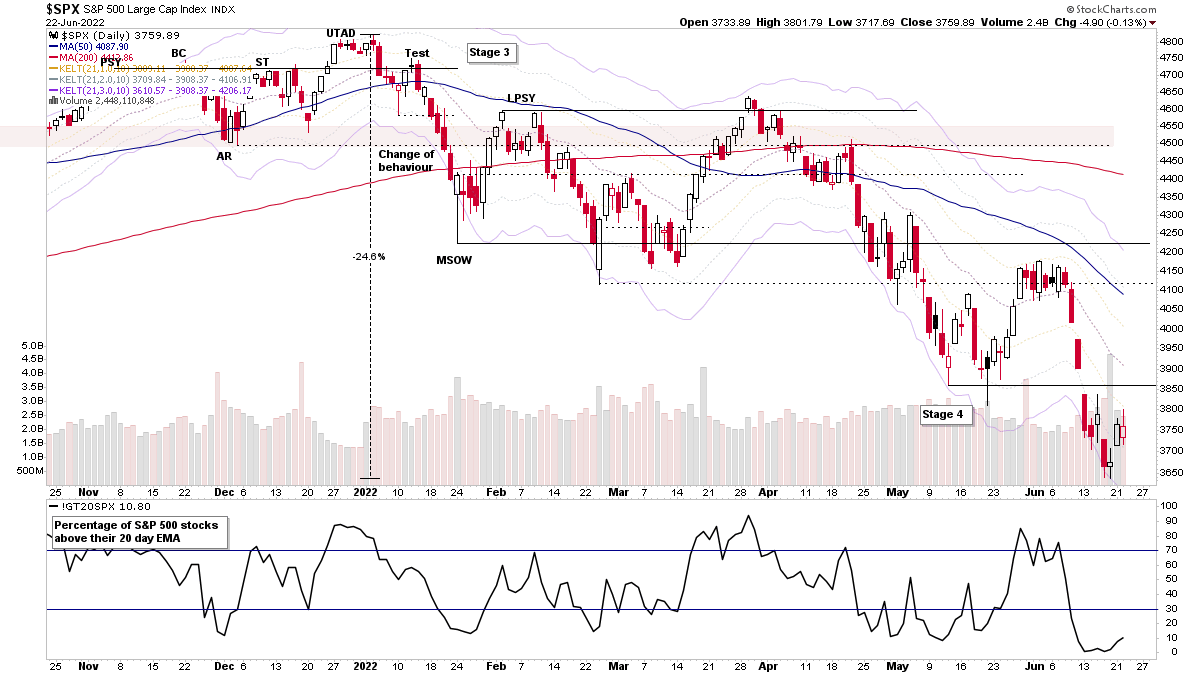
Stock Market Update and US Stocks Watchlist – 22 June 2022
The S&P 500 and the majority of other stock market indexes remain in weekly Stage 4 declines, but the stopping action at the end of last week has led to a three-day move higher...
Read More
19 June, 2022
Stage Analysis Members Weekend Video – 19 June 2022 (1hr 24mins)
The Stage Analysis Members Weekend Video this week covers the Major Indexes with analysis of S&P 500, Nasdaq, Russell 2000 and more. Plus a look at futures charts of Oil, Copper, Treasuries & Gold...
Read More
19 June, 2022
US Stocks Watchlist – 19 June 2022
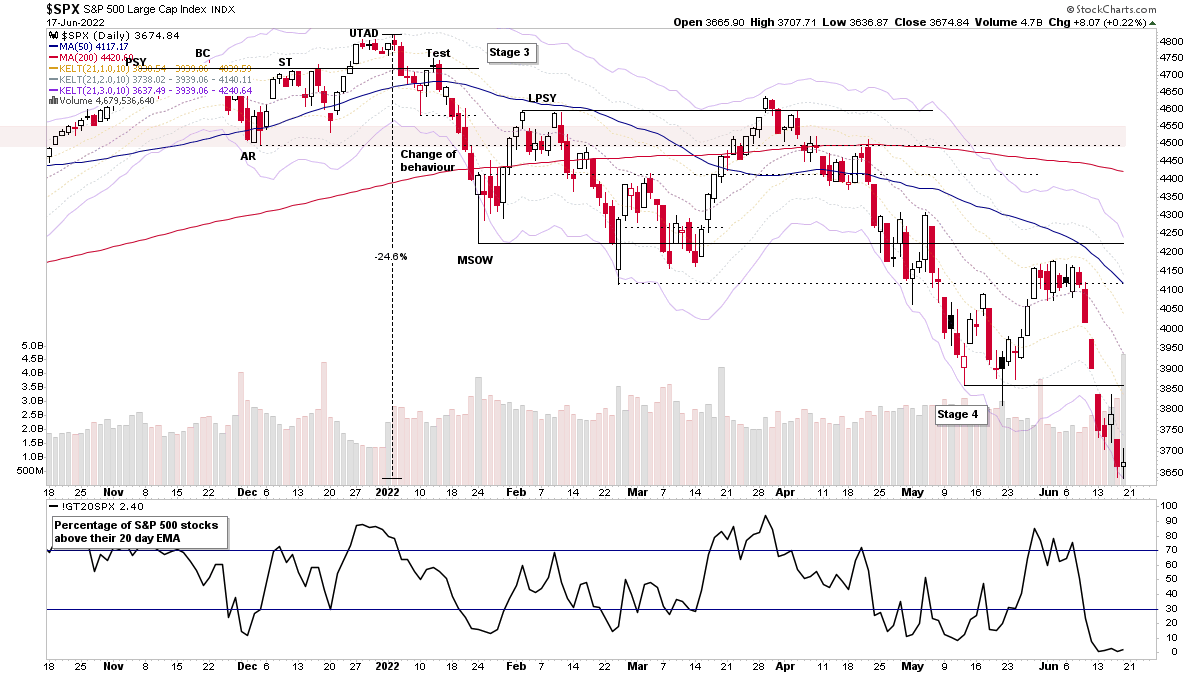
Strong selling continued this week causing a further leg lower in the stock market Stage 4 decline with the major indexes (i.e. S&P 500, Nasdaq Composite and Russell 2000 etc) all closing below their recent base structures and are now at percentage levels off the highs that rival major bear markets of the past.
Read More
18 June, 2022
IBD Industry Groups Bell Curve – Bullish Percent
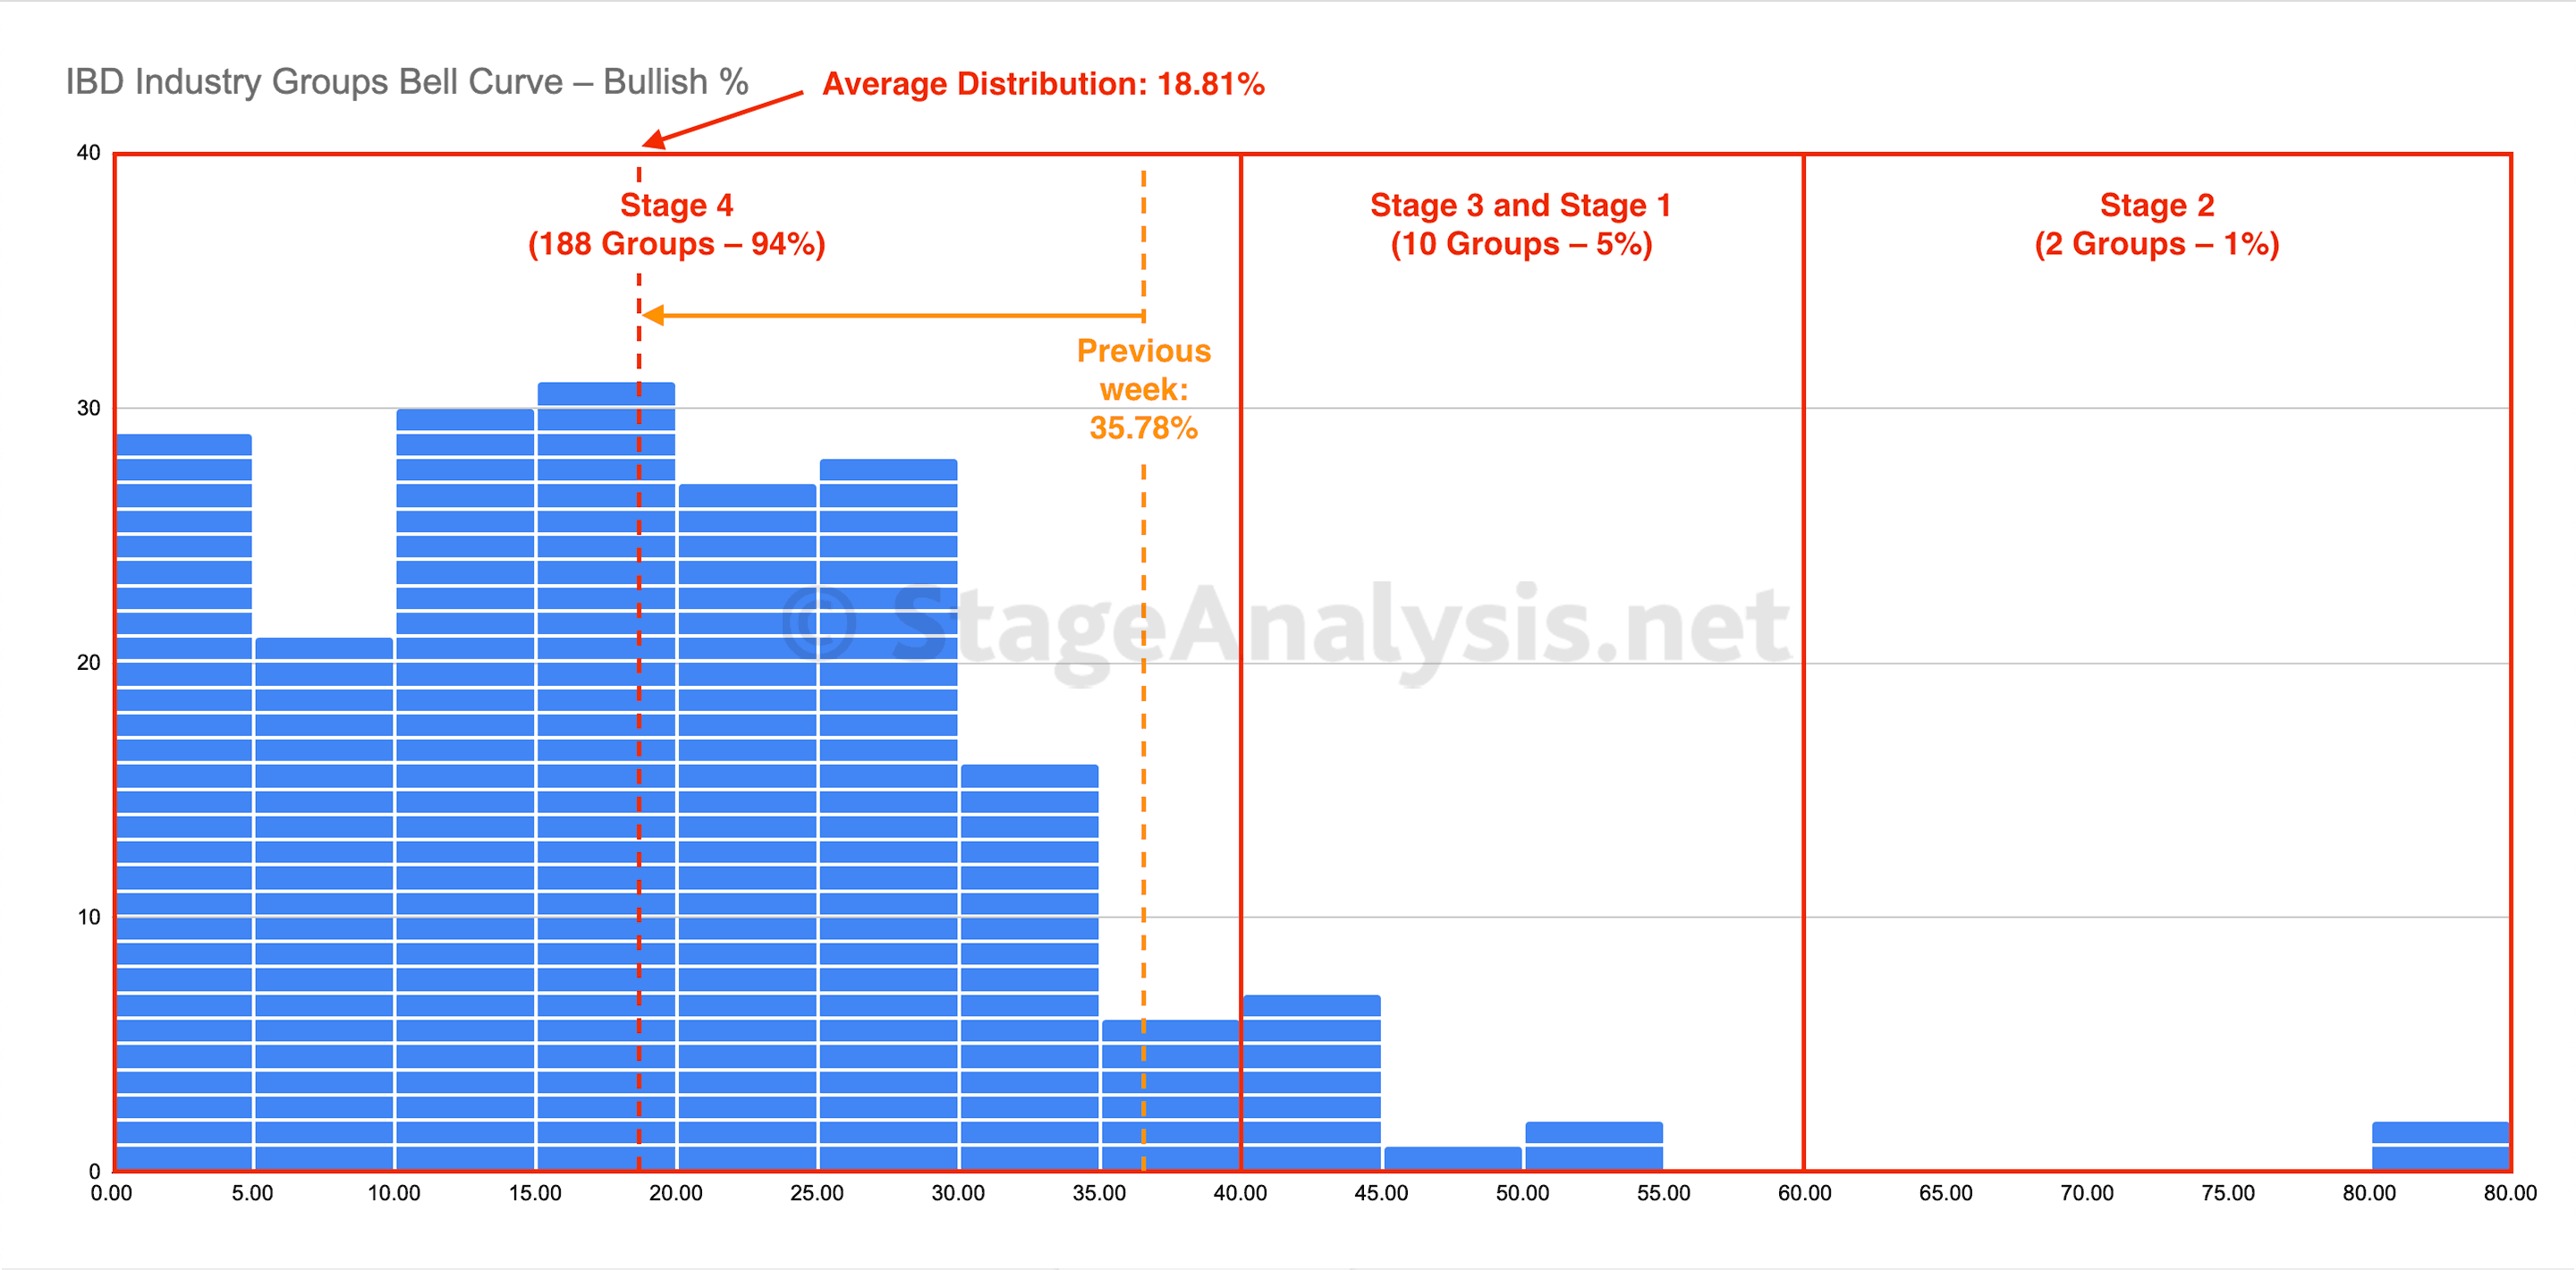
The IBD Industry Groups Bell Curve – Bullish Percent had a strong negative shift of -16.97% this week and pushed to extreme levels in the Stage 4 zone with an average distribution in the 200 Investors Business Daily (IBD) Industry Groups of 18.81%.
Read More

