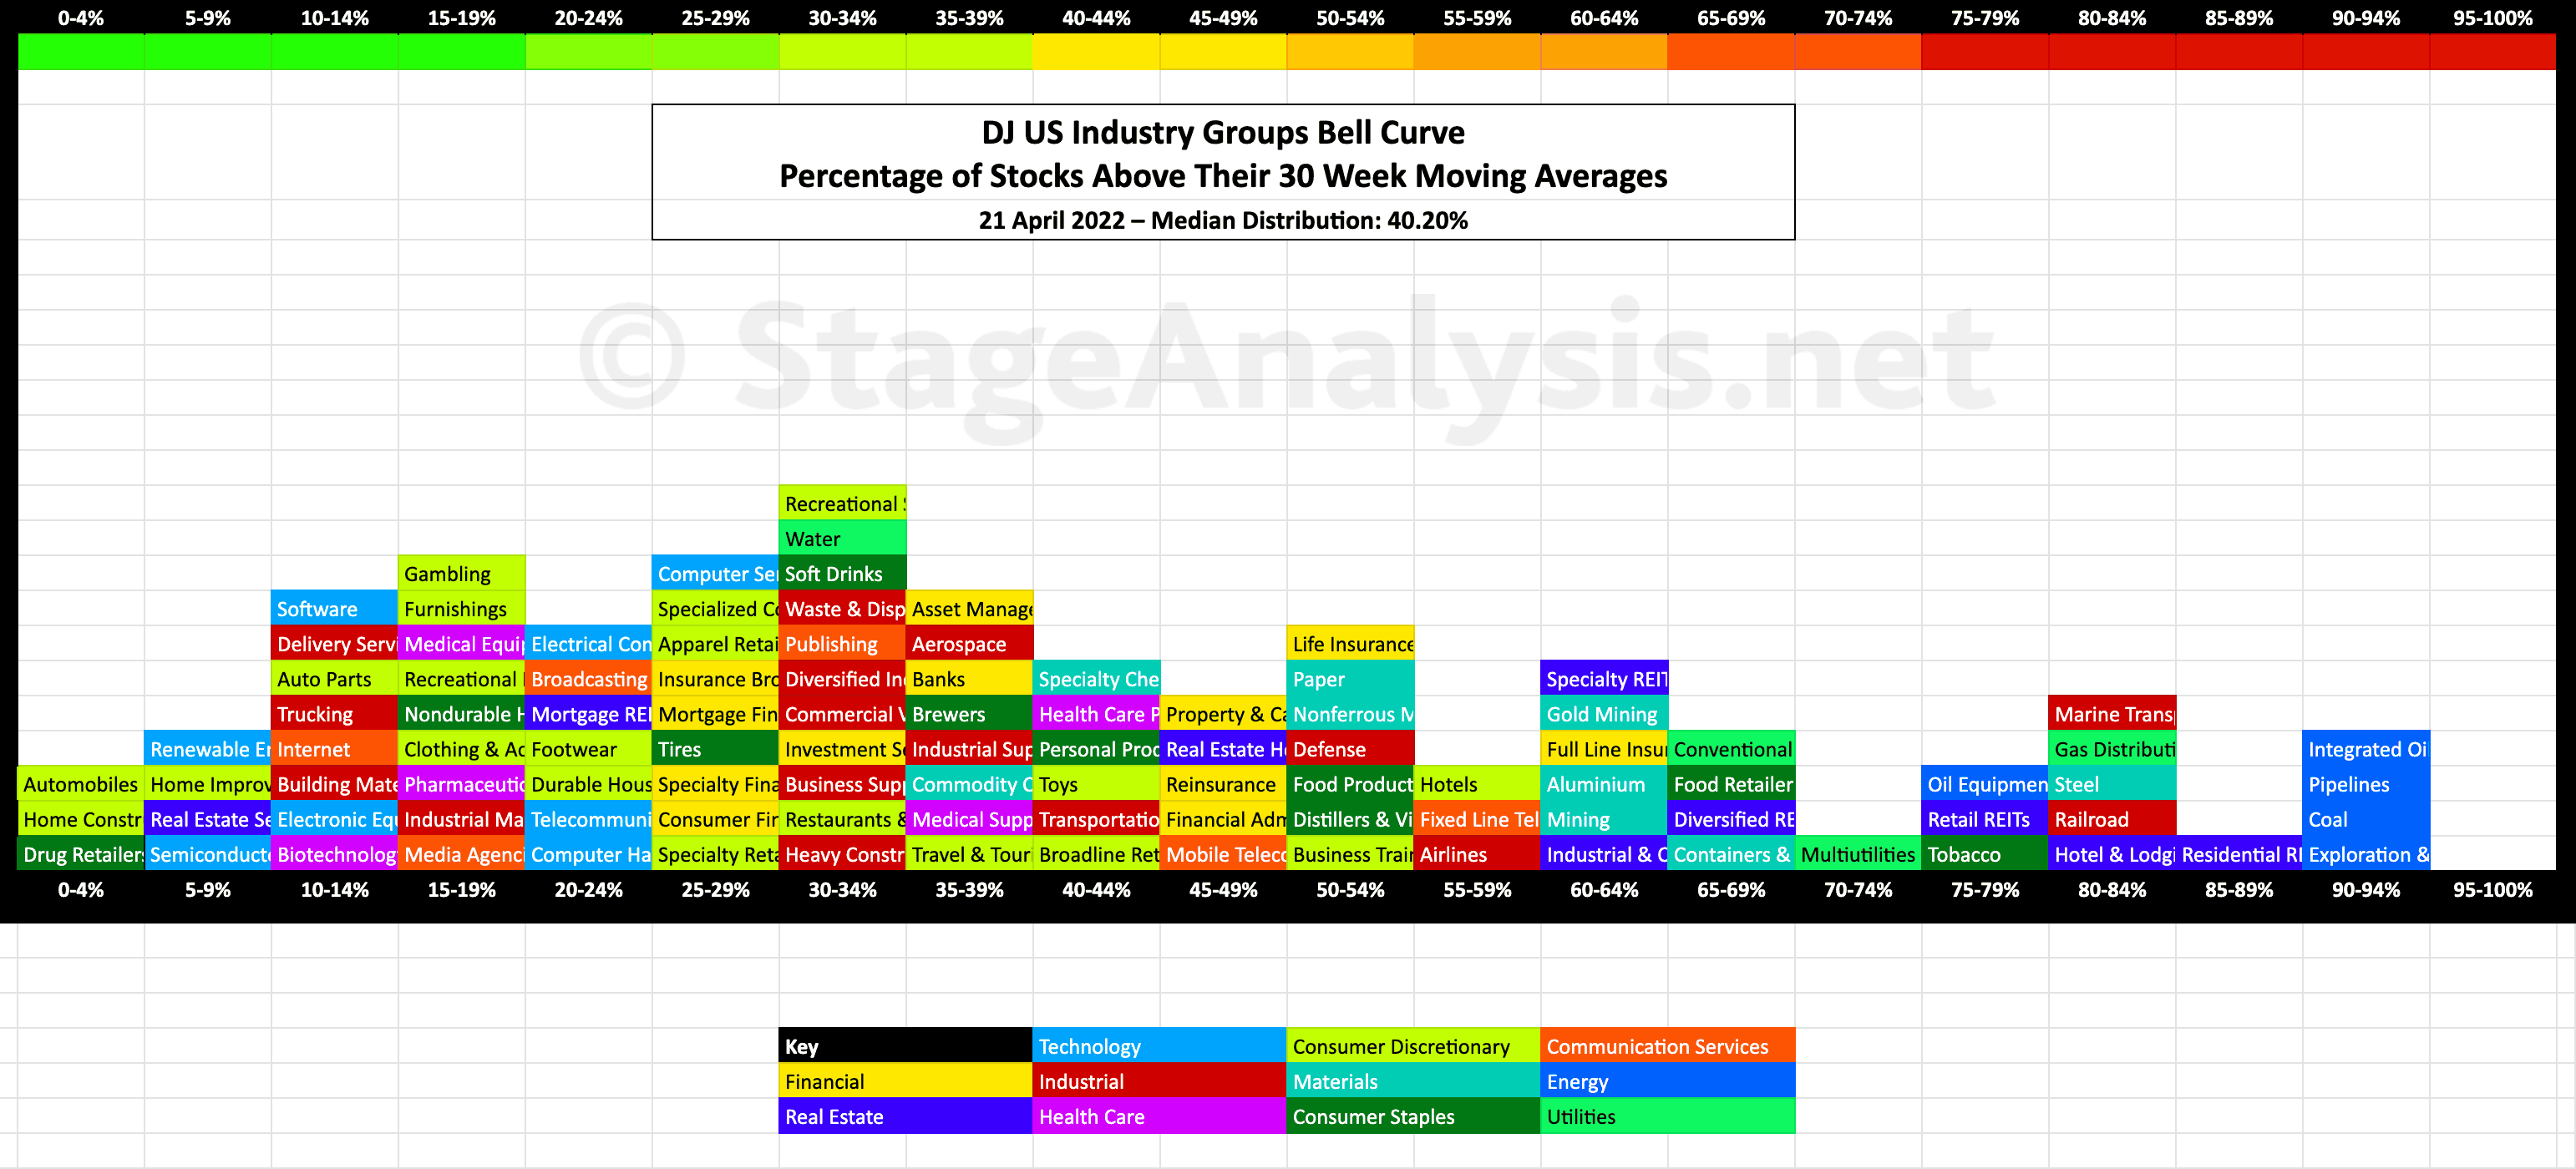
Exclusive graphic of the 104 Dow Jones Industry Groups showing the Percentage of Stocks Above 30 week MA in each group visualised as a Bell Curve chart – inspired by the Sector Bell Curve work by Tom Dorsey in his Point & Figure book....
Read More

Blog
“If I could impress on you one fact, it would be that at least 75 percent of the risk in any stock is associated with the market and sector. If the overall market is not supporting higher prices, very few stocks you own, if any, will do well.”
Thomas J. Dorsey – Point and Figure Charting
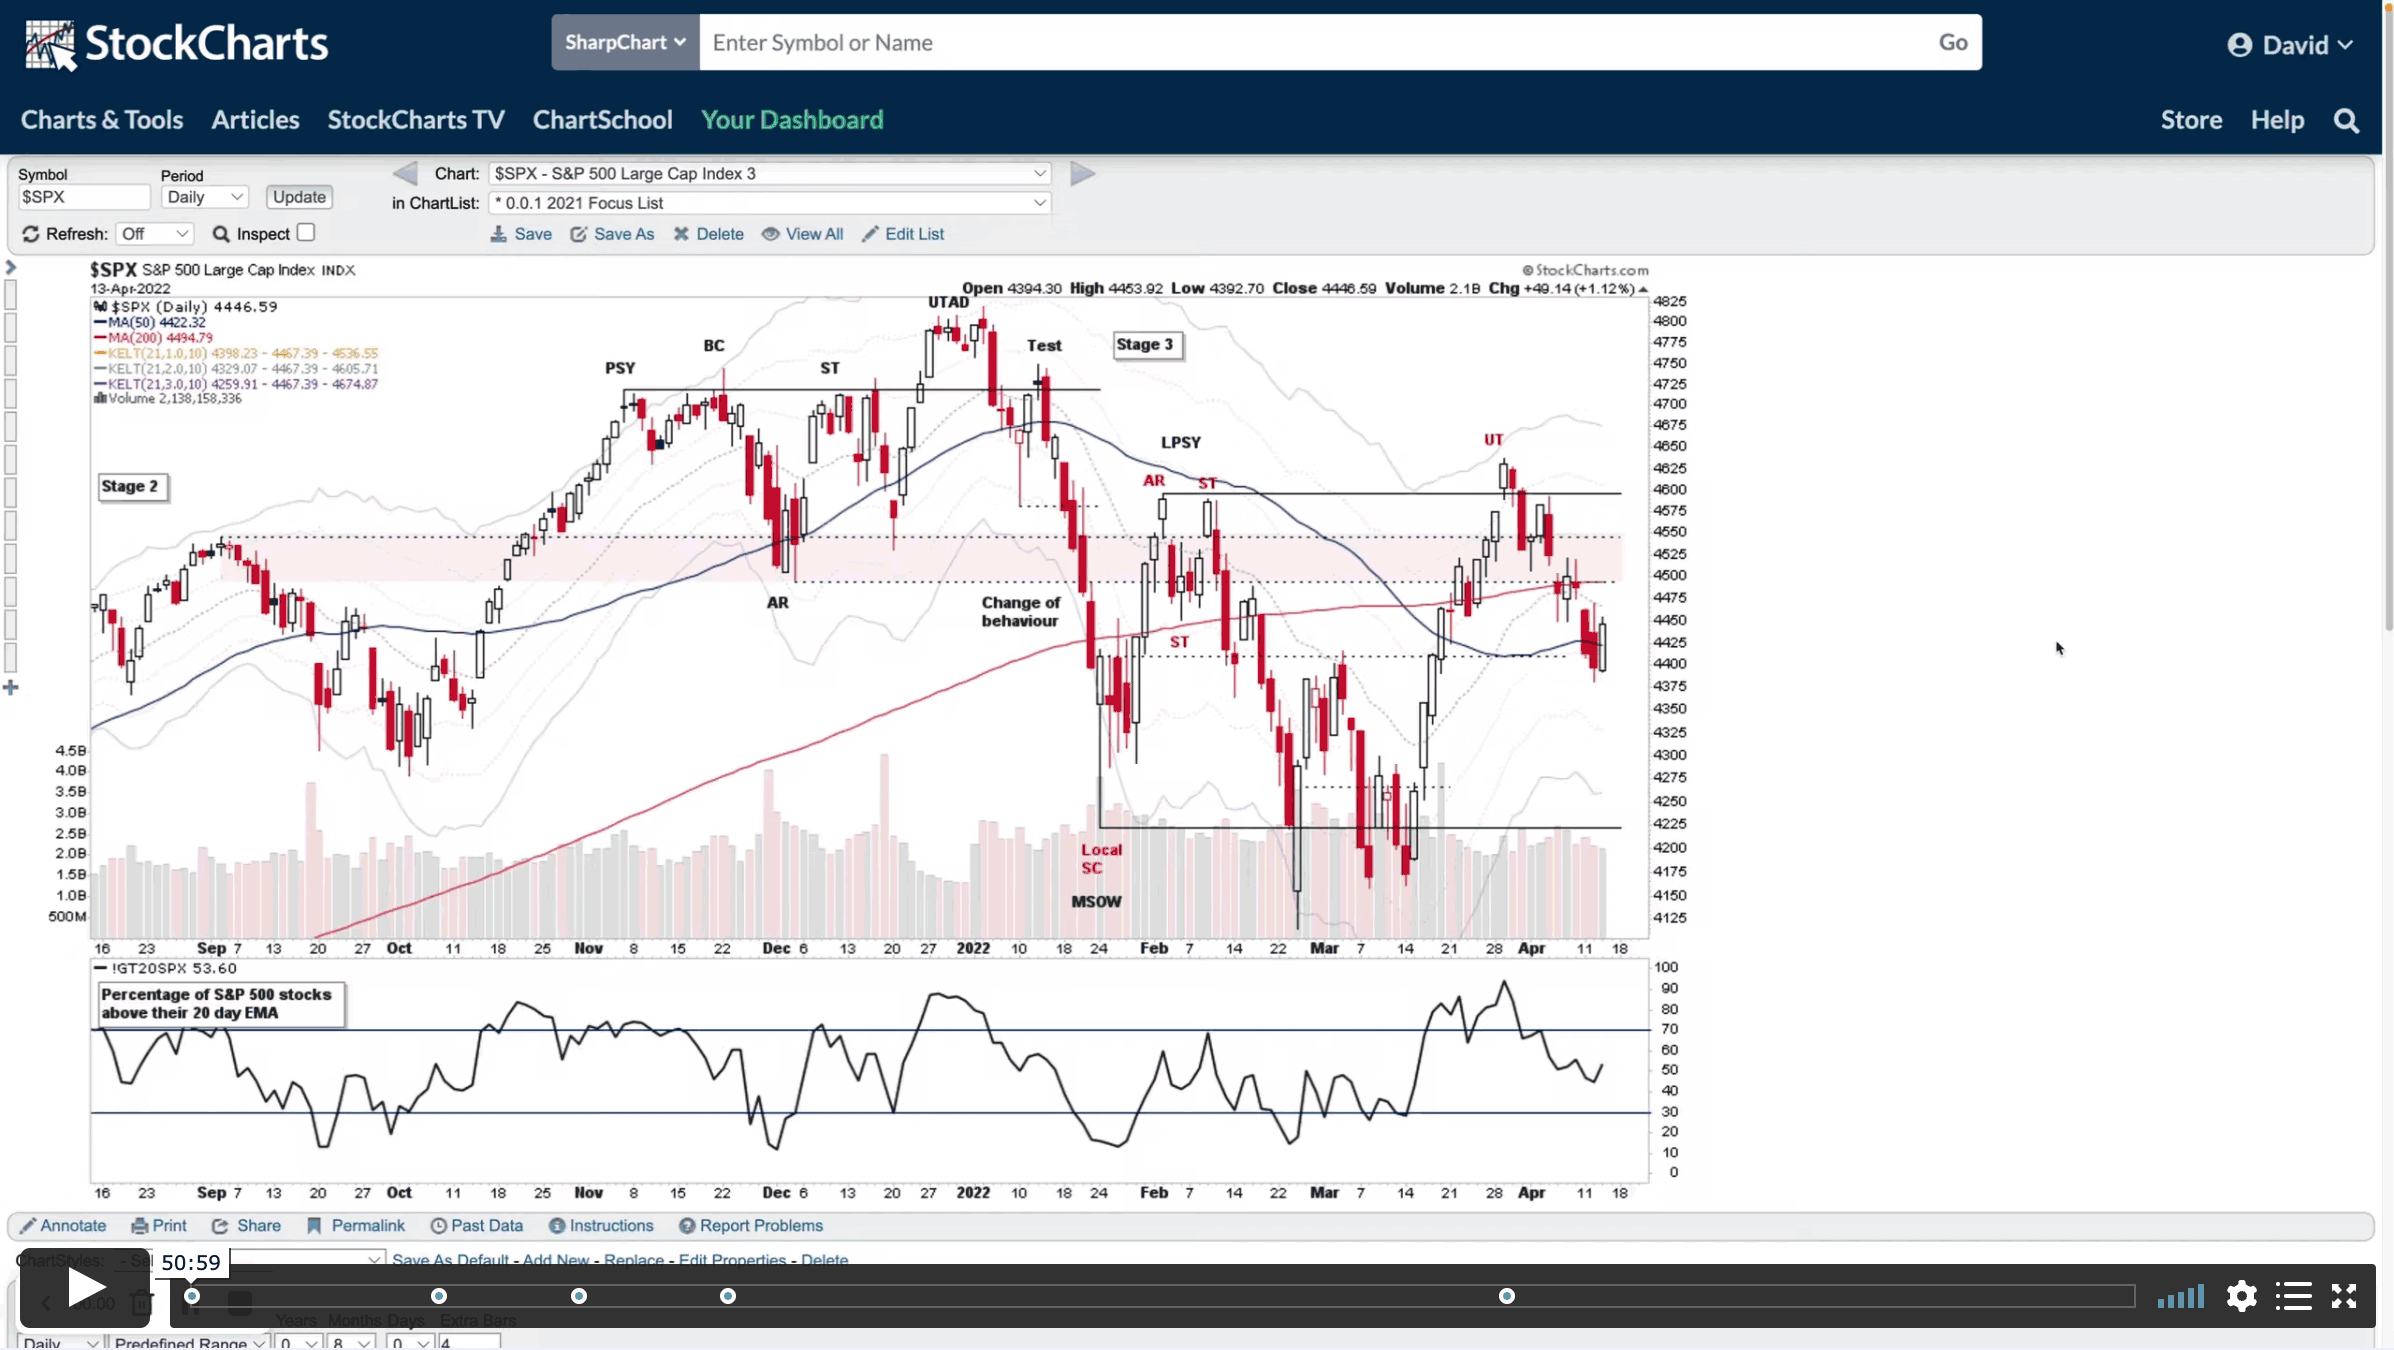
Being able to identify the four Stages visually on individual stock charts is a crucial skill when using the Stage Analysis method. However, the major stock market index charts, such as the S&P 500, the Dow Jones Industrial Average, and the Nasdaq 100, are all just averages of the stocks within them, and are also distorted by the weighting of stocks.
For example, currently the top 10 stocks in the Nasdaq 100, make up 54% of the weighting. So over half of the Nasdaq 100s price action is determined by just 10% of the stocks. Therefore, you could have a scenario where 90% of stocks in the index are in Stage 4 declines, but the index chart could still look reasonably healthy in Stage 2, as the top 10 stocks are still in Stage 2 advances and holding the index up.
This is where market breadth indicators come into play. As they give you an unbiased look at what’s really going on under the surface of the stock market, and so can help you to determine the actual Stage that the market index is in.
There are many different data sources that you can use to get market breadth information, and each have their own strengths and weaknesses. But in the Stage Analysis method, no market breadth information is used in isolation. Instead, we use what is known as the Weight of Evidence approach, where all of the different market breadth information is combined to determine the overall strategy that should be used, and so can help you to determine whether you should be using a more cautious strategy or a more aggressive one.
Stan Weinstein was famous for using over 50 different indicators to determine the Weight of Evidence. But retail investors shouldn’t be put off, as you can achieve a similar effect by using a much smaller, core set of market breadth indicators, to create your own Weight of Evidence.
21 April, 2022
US Industry Groups Bell Curve – Exclusive to Stage Analysis
21 April, 2022
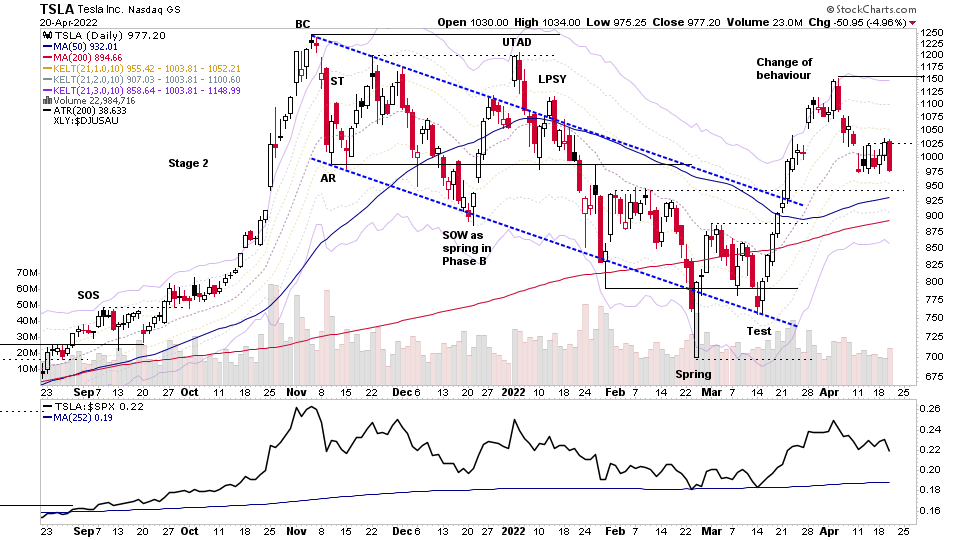
Stage Analysis Members Midweek Video - 20 April 2022 (56 mins)
Stage Analysis Members Midweek Video with a FREE preview covering the Stage 4 continuation breakdown in NFLX Netflix, and then members only content going through the Major Indexes, Short Term Market Breadth Charts, todays after hours moves from earnings in TSLA and UAL. The Uranium group attempt to rebound and the US Stocks Watchlist and Group Themes in more detail.
Read More
19 April, 2022
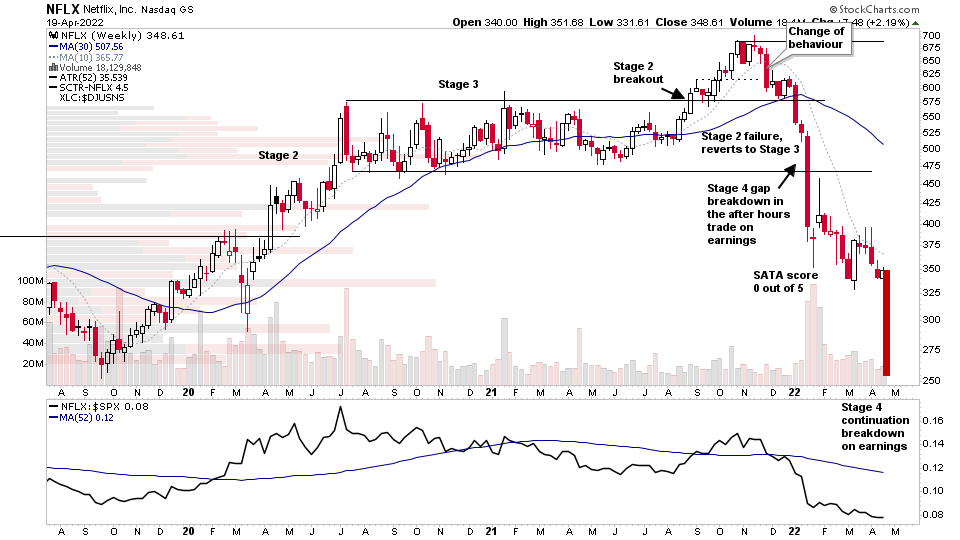
Netflix Stage 4 Continuation Breakdown on Earnings and the US Stocks Watchlist – 19 April 2022
NFLX (Netflix) reacted poorly to it earnings again and made its second large gap down of the year so far. The first of which was on the announcement of the previous earnings. And so it made a Stage 4 continuation breakdown with a massive gap of over -25% in the after hours trade and has now retraced the entire previous Stage 2 advance...
Read More
17 April, 2022
Stage Analysis Members Weekend Video – 17 April 2022 (1hr 14mins)
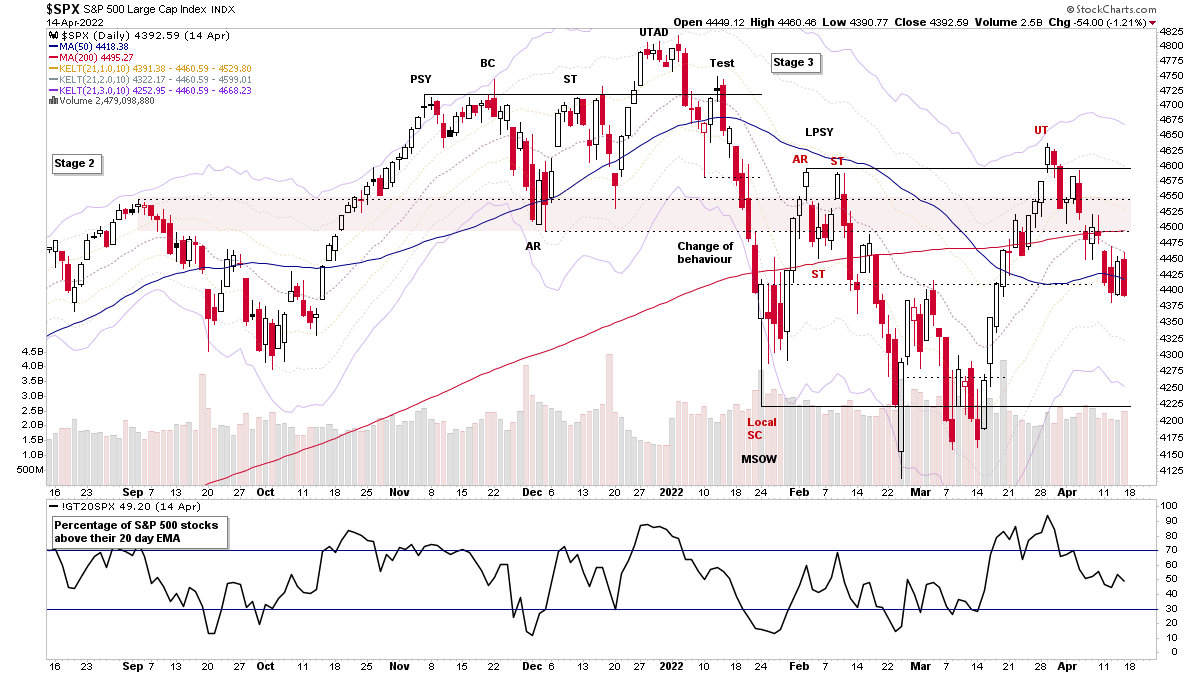
This weekends Stage Analysis Members Video features analysis of the Major US Stock Market Indexes – S&P 500, Nasdaq Composite, Russell 2000 etc, plus a detailed run through of the key Market Breadth charts (with exclusive charts only on Stage Analysis) in order to determine the Weight of Evidence...
Read More

15 April, 2022
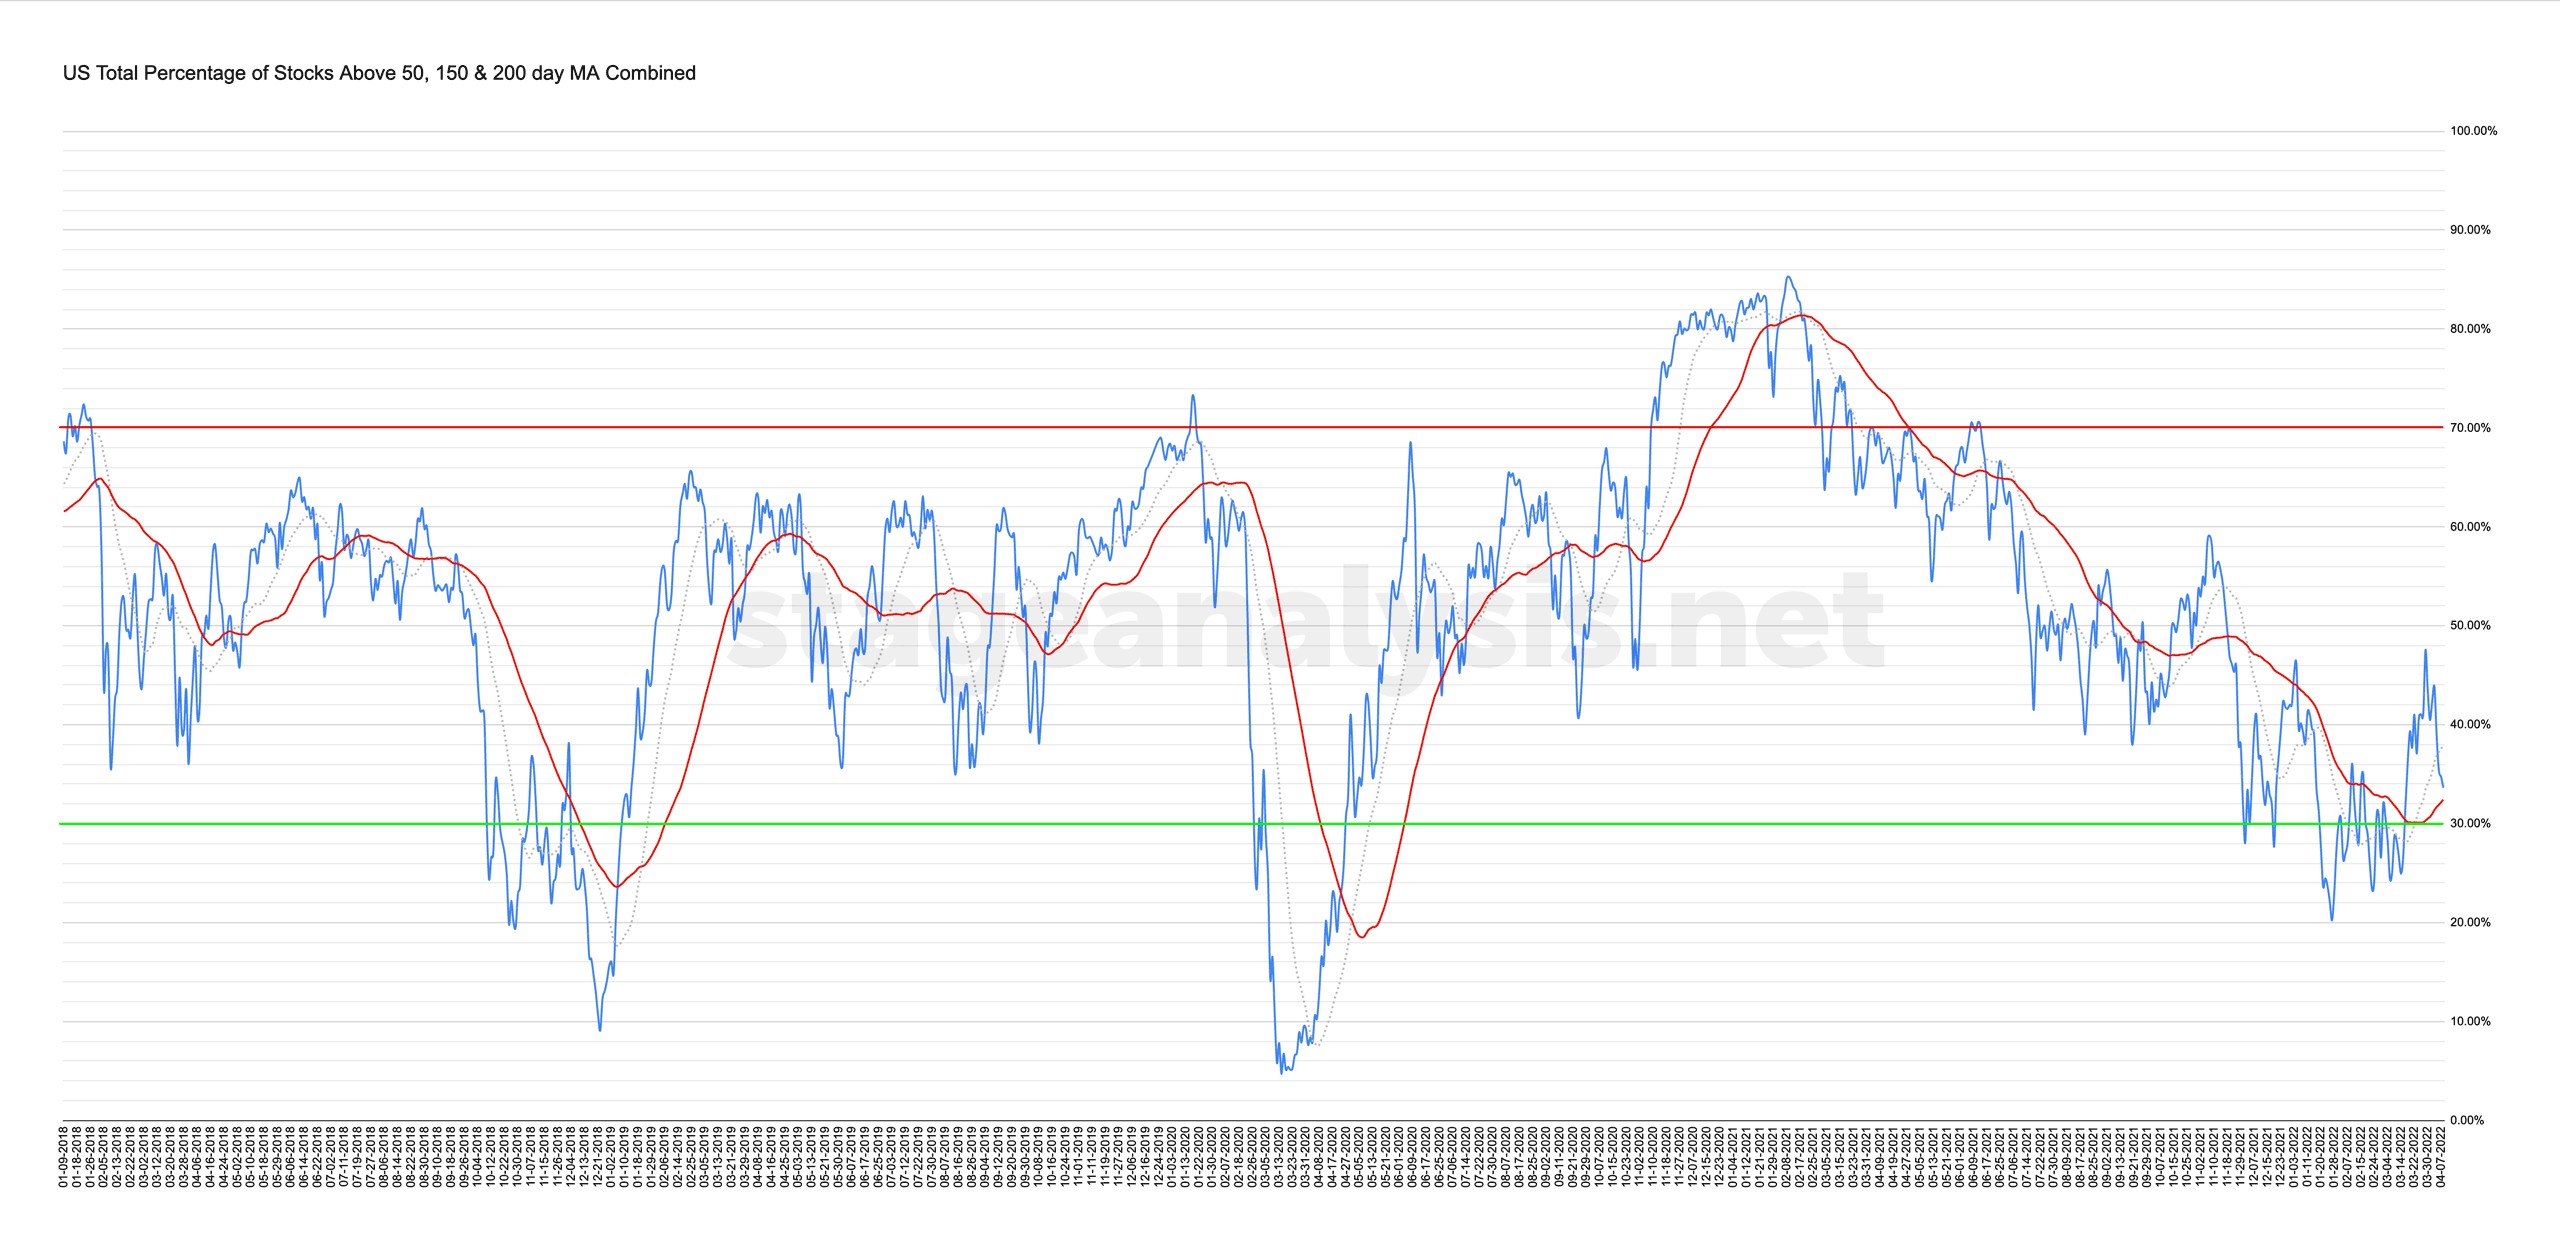
Market Breadth: Percentage of Stocks Above their 50 Day, 150 Day & 200 Day Moving Averages Combined
Custom Percentage of Stocks Above Their 50 Day, 150 Day & 200 Day Moving Averages Combined Market Breadth Charts for the Overall US Market, NYSE and Nasdaq for Market Timing and Strategy.
Read More
14 April, 2022
Stage Analysis Members Midweek Video - 14 April 2022 (50 mins)
The Stage Analysis Members Midweek Video covers the major indexes, short term market breadth charts, AAPL and TSLA attempts to the hold their short term MAs.The group themes from the last week, and the US watchlist stocks in more detail...
Read More
11 April, 2022
Stock Market Weakness Continues – Plus The US Stocks Watchlist – 11 April 2022
The broad market came under more pressure today, but I thought it would be interesting to focus on some of the weekly charts of the mega cap stocks which are currently struggling in various Phases of Stage 3...
Read More
10 April, 2022
Stage Analysis Members Weekend Video – 10 April 2022 (1hr 42mins)
This weekends Stage Analysis Members Video features the Major Indexes – Nasdaq, S&P 500, Russell 2000, Sector Relative Strength, Market Breadth charts to determine the Weight of Evidence, Industry Group Relative Strength. A Group Focus on the Uranium Stocks and the US Stocks Watchlist in detail with marked up charts and explanations of the group themes and what I'm looking for in various stocks.
Read More
09 April, 2022
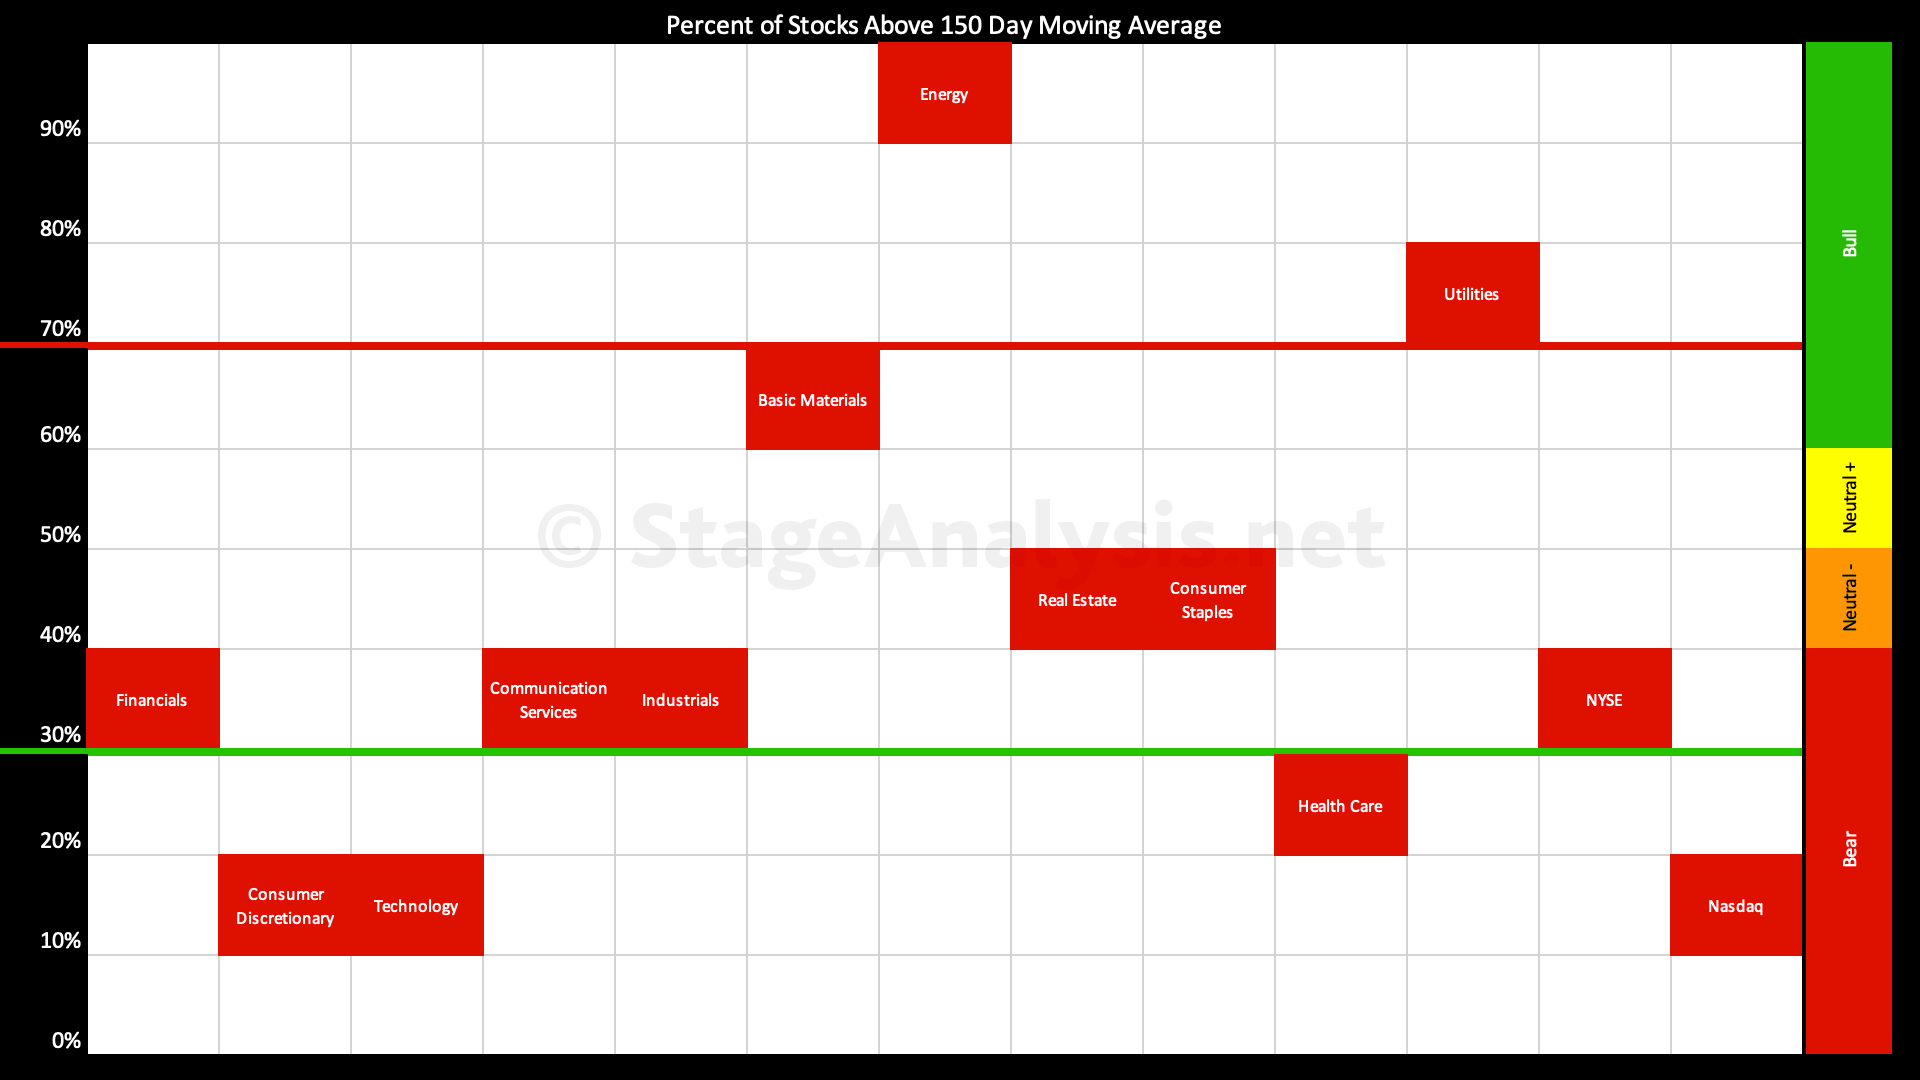
Sector Breadth: Percentage of US Stocks Above Their 150 day (30 Week) Moving Averages
Declines across the entire US stock market this week with the overall average dropping back to 43.93%, which as you can see from the sector data is being propped up by the lingering strength in Energy, Utilities, and Basic Materials. While the rest of the market is lagging, especially the Consumer Discretionary and Technology sectors – which have less than 20% of stocks in each above their medium term 150 day (30 week) moving averages...
Read More
09 April, 2022
Market Breadth: Percentage of Stocks Above their 50 Day, 150 Day & 200 Day Moving Averages Combined
Custom Percentage of Stocks Above Their 50 Day, 150 Day & 200 Day Moving Averages Combined Market Breadth Charts for the Overall US Market, NYSE and Nasdaq for Market Timing and Strategy.
Read More