The Stage Analysis members weekend video begins with discussion of the the US Watchlist Stocks in detail on multiple timeframes, Stages Summary, Relative Strength Rankings, the Sector breadth and Sub-industries Bell Curves, the key Market Breadth Charts to determine the Weight of Evidence, Bitcoin & Ethereum and the Major US Stock Market Indexes Update.
Read More

Blog
09 March, 2025
Stage Analysis Members Video – 9 March 2025 (44mins)
08 March, 2025
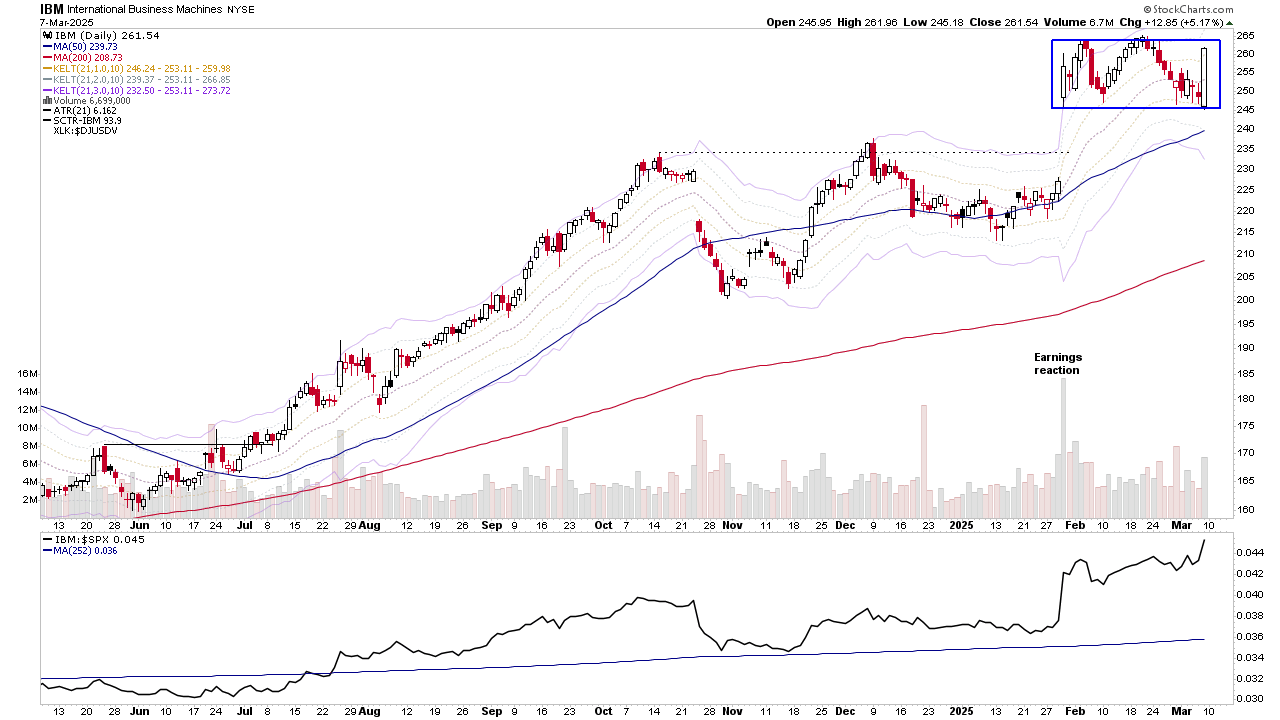
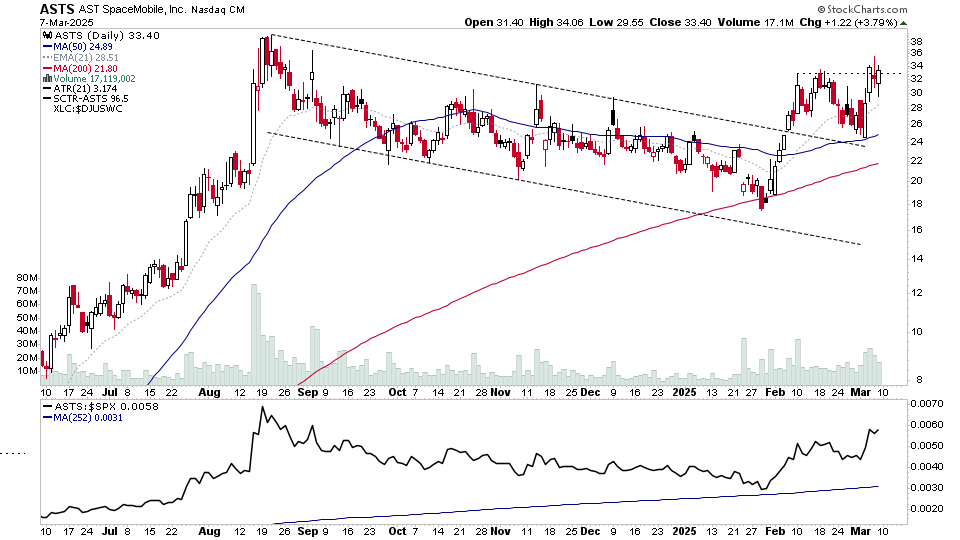
US Stocks Watchlist – 8 March 2024
There were 15 stocks highlighted from the US stocks watchlist scans today...
Read More
08 March, 2025
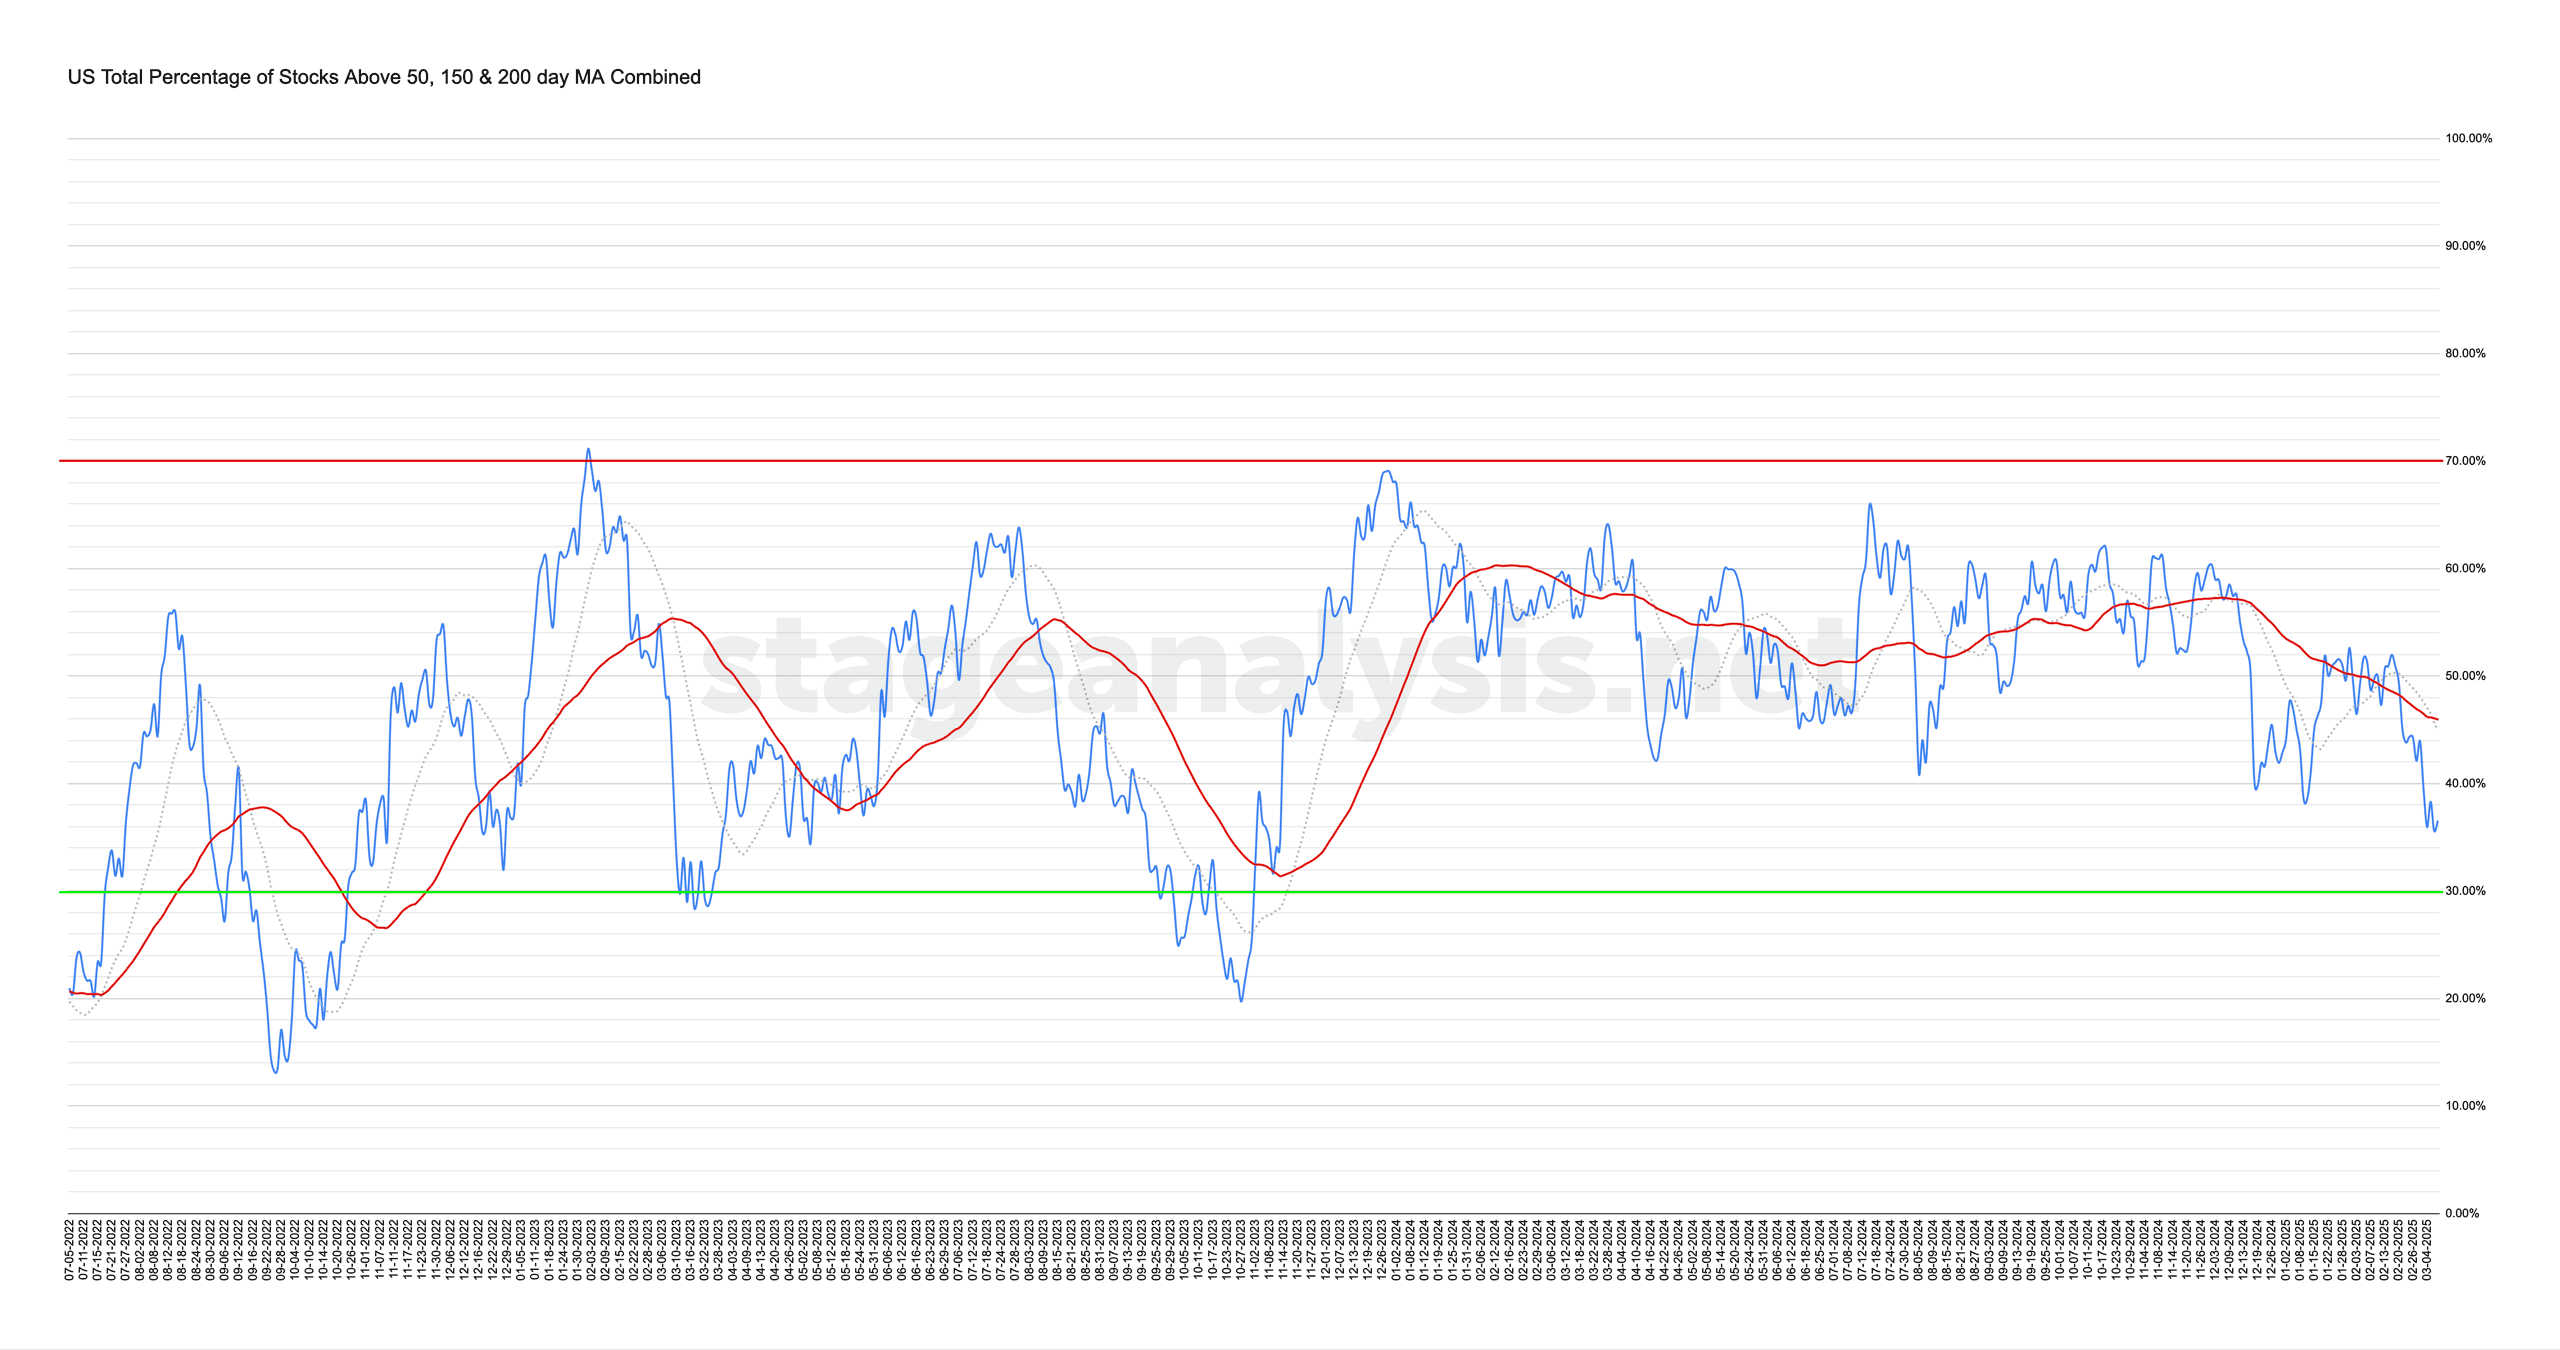
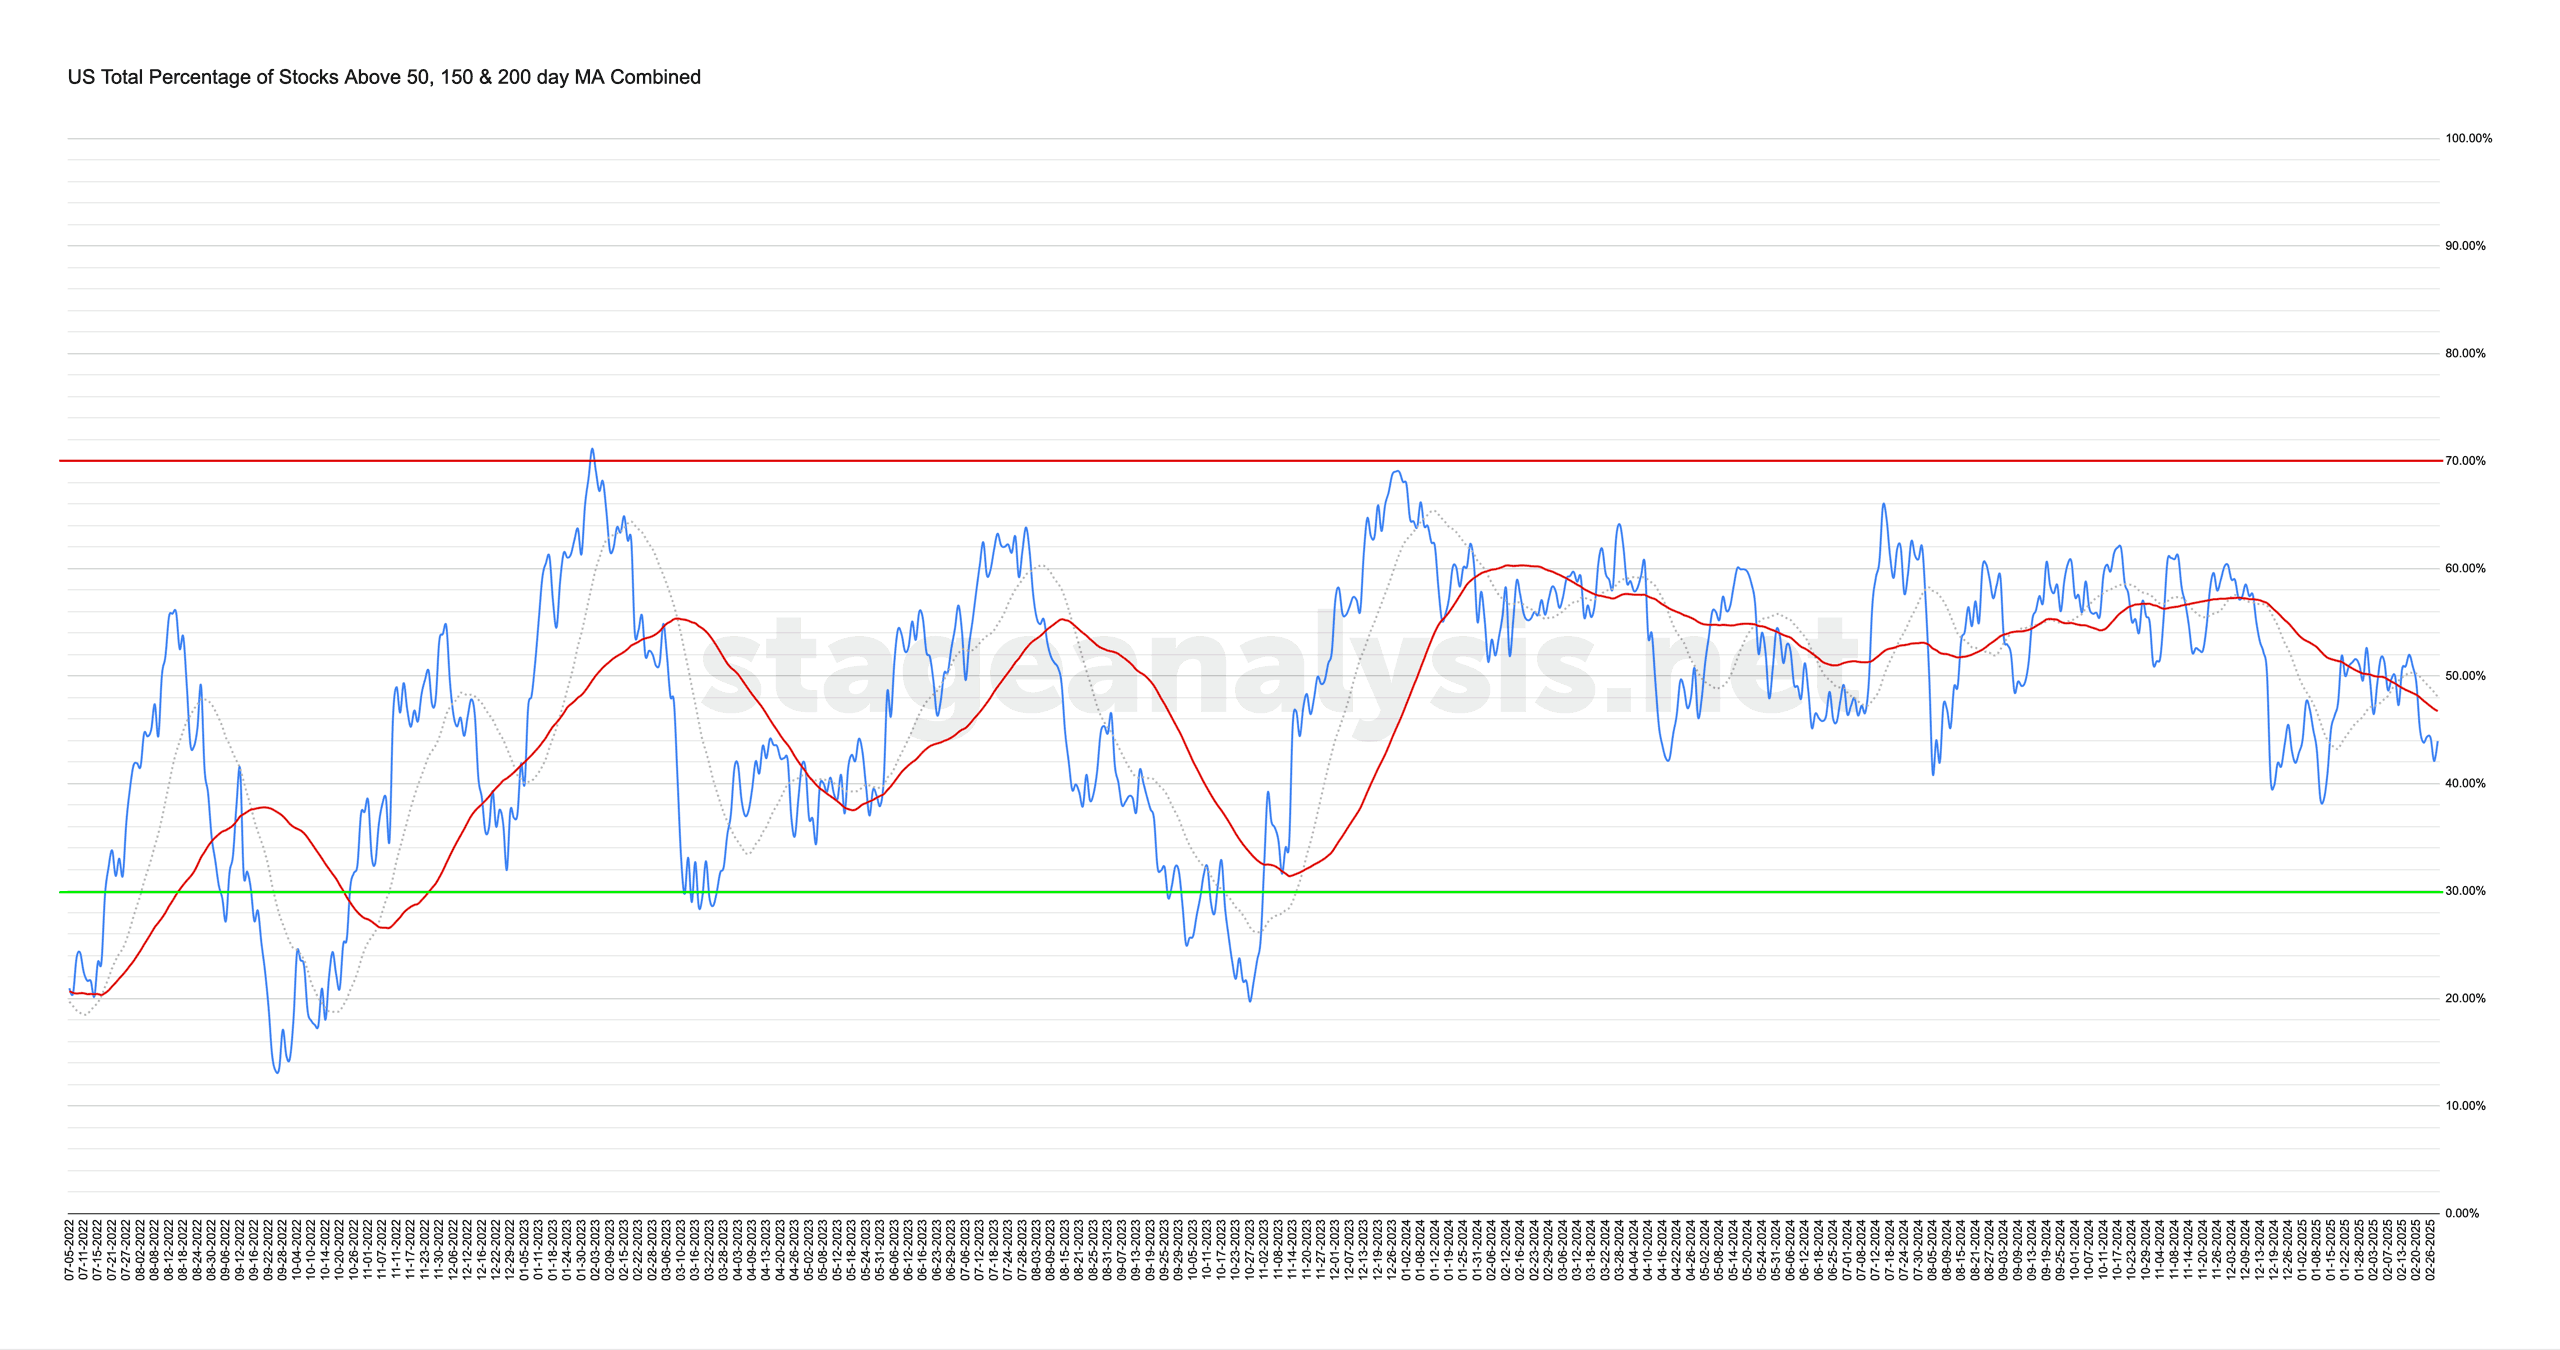
Market Breadth: Percentage of Stocks Above their 50 Day, 150 Day & 200 Day Moving Averages Combined
The US Total Percentage of Stocks above their 50 Day, 150 Day & 200 Day Moving Averages (shown above) decreased by -7.40% this week. Therefore, the overall combined average is at 36.54% in the US market (NYSE and Nasdaq markets combined) above their short, medium and long term moving averages.
Read More
07 March, 2025
Video: New Features: Stages Column on Chartlists & ETF Summary – 7 March 2025 (5mins)
The Stages column in the tables has been added to the Chartlists and ETF Summary pages, as well as a new button on the Chartlists pages to quickly jump to the Stage Analysis Screener so that you can view the full data available for each stock in one click.
Read More
05 March, 2025
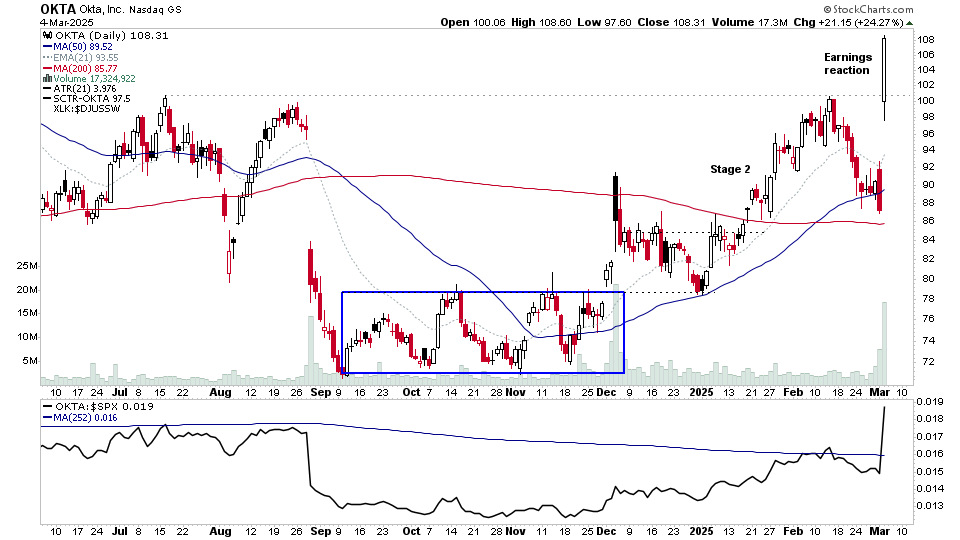
US Stocks Watchlist – 4 March 2025
There were 12 stocks highlighted from the US stocks watchlist scans today...
Read More
03 March, 2025
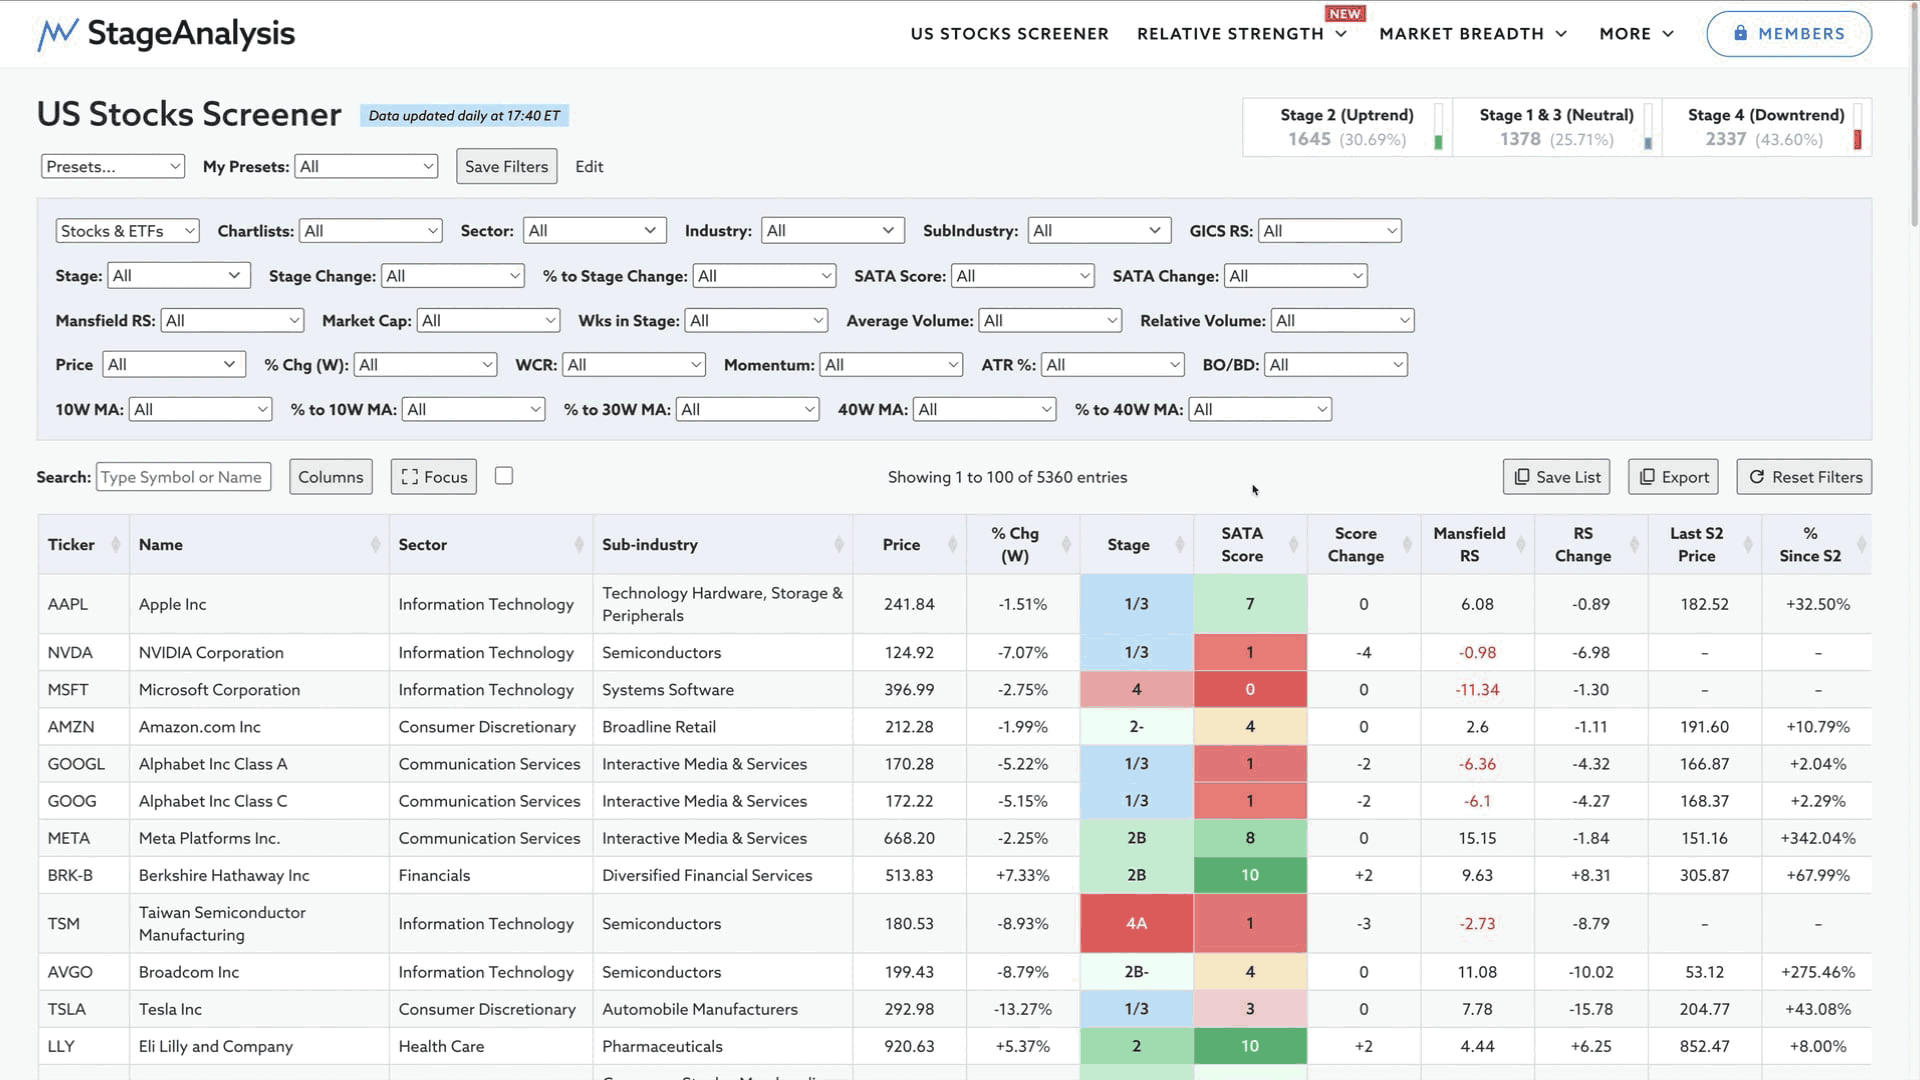
Video: How to Use the Stage Analysis Screener – 3 March 2025
Detailed video explaining the current features available in the Stage Analysis Screener at the time of recording in March 2025 and how to use them, as well as an overview of the various other Stage Analysis tools and features available to the members on the website...
Read More
02 March, 2025
Stage Analysis Members Video – 2 March 2025 (54mins)
The Stage Analysis members weekend video begins with discussion of the the US Watchlist Stocks in detail on multiple timeframes, Stages Summary including the new Sub-stages summary added this week. Relative Strength Rankings, the Sector breadth and Sub-industries Bell Curves, the key Market Breadth Charts to determine the Weight of Evidence, Bitcoin & Ethereum and the Major US Stock Market Indexes Update and ETFs on the move...
Read More
01 March, 2025
US Stocks Watchlist – 1 March 2025
There were 16 stocks highlighted from the US stocks watchlist scans today...
Read More
28 February, 2025
Market Breadth: Percentage of Stocks Above their 50 Day, 150 Day & 200 Day Moving Averages Combined
The US Total Percentage of Stocks above their 50 Day, 150 Day & 200 Day Moving Averages (shown above) decreased by -1.14% this week. Therefore, the overall combined average is at 43.94% in the US market (NYSE and Nasdaq markets combined) above their short, medium and long term moving averages.
Read More
26 February, 2025
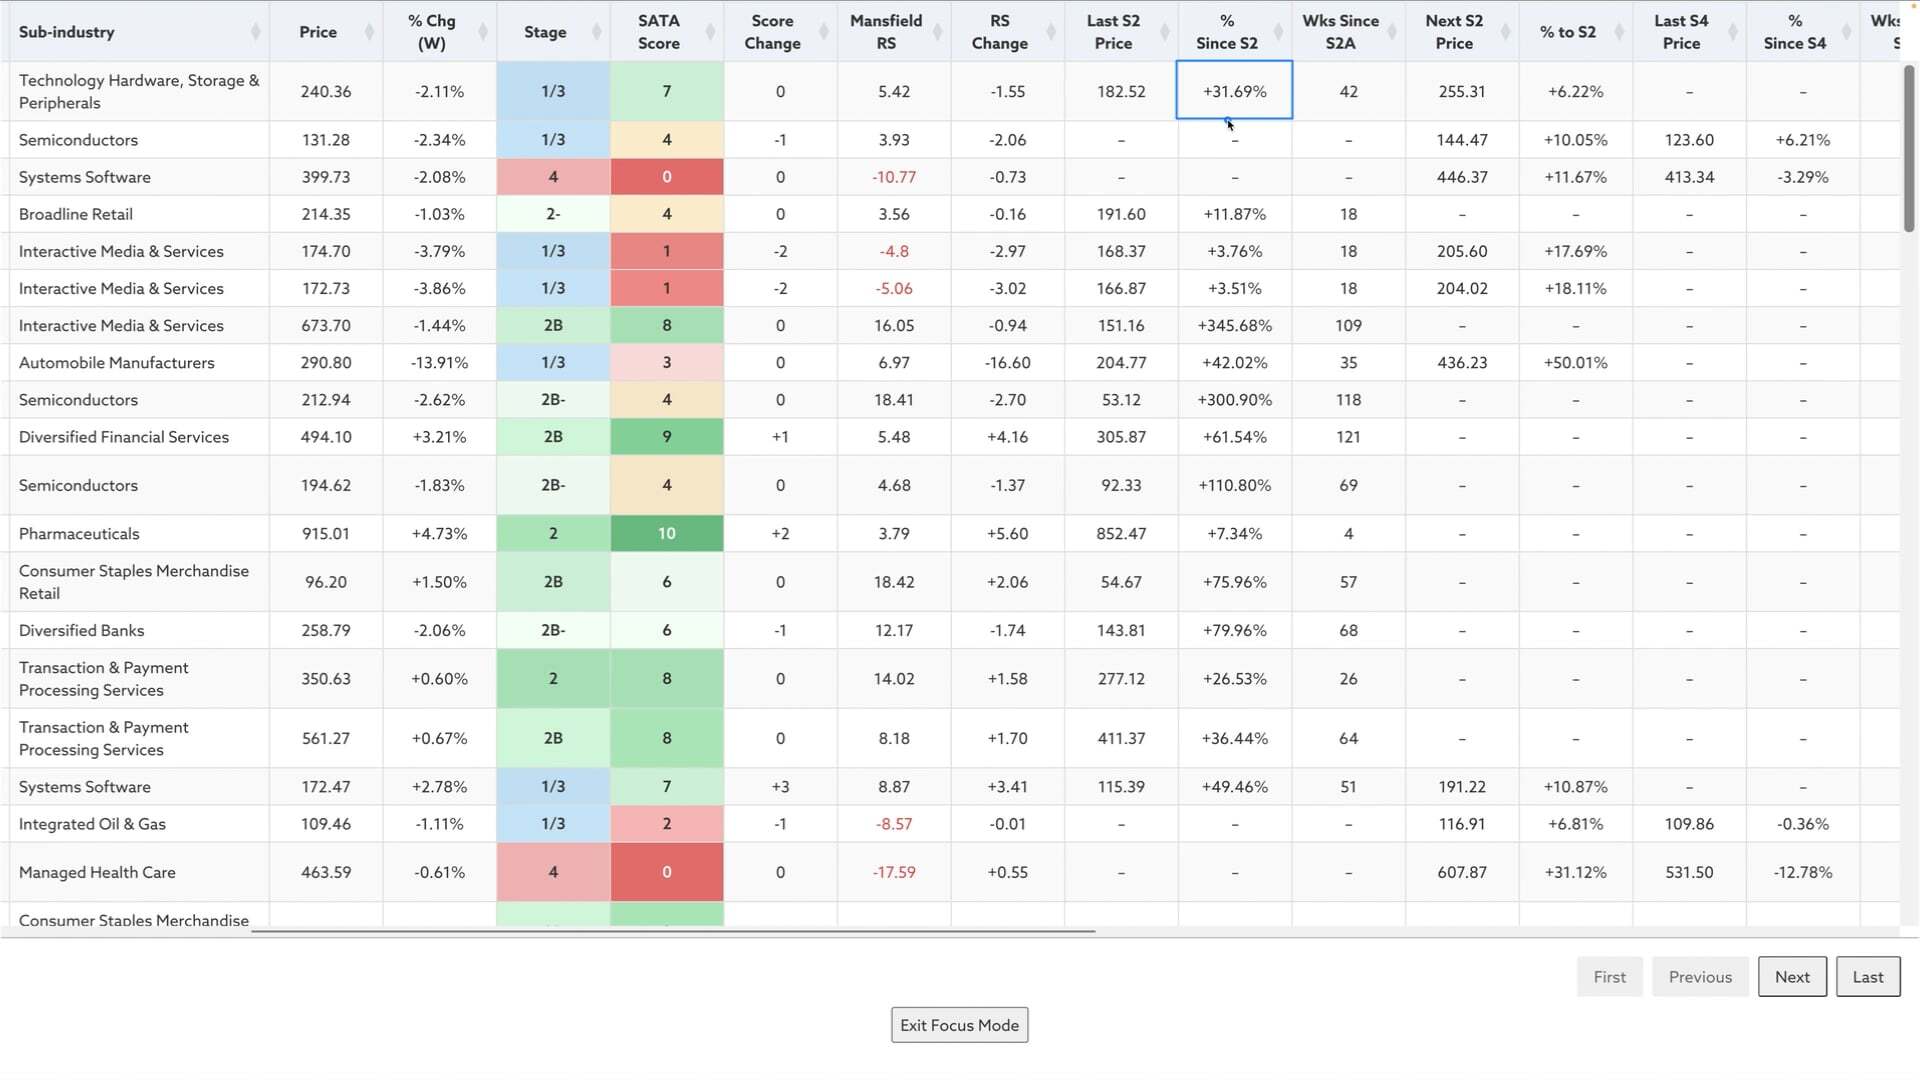
Video: New Features: Last Stage 2 and Stage 4 Price and Percent Since Columns Added – 26th February 2025
Four new data columns have been added to the Stage Analysis Screener – Last S2 Price. % Since S2. Last S4 Price. % Since S4...
Read More