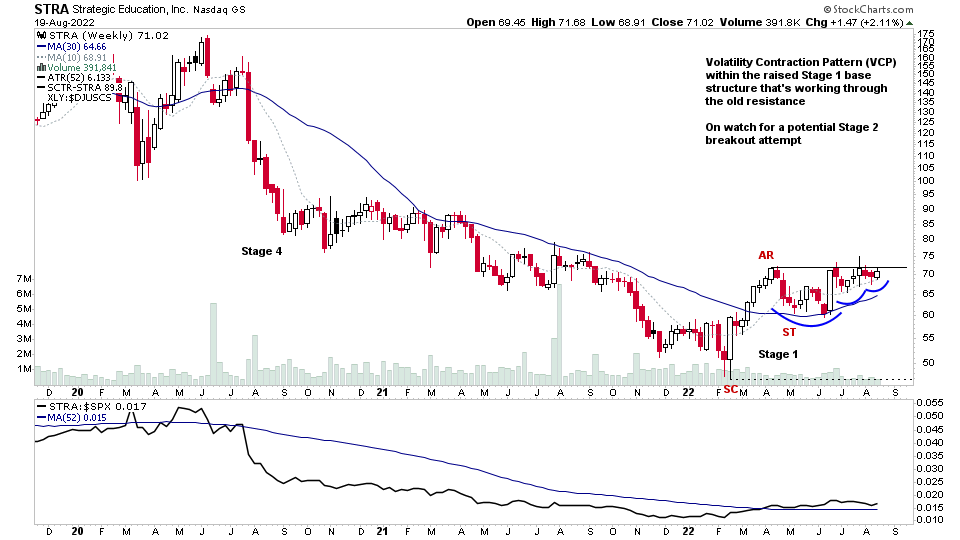
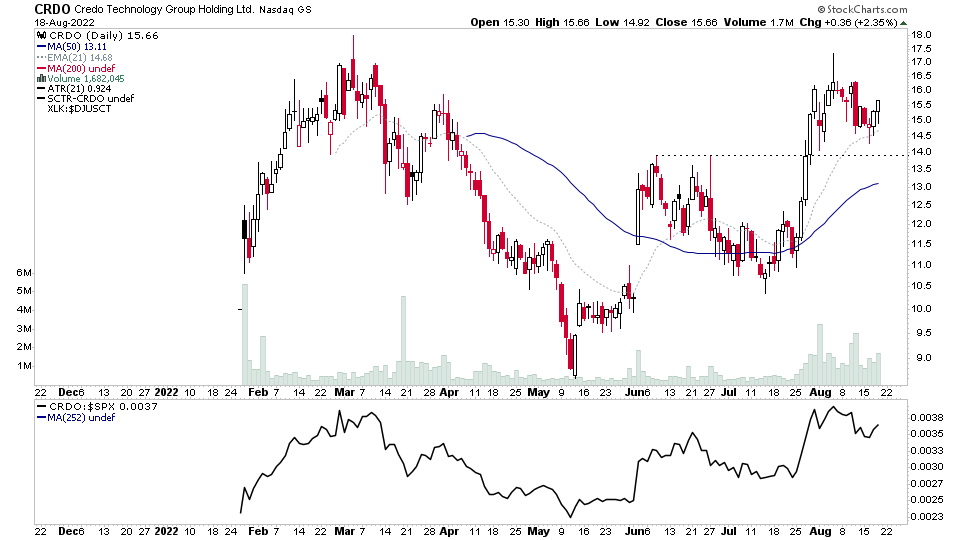
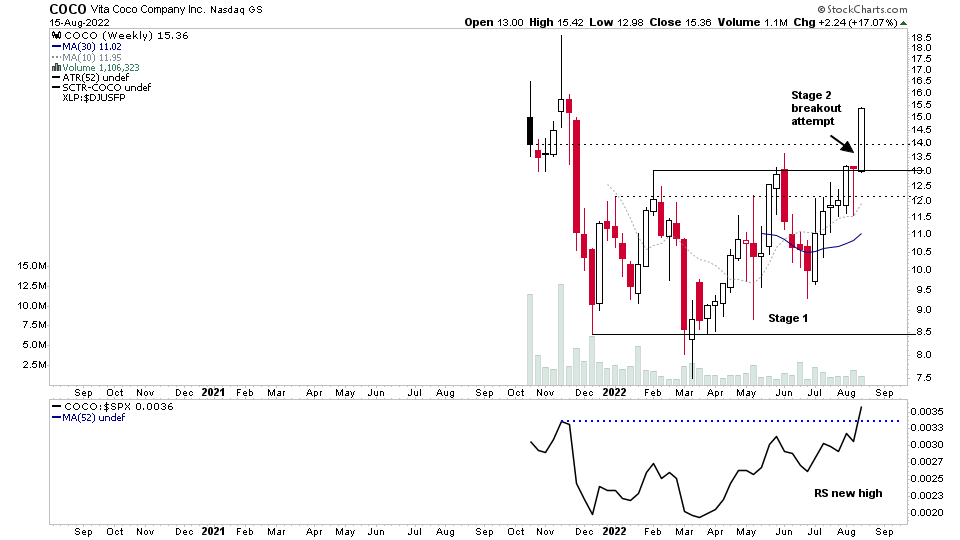
This weeks Stage Analysis Members video begins with a discussion of a more complex Stage 1 base structure that can develop when a stock has a very early Stage 2 breakout attempt from a small base that then quickly fails and broadens out into much larger Stage 1 base structure.
Read More
Blog
21 August, 2022
US Stocks Watchlist – 21 August 2022
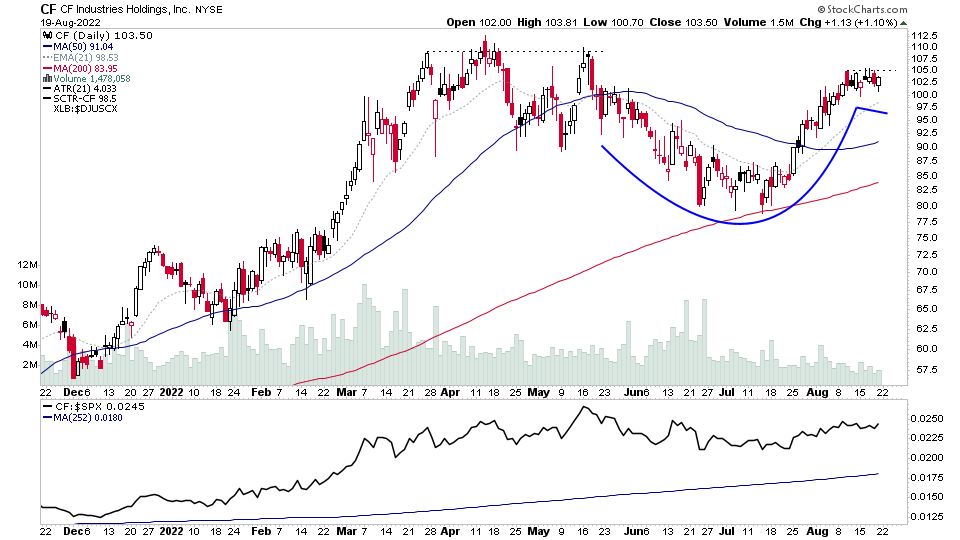
There were 24 stocks for the US stocks watchlist today – STRA, CF, TH,UNG + 20 more...
Read More
20 August, 2022
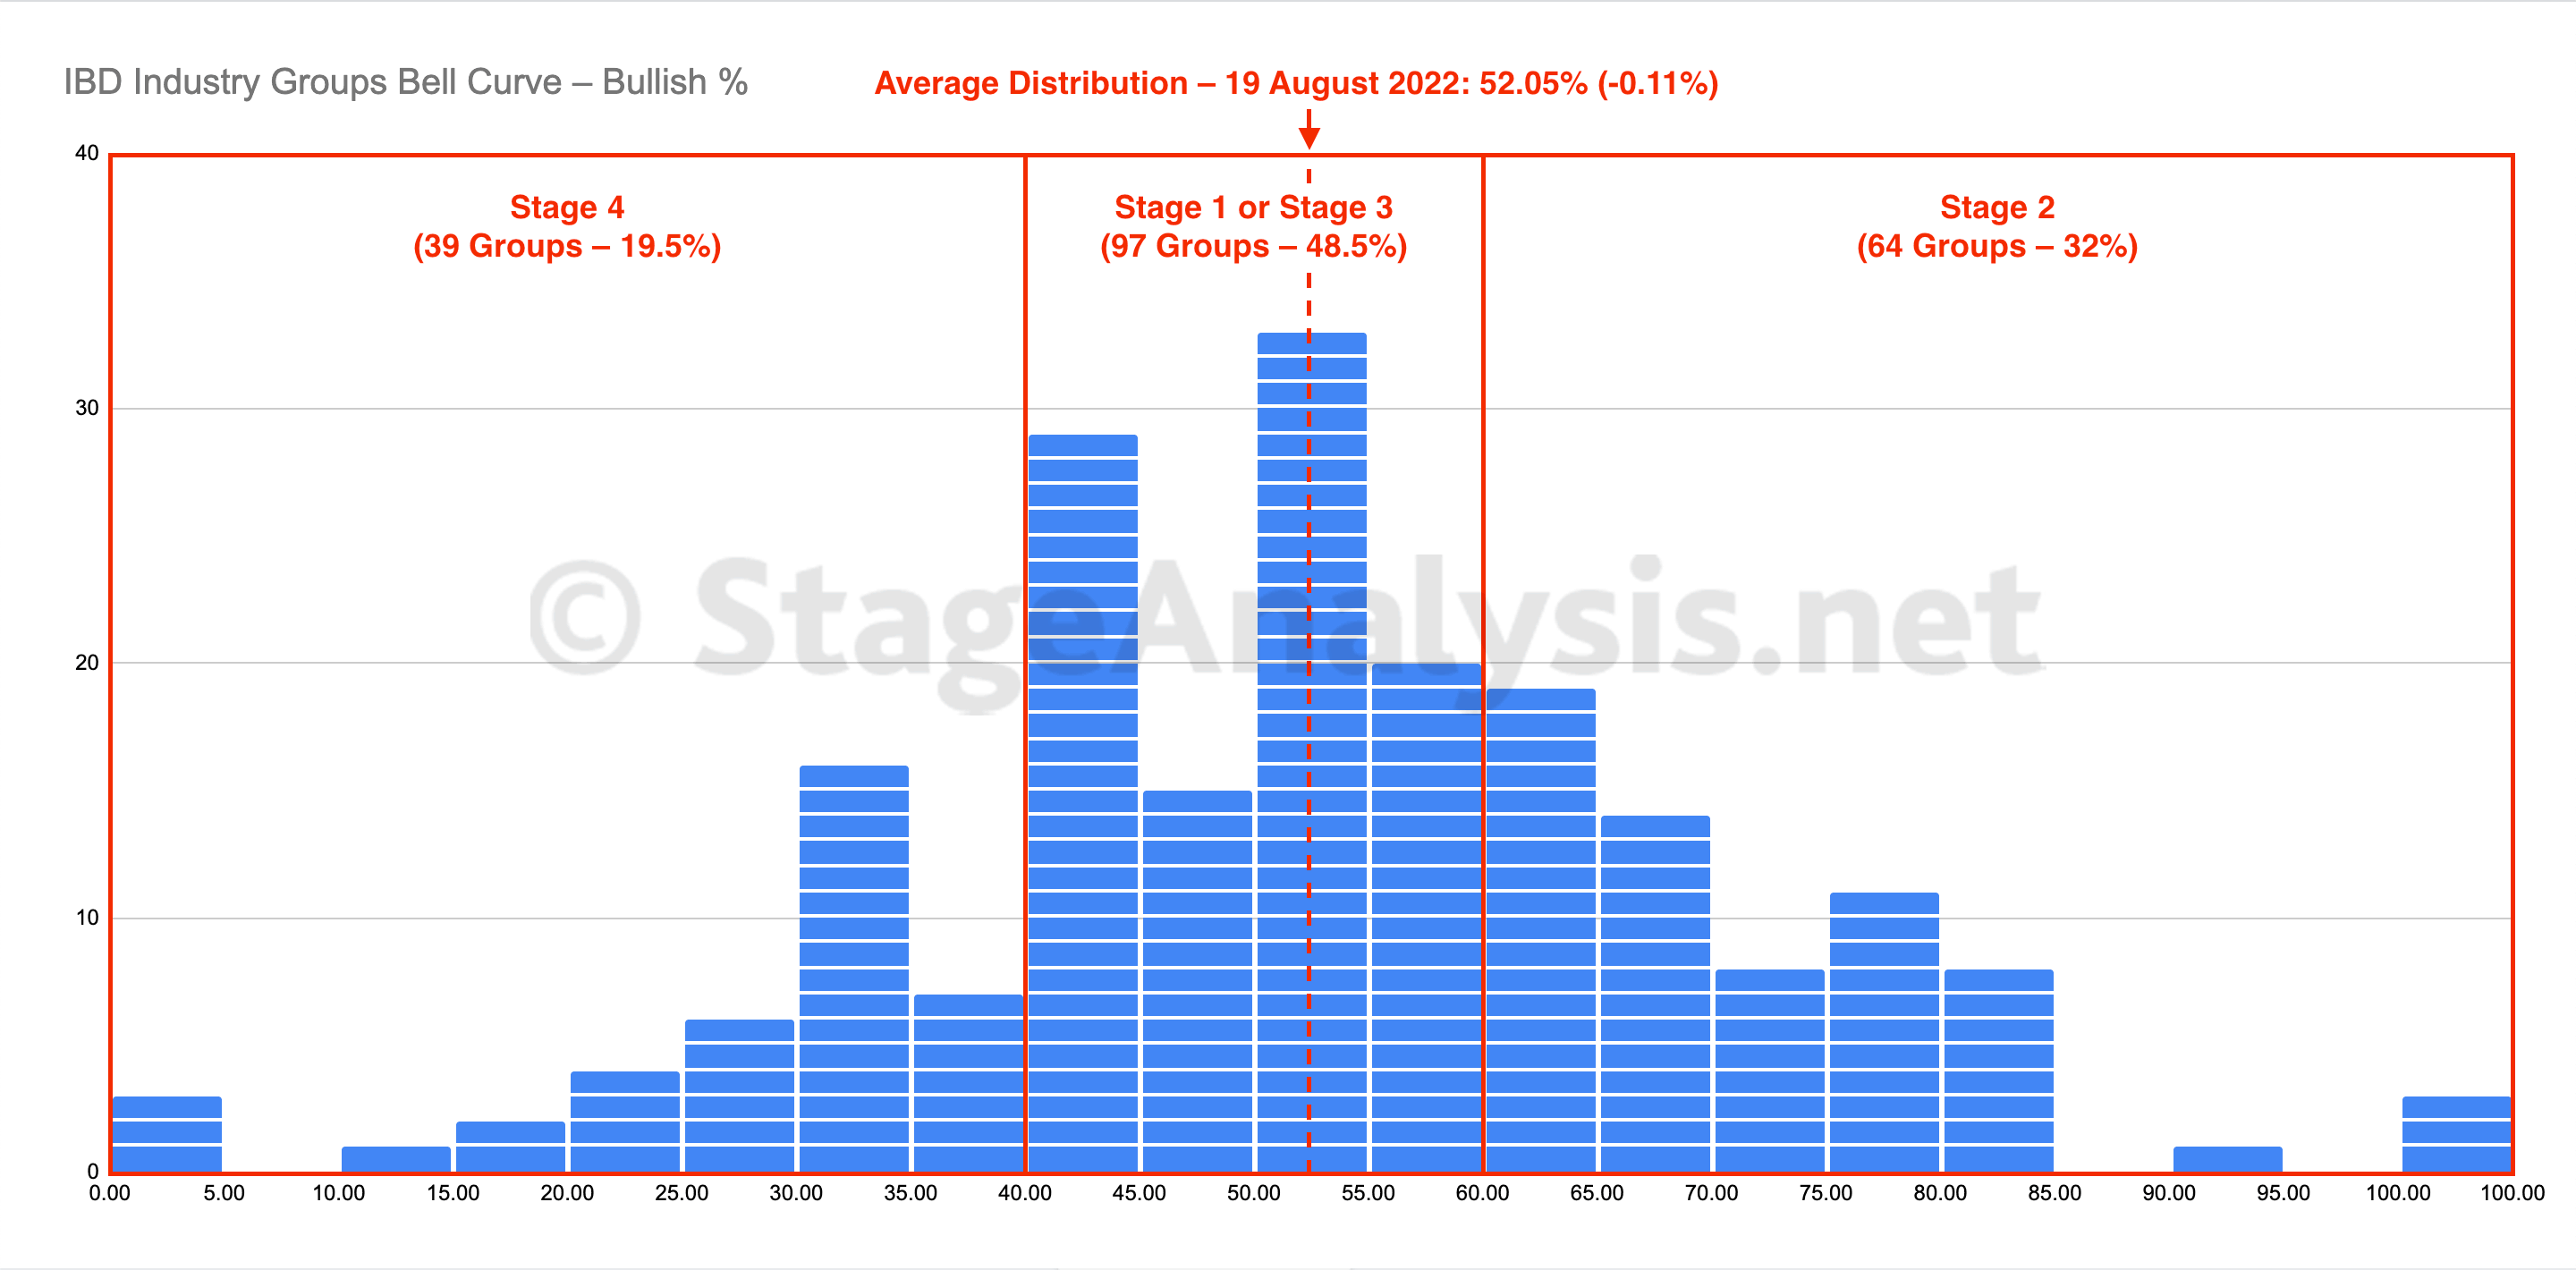
IBD Industry Groups Bell Curve – Bullish Percent
The IBD Industry Groups Bell Curve – Bullish Percent average distribution declining by -0.11% since the previous week, with 3 groups dropping out of the Stage 2 zone and one group dropping back into the Stage 4 zone. But the overall average remains slightly above the mid point of the bell curve, which is the Stage 1 zone when rising from the lower Stage 4 zone.
Read More
20 August, 2022
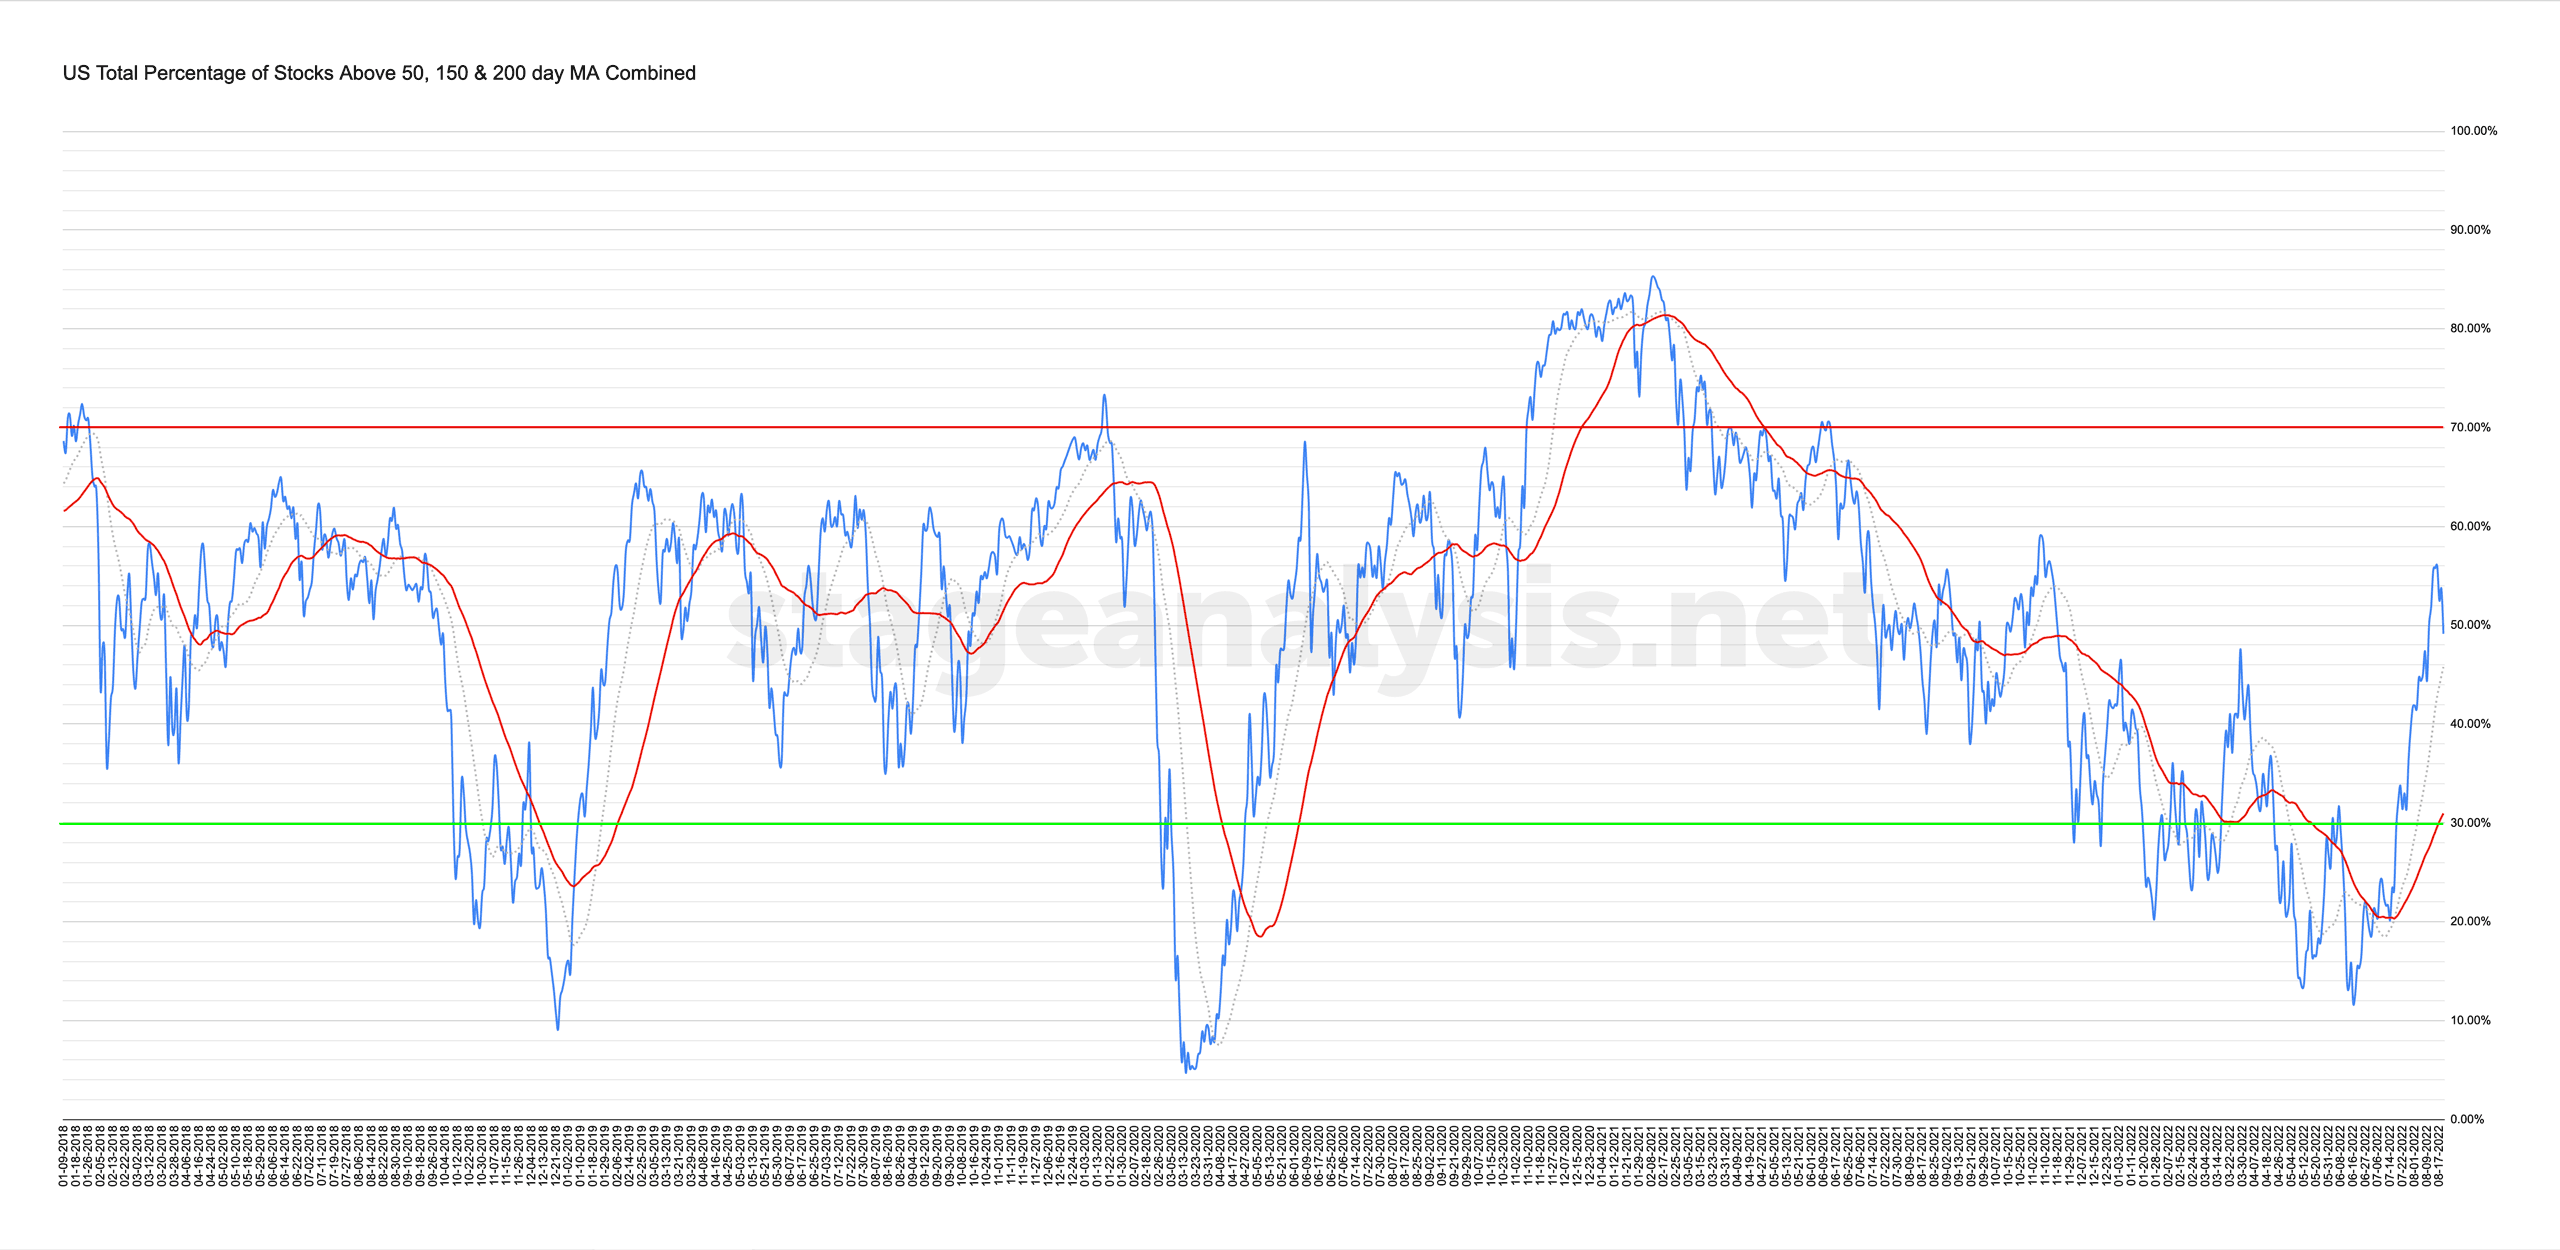
Market Breadth: Percentage of Stocks Above their 50 Day, 150 Day & 200 Day Moving Averages Combined
Custom Percentage of Stocks Above Their 50 Day, 150 Day & 200 Day Moving Averages Combined Market Breadth Charts for the Overall US Market, NYSE and Nasdaq for Market Timing and Strategy.
Read More
19 August, 2022
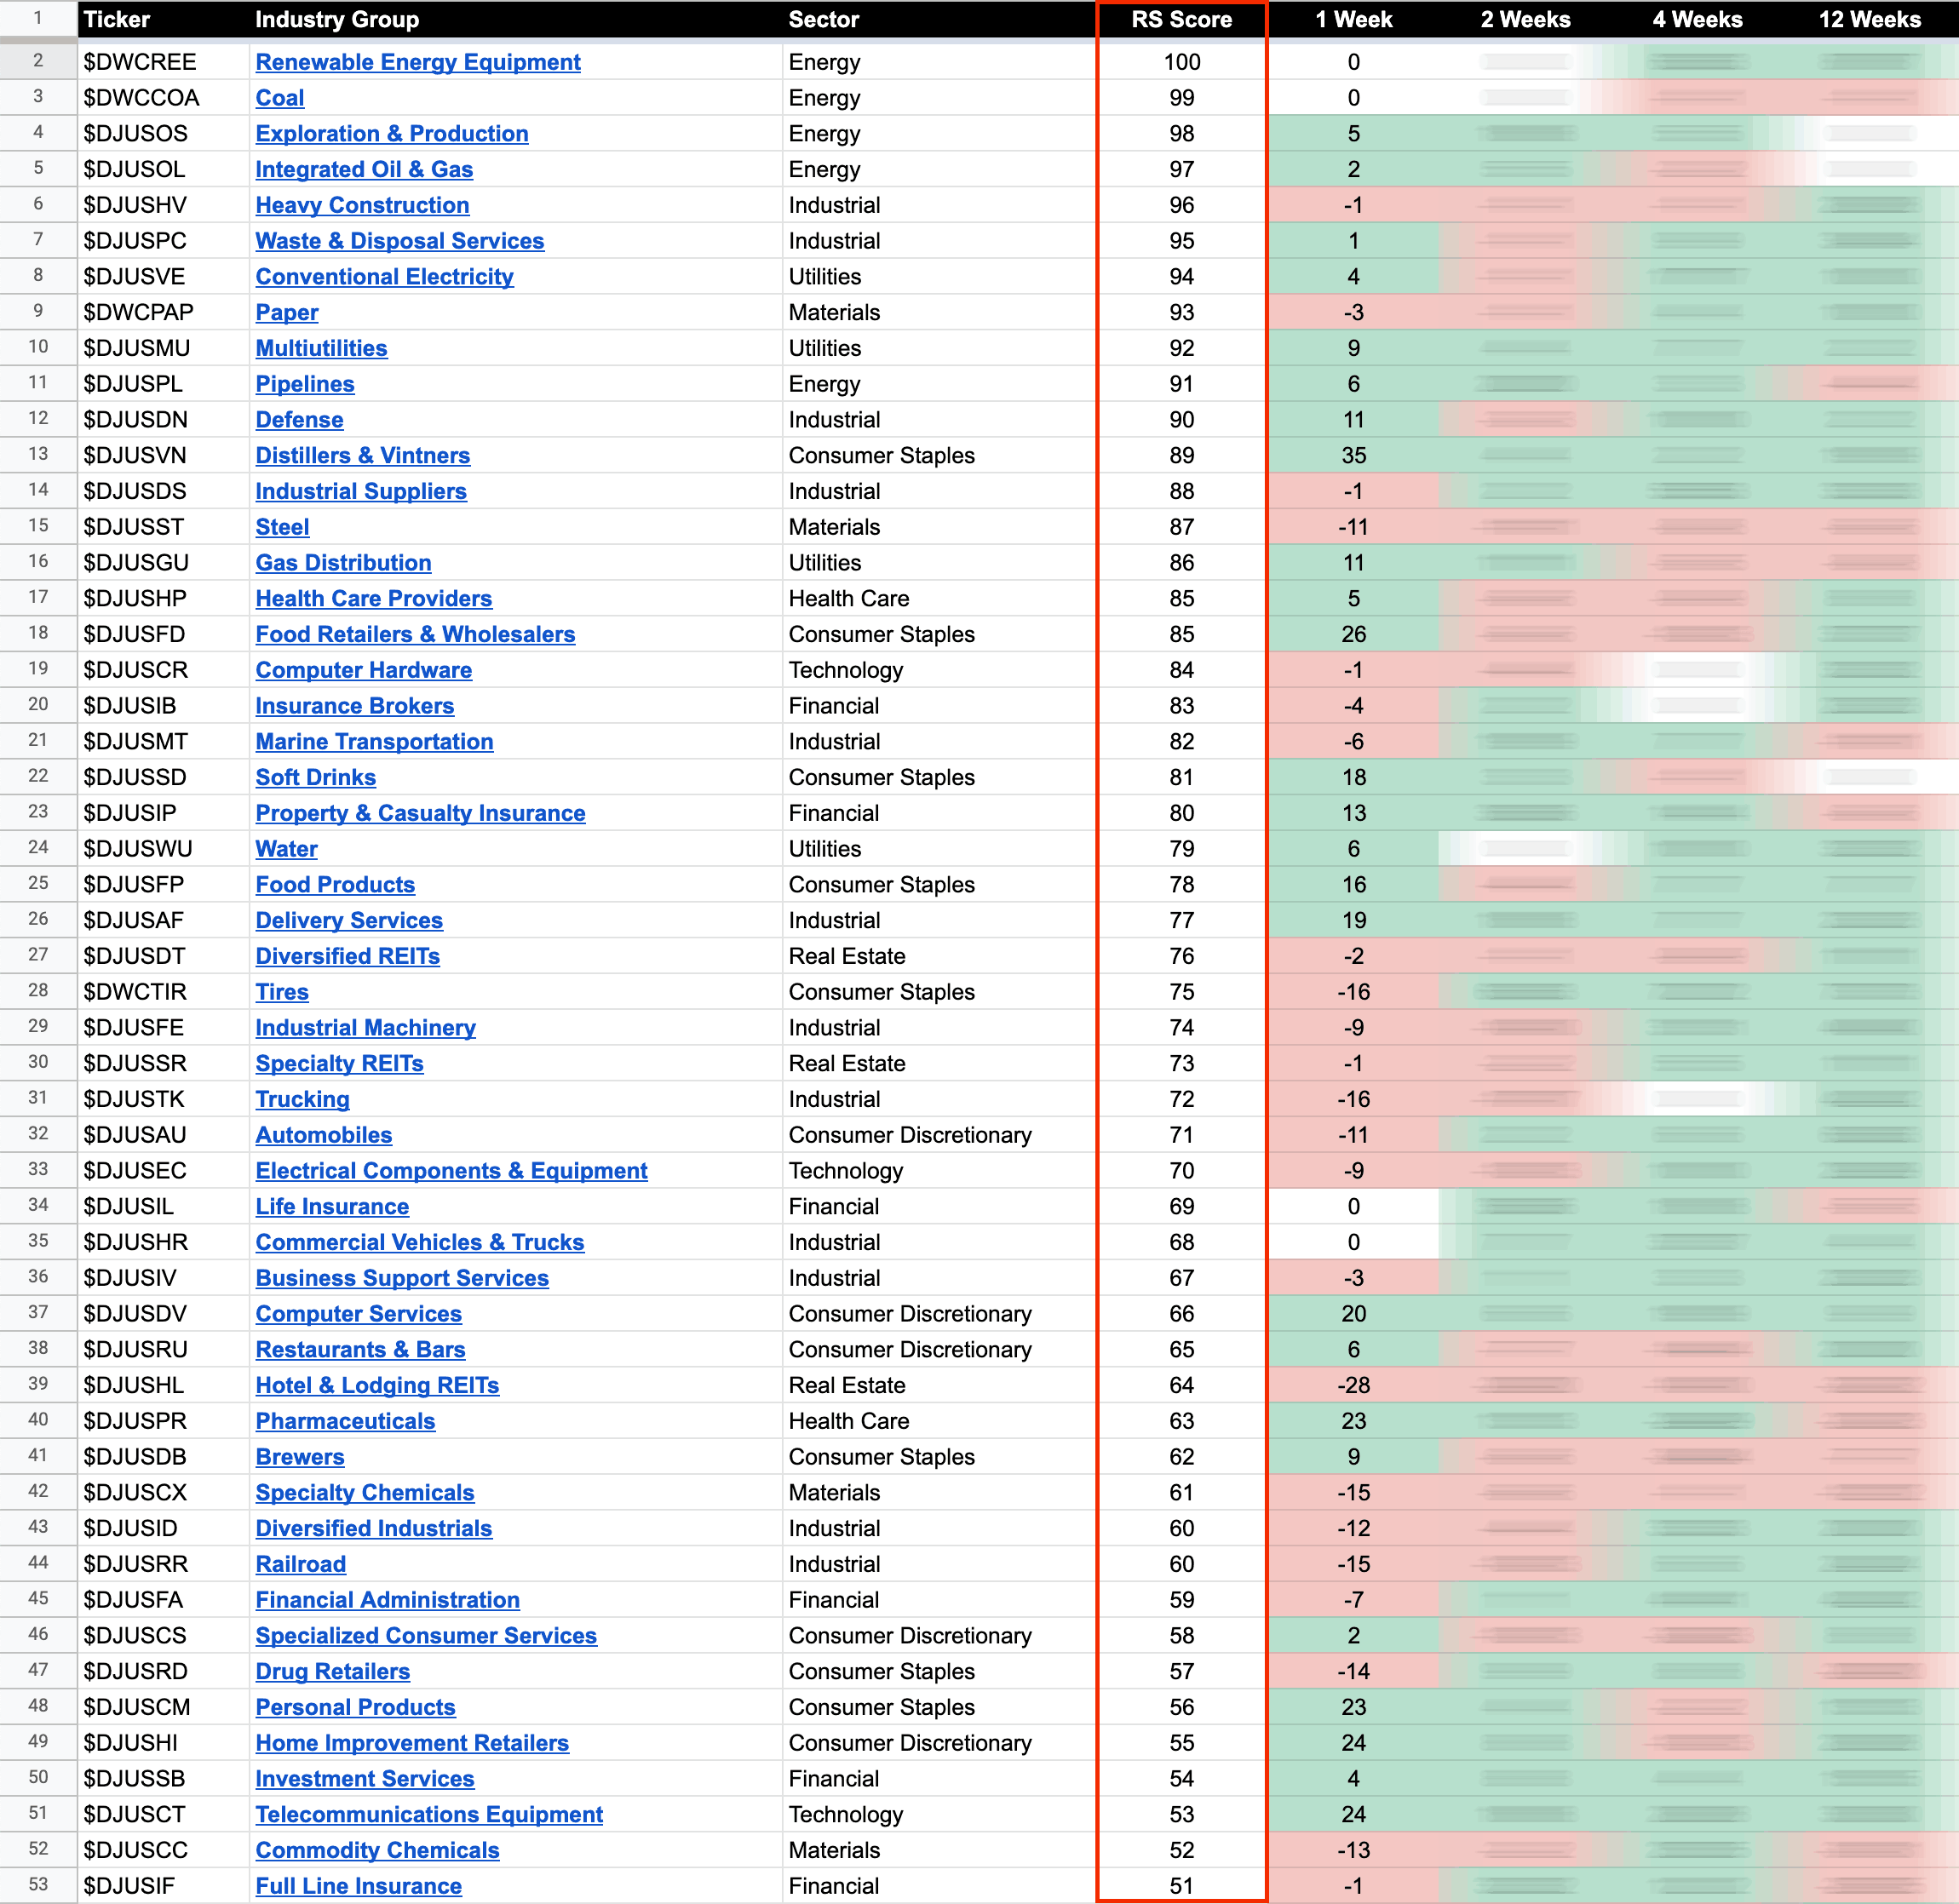
US Stocks Industry Groups Relative Strength Rankings
The purpose of the Relative Strength (RS) tables is to track the short, medium and long term RS changes of the individual groups to find the new leadership earlier than the crowd...
Read More
19 August, 2022
US Stocks Watchlist – 18 August 2022
Exploration & Production was in focus today, with multiple stocks from the group showing up in the scans, but of varying quality. However, the IBD version of the group made a new double top breakout on its P&F chart and so moves back to P&F Bull Confirmed status for the group...
Read More
17 August, 2022
Stage Analysis Members Midweek Video – 17 August 2022 (1hr 25mins)
This weeks midweek video starts with a feature on the IBD Industry Group Bullish Percent Index, which I highlighted in the blog post on Tuesday. So I wanted to do a deeper discussion on the comparative periods from the chart to show the type of market behaviour that came next during each of the previous periods.
Read More
17 August, 2022
Stock Market Update and US Stocks Watchlist – 16 August 2022
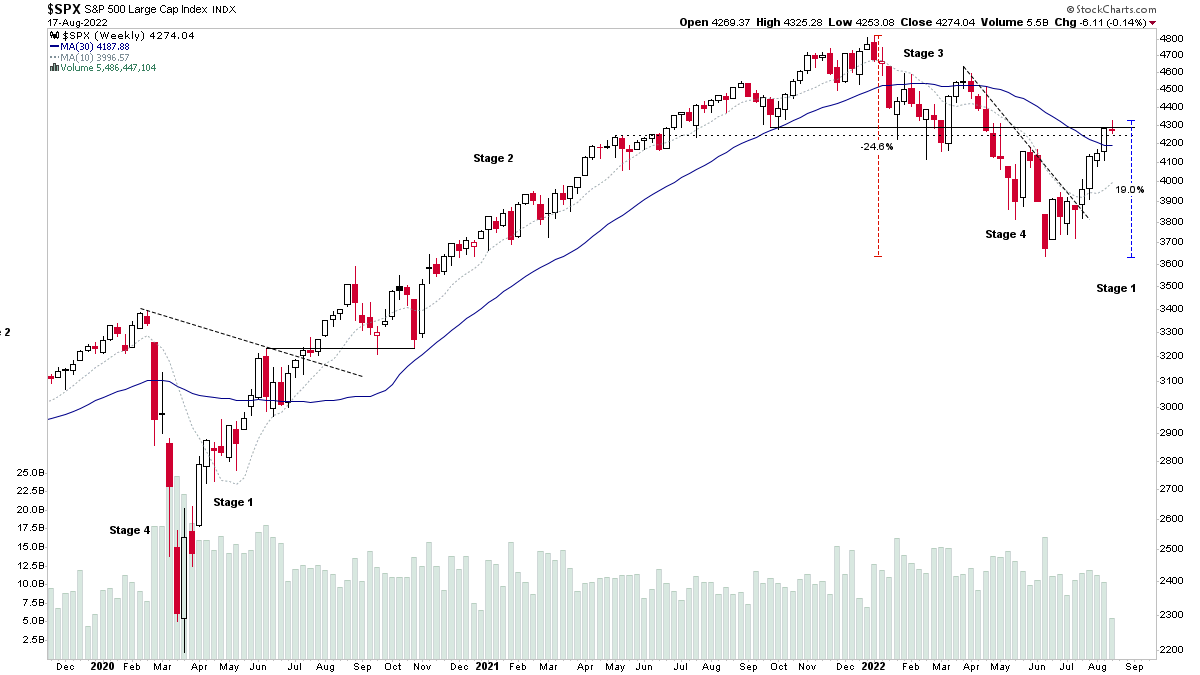
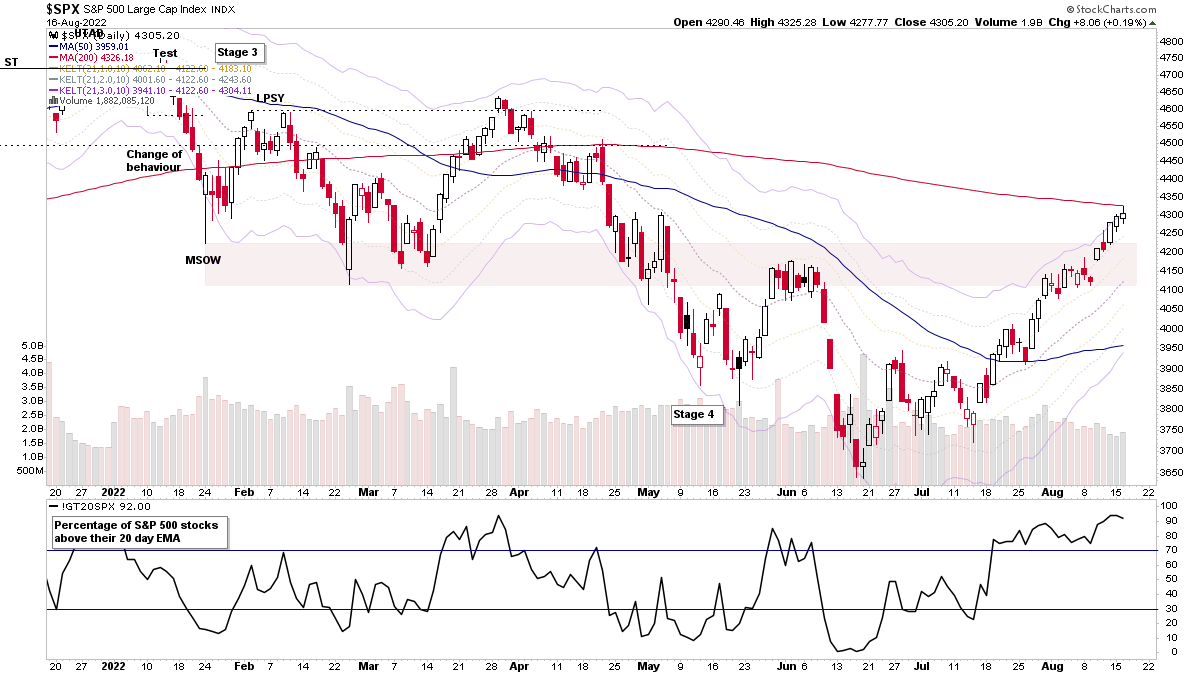
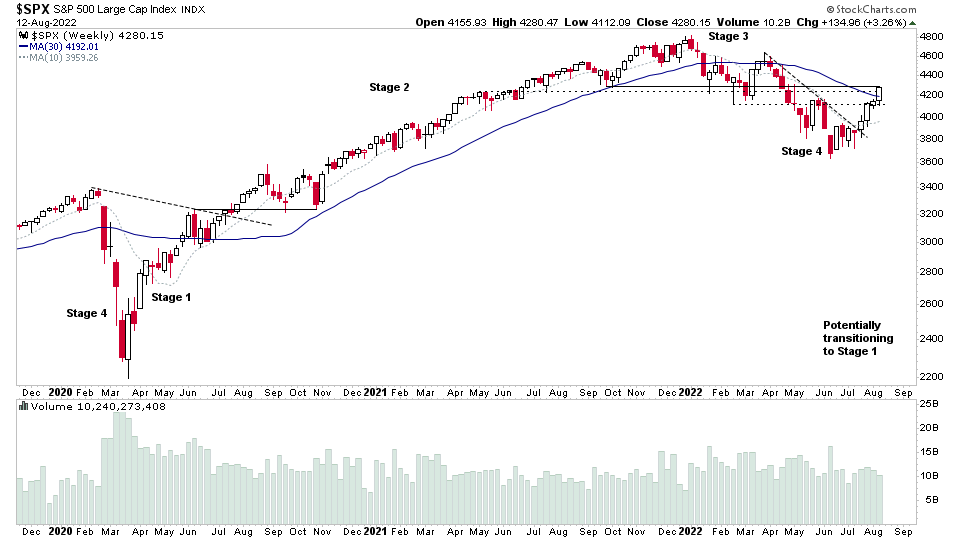
With the S&P 500 testing the 200 day MA today and Dow Industrials closing above it, the IBD Industry Group Bullish Percent Index has moved above the 60% level, which is the level that I use to determine the Stage 2 zone. 60%+ is considered in the Stage 2 zone. So although the majority of the major market indexes are only in Stage 1, the Industry Group Bullish Percent breadth data is moving into a tentative Stage 2 zone position...
Read More
15 August, 2022
US Stocks Watchlist – 15 August 2022
Stage 2 Breakout Attempt – COCO was highlighted multiple times in the watchlist since May as it developed a Stage 1 base and moved into late Stage 1B. The last time I highlighted it was on the 25th July at $12 ,as it tightened up near the top of the range and held above the short-term moving averages.
Read More
14 August, 2022
Stage Analysis Members Weekend Video – 14 August 2022 (1hr 32mins)
This weeks Stage Analysis Members weekend video begins with a detailed run through of the weekend watchlist stocks on multiple timeframes, with live markups of the charts and explanations of what we are looking for in each.
Read More

