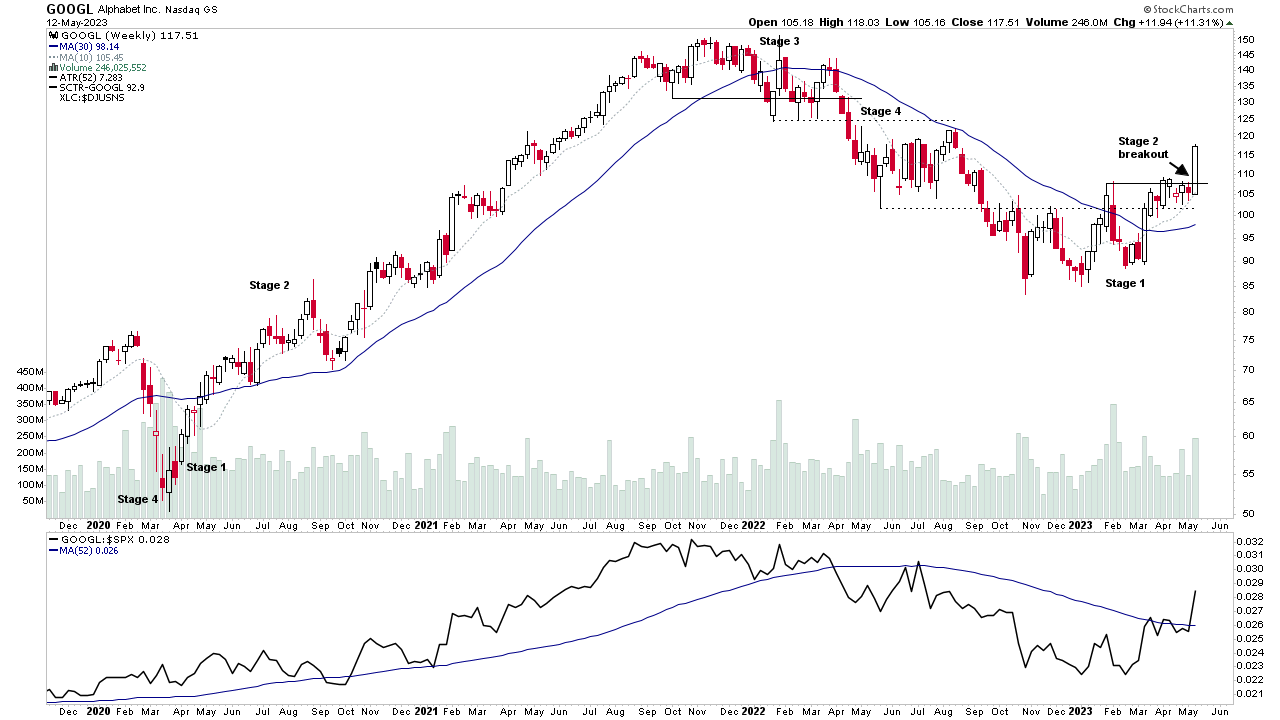
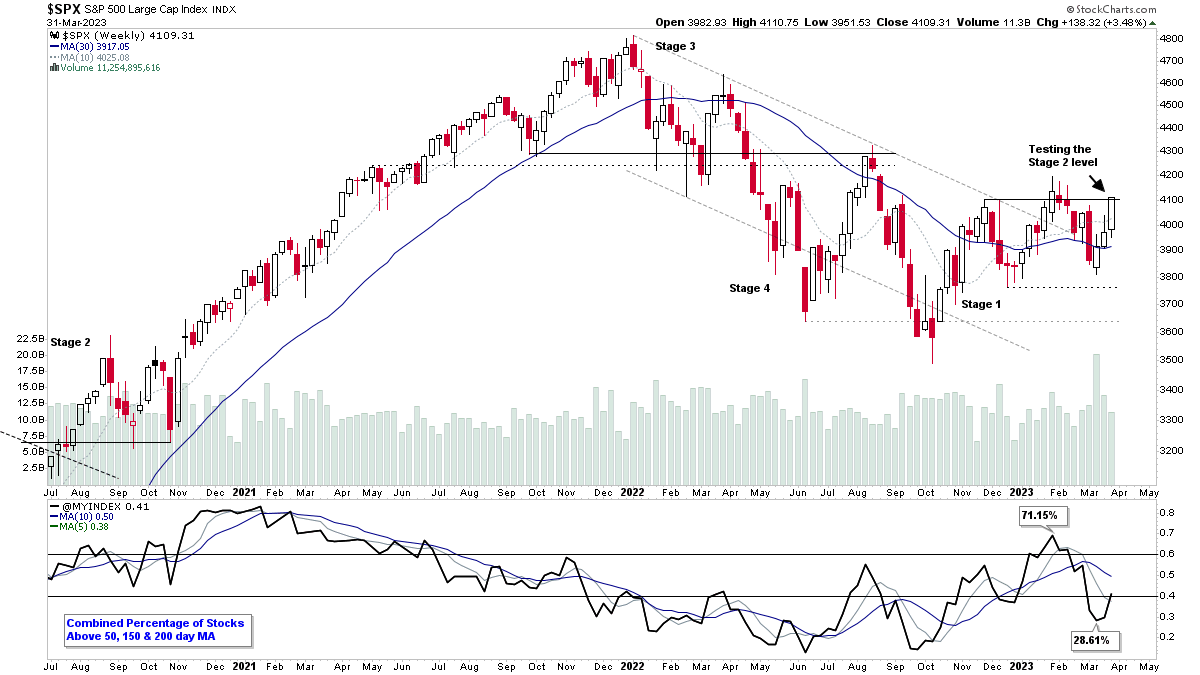
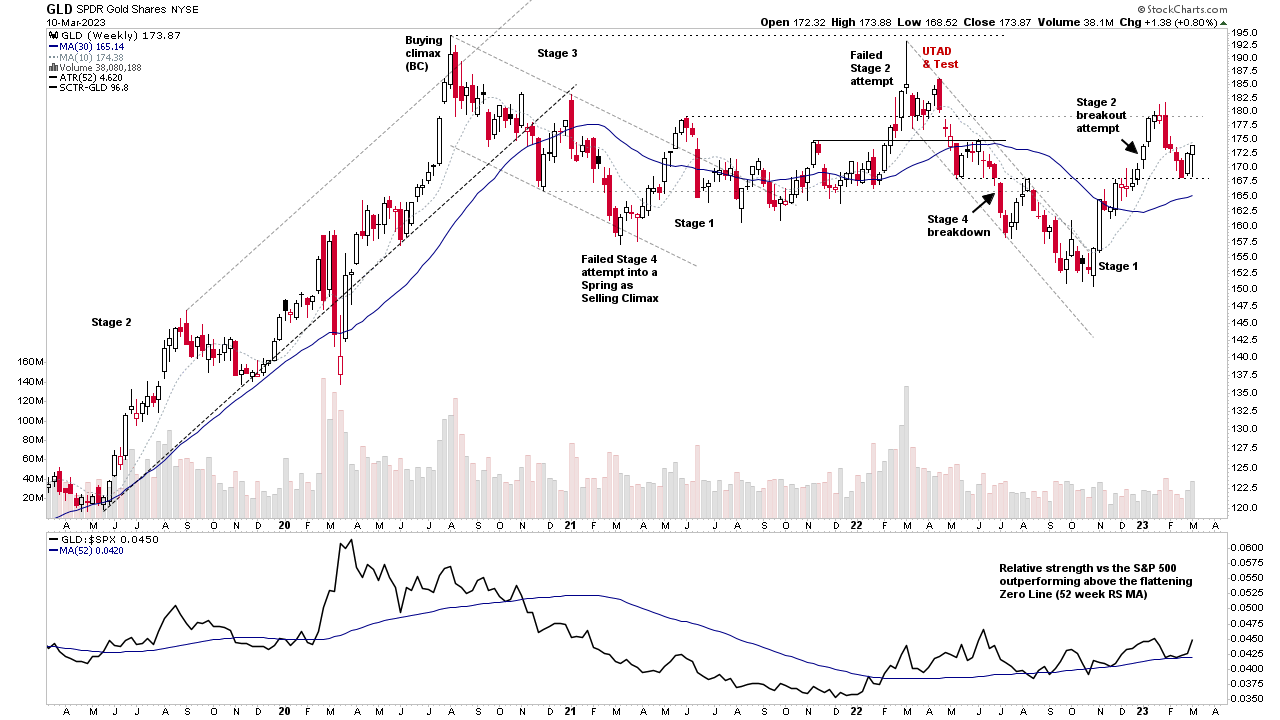
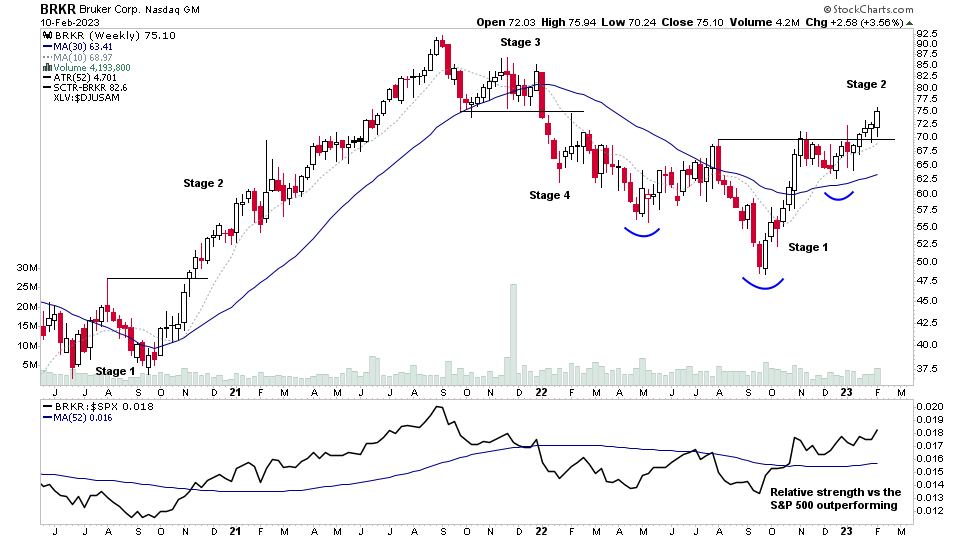
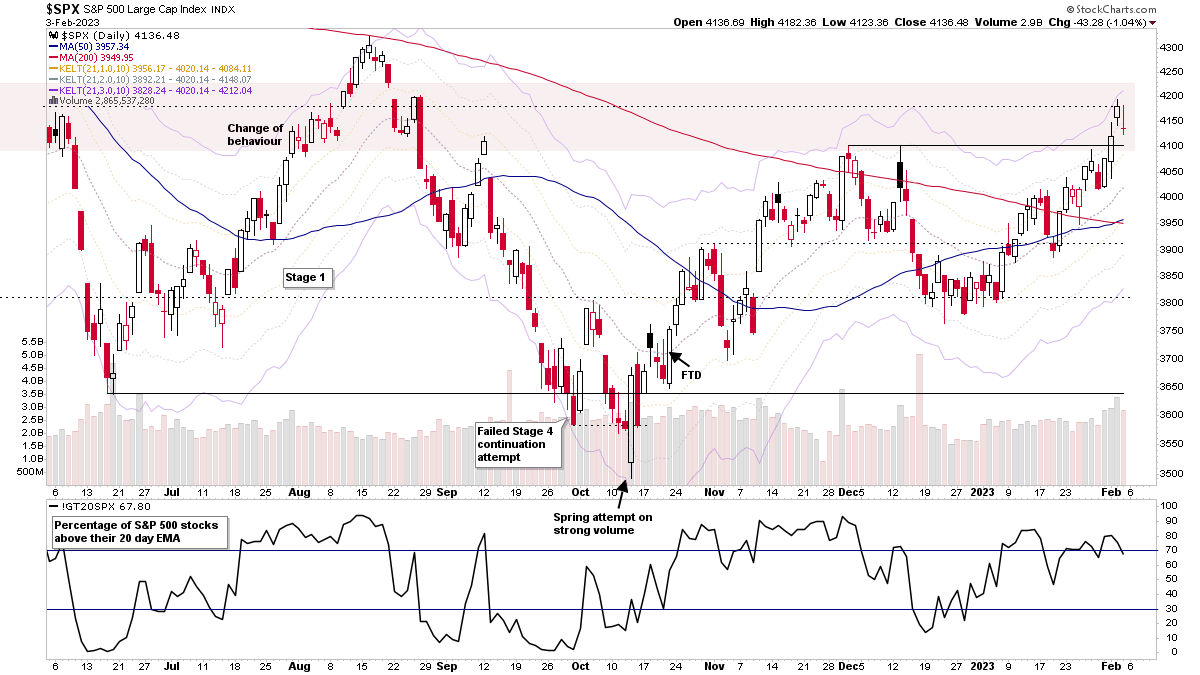
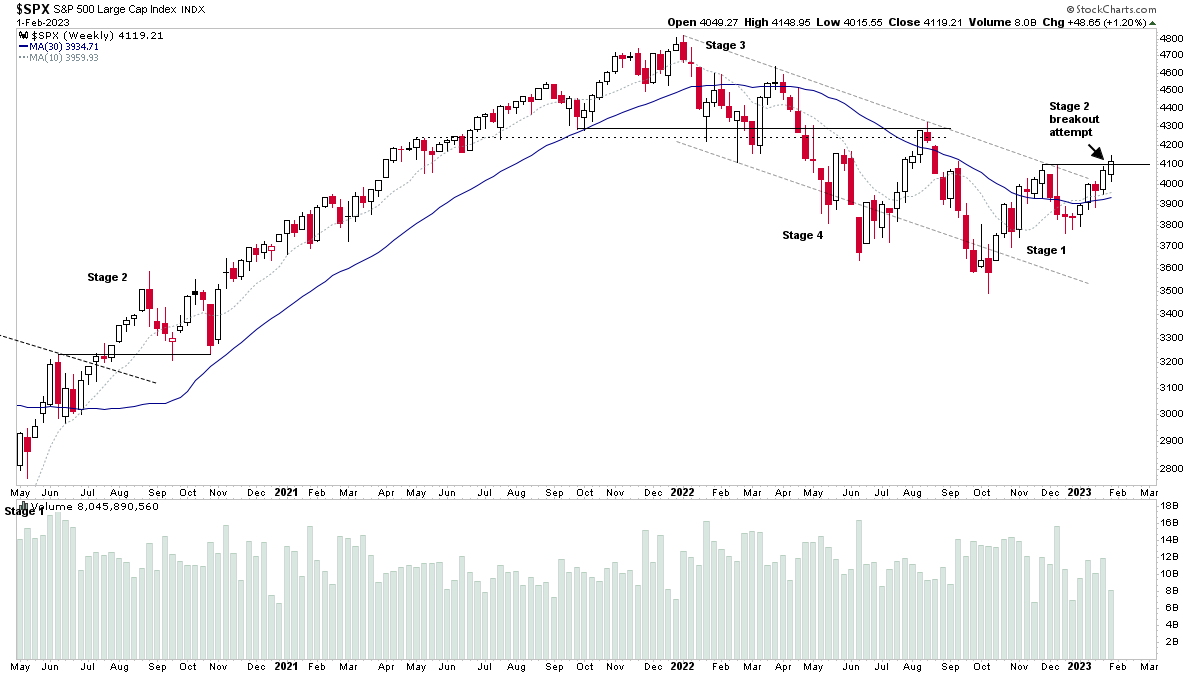
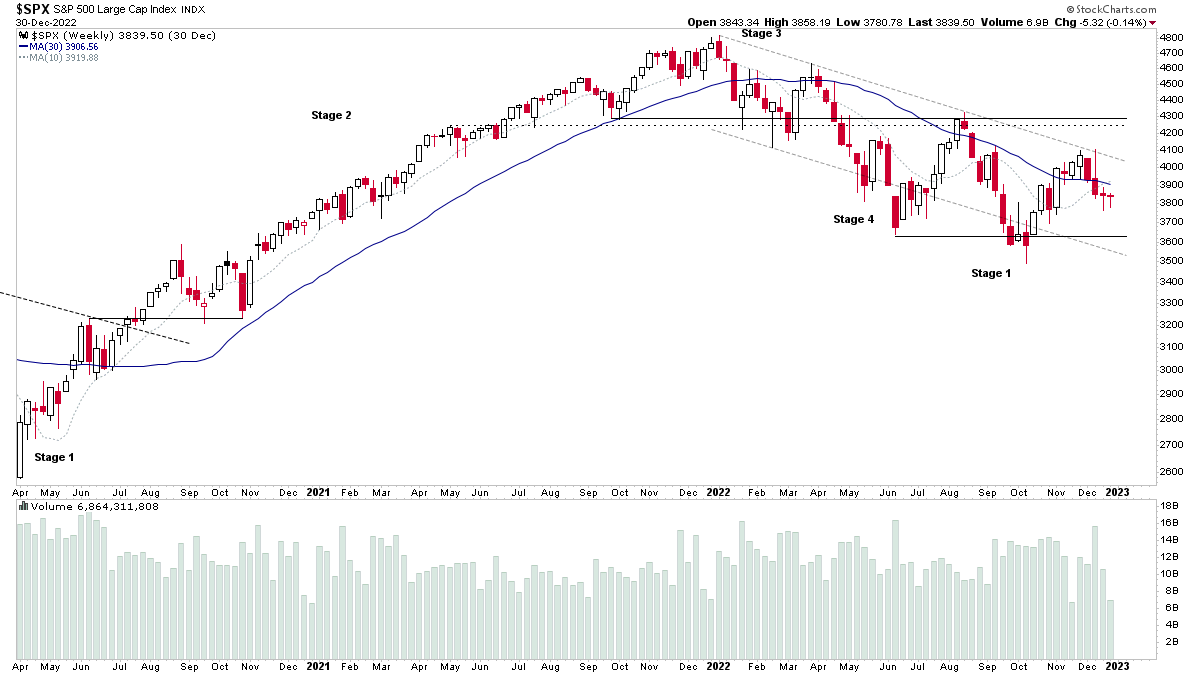
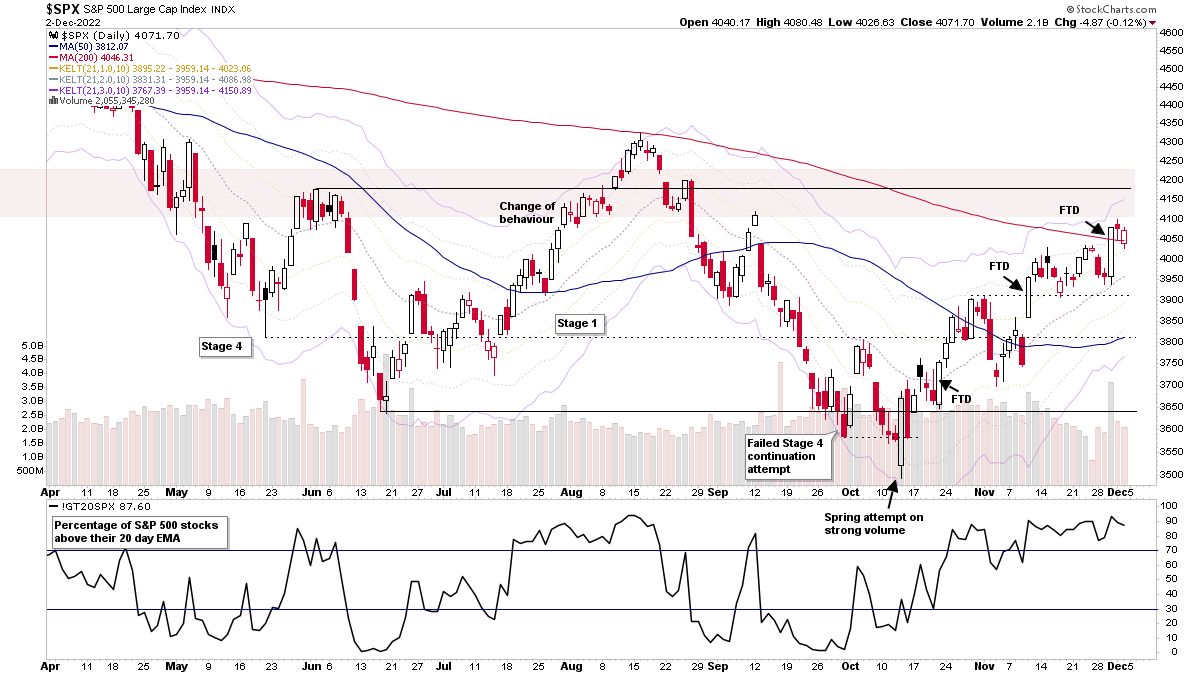
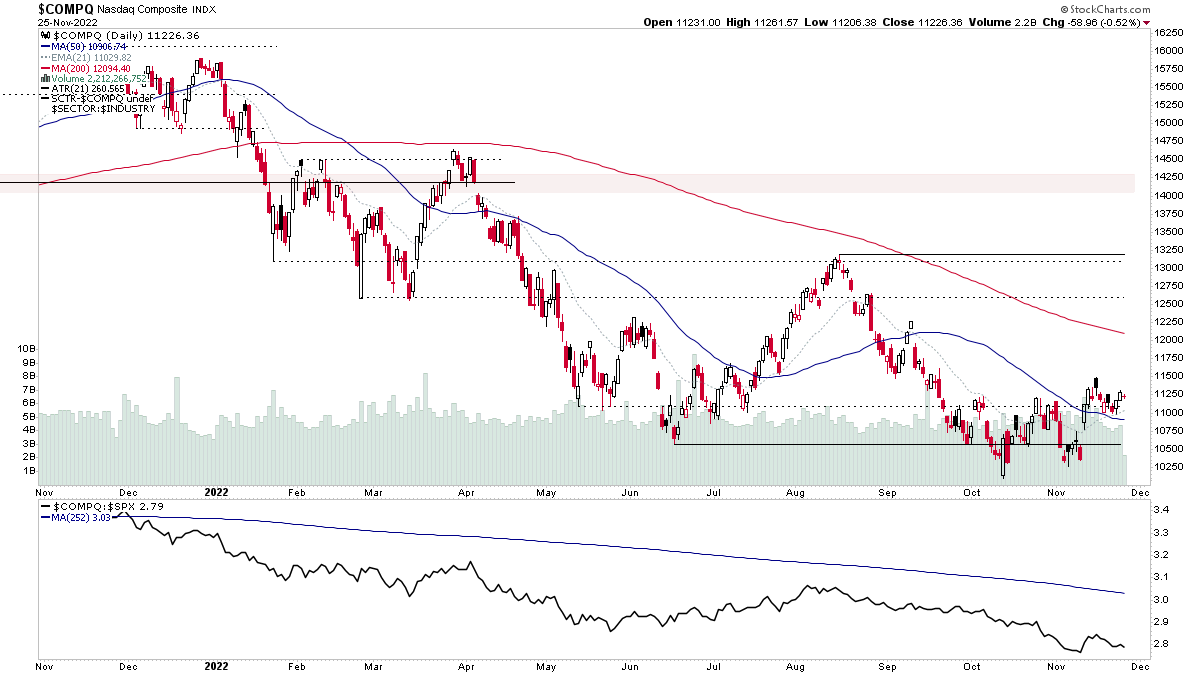
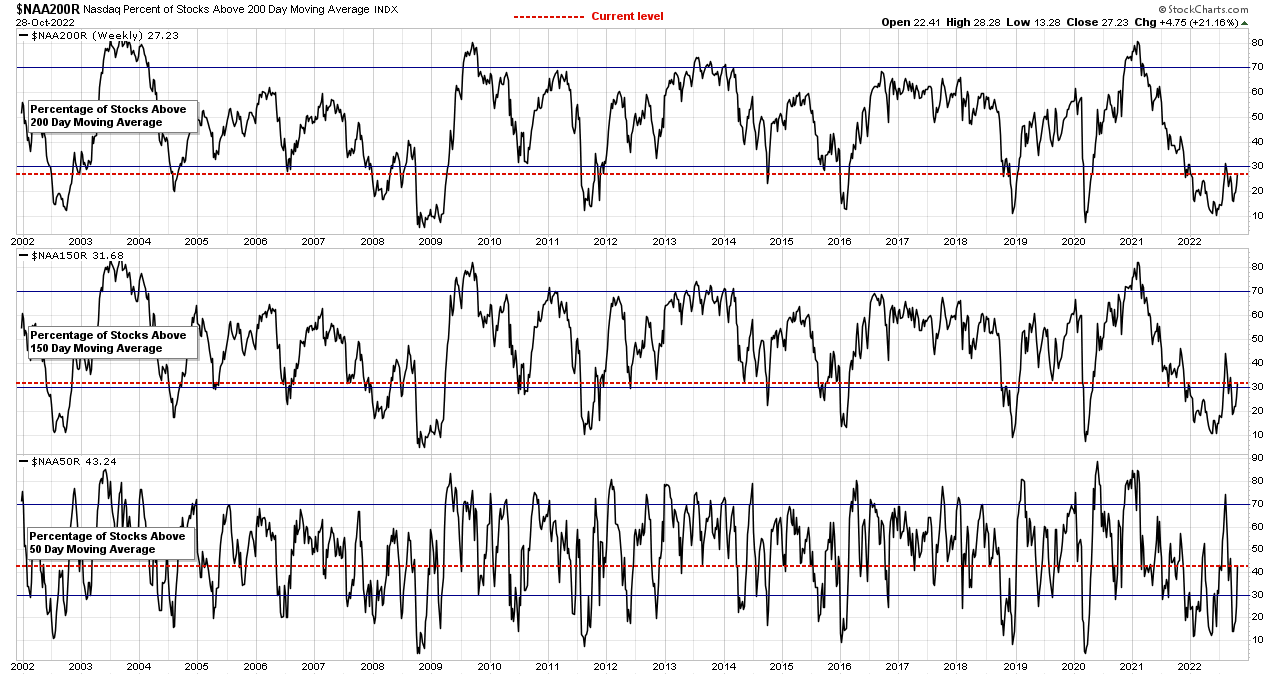
Stage Analysis weekend video featuring the weeks most significant Stage 2 Breakouts and Continuation attempts, plus the regular weekly member content of the Major Indexes Update, Futures SATA Charts, Industry Groups RS Rankings, IBD Industry Group Bell Curve, Market Breadth Update to help to determine the weight of evidence, and finishing by discussing the US Watchlist Stocks from the weekend scans in detail on multiple timeframes.
Read More
Blog
02 April, 2023
Stage Analysis Members Video – 2 April 2023 (1hr 17mins)
The Stage Analysis members weekend video this week features analysis of the Stage 2 breakout attempt in the Nasdaq 100, and test of the Stage 2 level by the S&P 500. Also discussion of the futures charts, US Stocks Industry Groups RS Rankings...
Read More
12 March, 2023
Stage Analysis Members Video – 12 March 2023 (1hr 29mins)
The Stage Analysis members weekend video this week begins with a discussion on Gold as it attempts to rebound around its prior Stage 2 breakout level in the turn with the US Dollar Index attempting to rollover at its Stage 4 breakdown level. Then a discussion of the Stage 4 breakdowns in the Bank indexes and different ETFs that cover them. Before the more regular weekly content of the Major Indexes Update, Futures and US Treasuries, IBD Industry Groups Bell Curve – Bullish Percent, US Stocks Industry Groups RS Rankings, Market Breadth Update – Weight of Evidence and some of the weeks Stage 2 Breakout attempts against the overall market action.
Read More
12 February, 2023
Stage Analysis Members Video – 12 February 2023 (1hr)
The Stage Analysis members weekend video featuring the regular content with the major US Indexes, the futures charts, US Industry Groups RS Rankings, IBD Industry Groups Bell Curve - Bullish Percent, the Market Breadth Update to help to determine the Weight of Evidence and finishing with the US Stocks Watchlist in detail on multiple timeframes.
Read More
05 February, 2023
Stage Analysis Members Video – 5 February 2023 (1hr 31mins)
The Stage Analysis members weekend video featuring the regular content with the major US Indexes, the futures charts, US Industry Groups RS Rankings, IBD Industry Groups Bell Curve - Bullish Percent, the Market Breadth Update to help to determine the Weight of Evidence and finishing with the US Stocks Watchlist in detail on multiple timeframes.
Read More
01 February, 2023
Stage Analysis Members Video – 1 February 2023 (35 mins)
Stage Analysis Members midweek video discussing the Stage 2 breakout attempts in some of the major indexes, a look at the some of the key market breadth data, recent watchlist stocks and more on the small caps from yesterdays post.
Read More
02 January, 2023
Stage Analysis Members Video – 2 January 2023 (1hr 31mins)
The Stage Analysis members weekend video with an end of year review of the markets, and special features on the US Industry Groups Relative Strength 2022 strongest groups, and the IBD Top 5 stocks of 2022. Plus the IBD industry group bell curve, and the market breadth charts to determine the weight of evidence. Followed by the US watchlist stocks in detail on multiple timeframes.
Read More
04 December, 2022
Stage Analysis Members Video – 4 December 2022 (1hr 27mins)
The Stage Analysis members weekend video discussing the market indexes, Dollar index, commodities, industry groups relative strength, IBD industry group bell curve – bullish percent, market breadth charts to determine the weight of evidence, Stage 2 breakout attempts and the US watchlist stocks in detail on multiple timeframes.
Read More
27 November, 2022
Stage Analysis Members Video – 27 November 2022 (1hr 24mins)
The Stage Analysis members weekend video discussing the market indexes, Dollar index, commodities, industry groups relative strength, IBD industry group bell curve – bullish percent, market breadth charts to determine the weight of evidence, this weeks Stage 2 breakout attempts and the US watchlist stocks in detail on multiple timeframes.
Read More
30 October, 2022
Stage Analysis Members Video Part 3 – Market Breadth – 30 October 2022 (18 mins)
Part 3 of the regular members weekend video discussing the market breadth to determine the weight of evidence.
Read More

