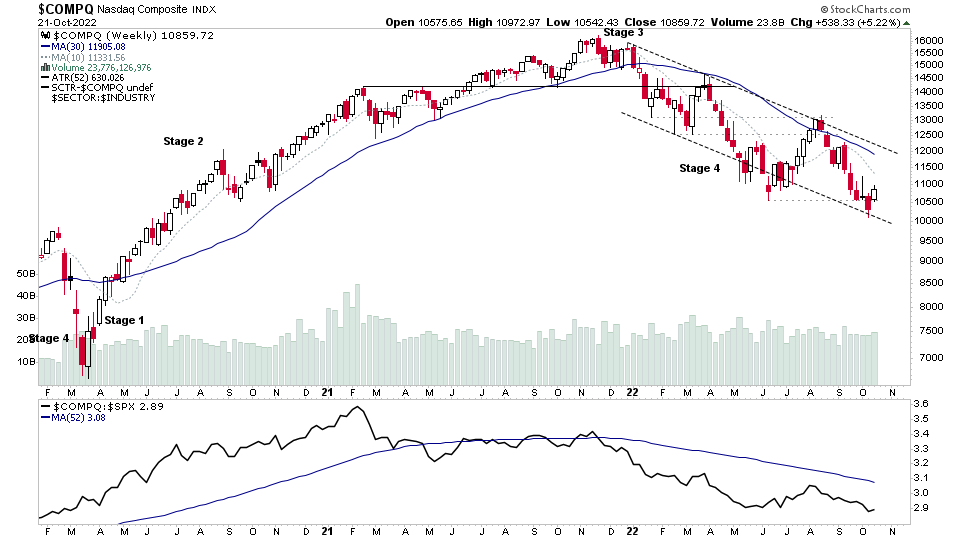
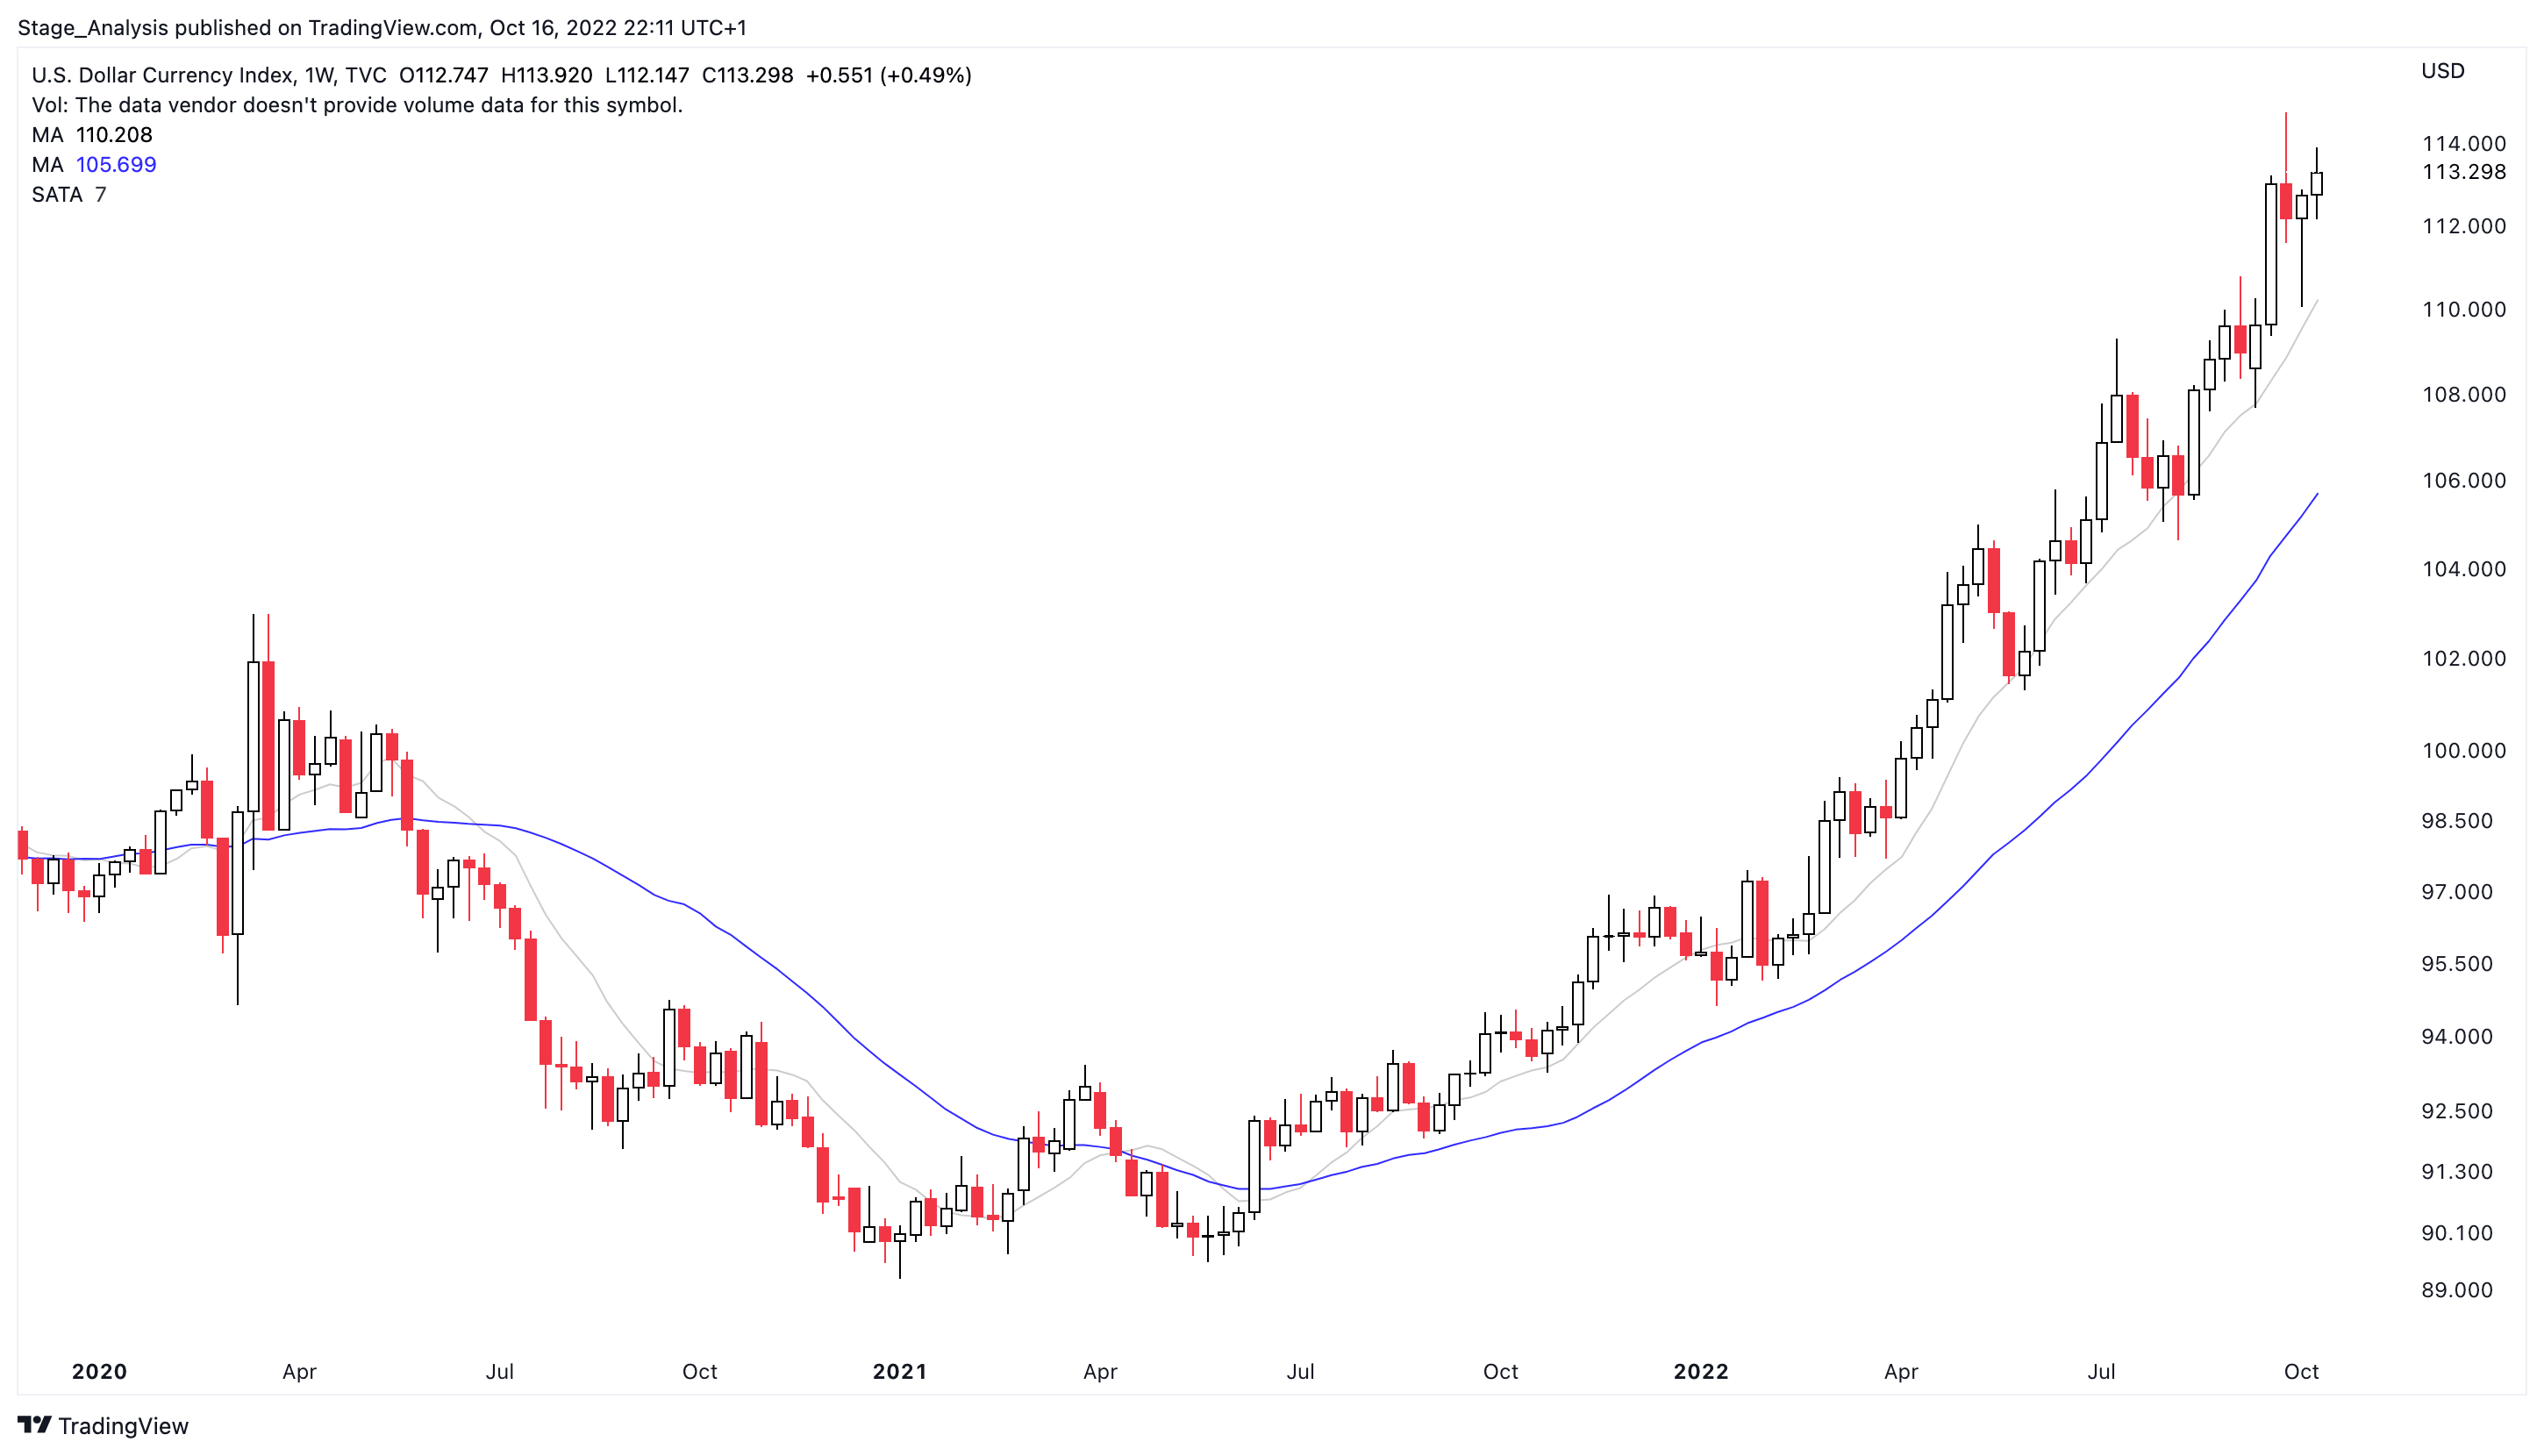
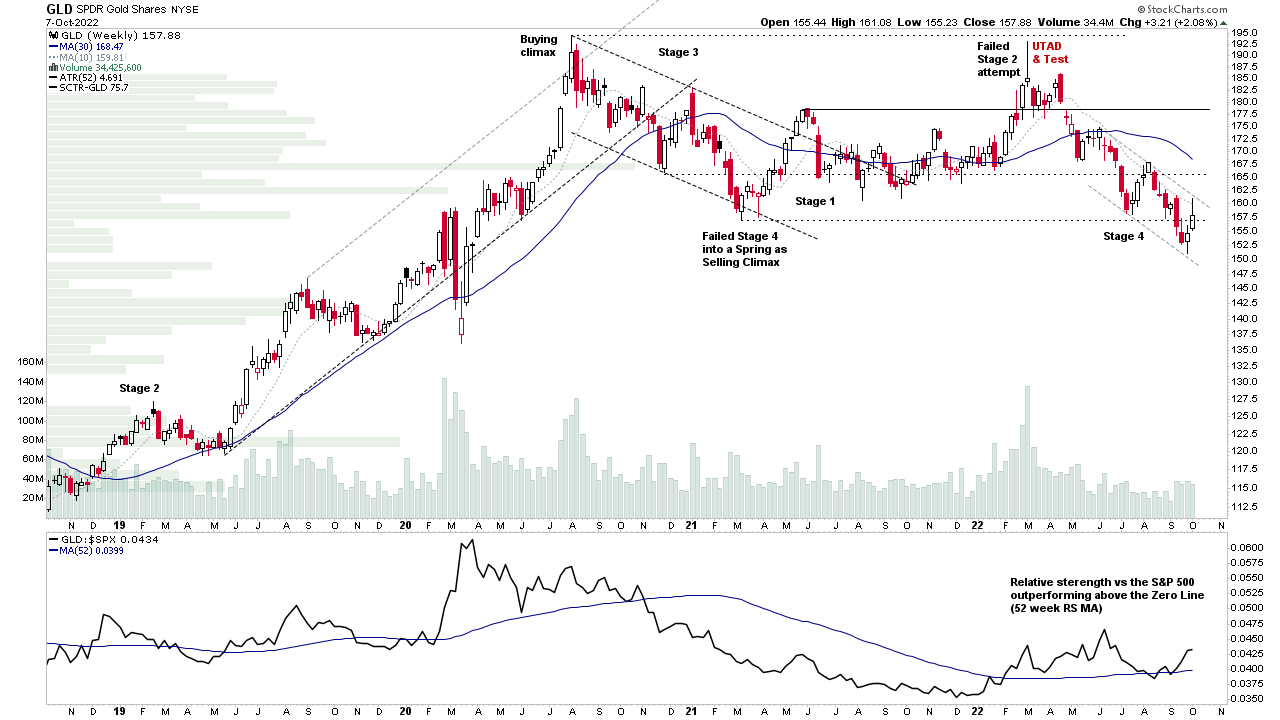
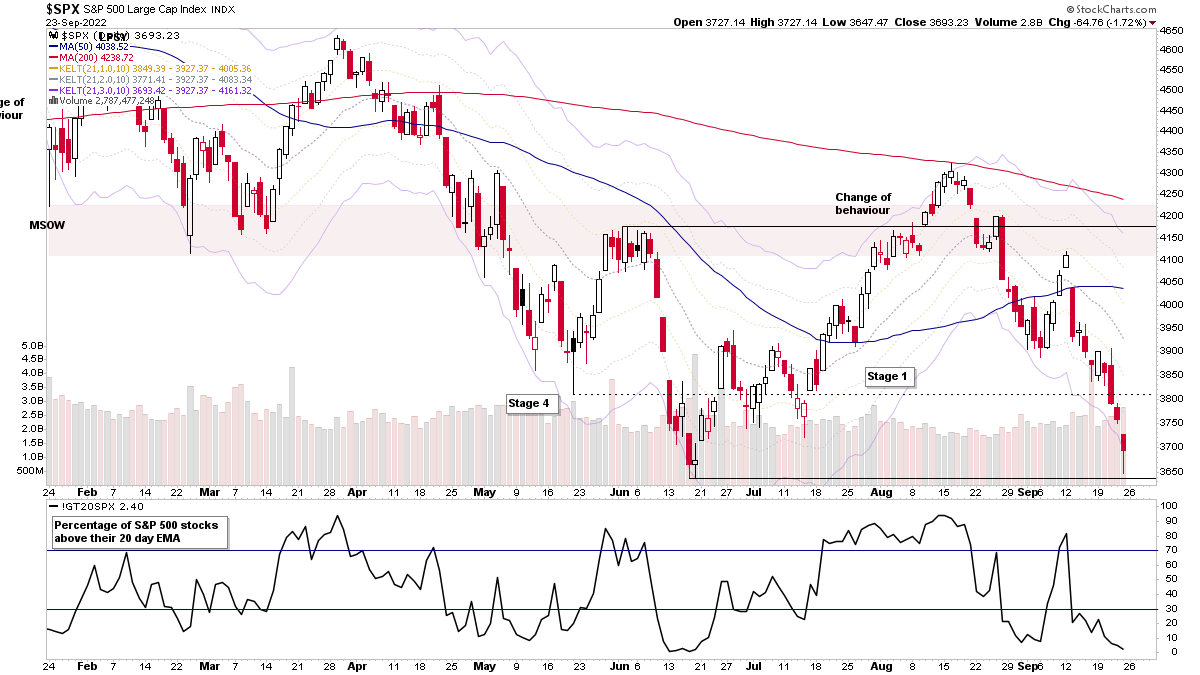
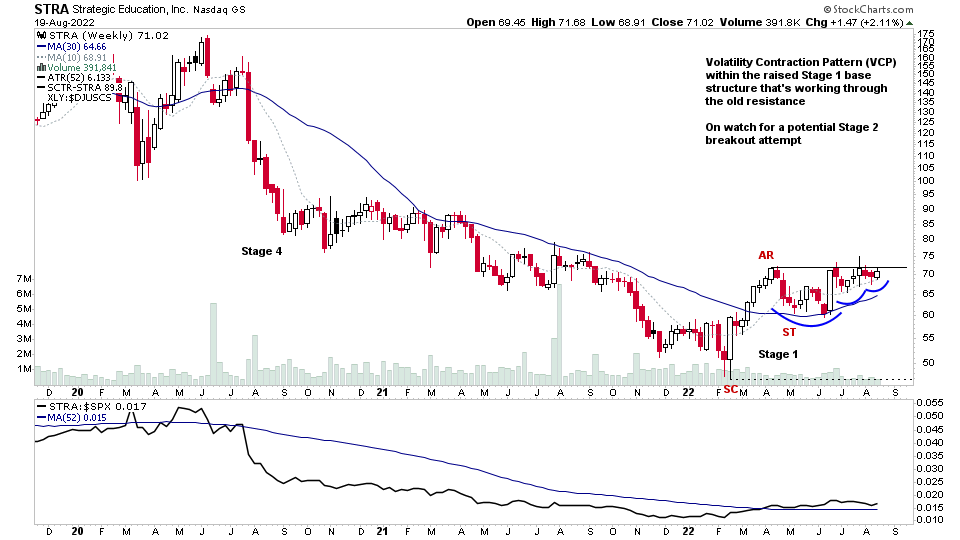
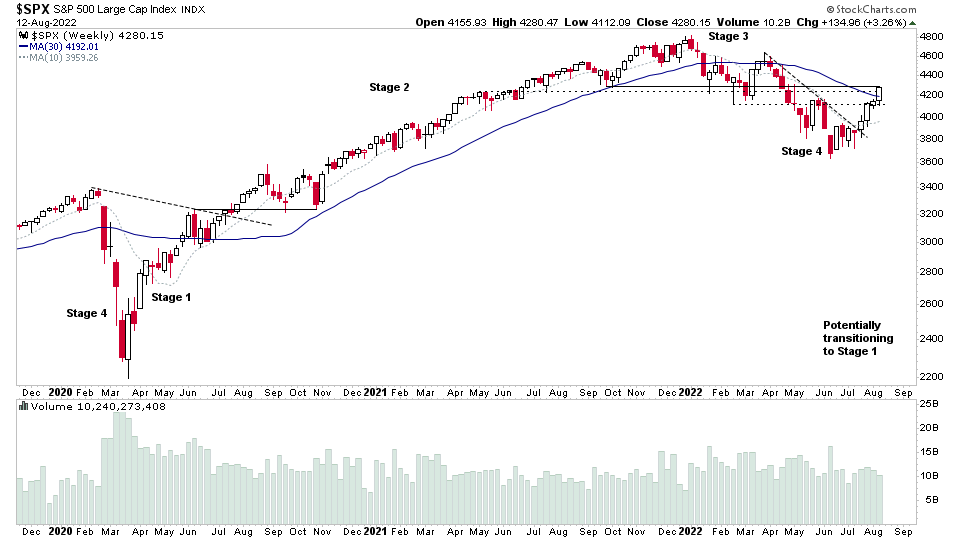
Part 2 of the regular members weekend video discussing the market, commodities, industry groups and market breadth to determine the weight of evidence.
Read More
Blog
23 October, 2022
Stage Analysis Members Video Part 2 – 23 October 2022 (58 mins)
16 October, 2022
Stage Analysis Members Weekend Video – 16 October 2022 (1hr 14mins)
The regular members weekend video discussing the market, industry groups, market breadth and individual stocks from the watchlist in more detail.
Read More
09 October, 2022
Stage Analysis Members Weekend Video – 9 October 2022 (1hr 27mins)
The regular members weekend video discussing the market, industry groups, market breadth and individual stocks from the watchlist in more detail. This week beginning with a special feature on Gold and Silver and the Miners as they show near term relative strength and attempt to move towards Stage 4B- or Stage 1.
Read More
25 September, 2022
Stage Analysis Members Weekend Video – 25 September 2022 (1hr 5mins)
The regular members weekend video discussing the market, industry groups, market breadth and individual stocks from the watchlist in more detail...
Read More
18 September, 2022
Stage Analysis Members Weekend Video – 18 September 2022 (1hr 14mins)
The regular members weekend video discussing the market, industry groups, market breadth and individual stocks from the watchlist...
Read More
11 September, 2022
Stage Analysis Members Weekend Video – 11 September 2022 (1hr 34mins)
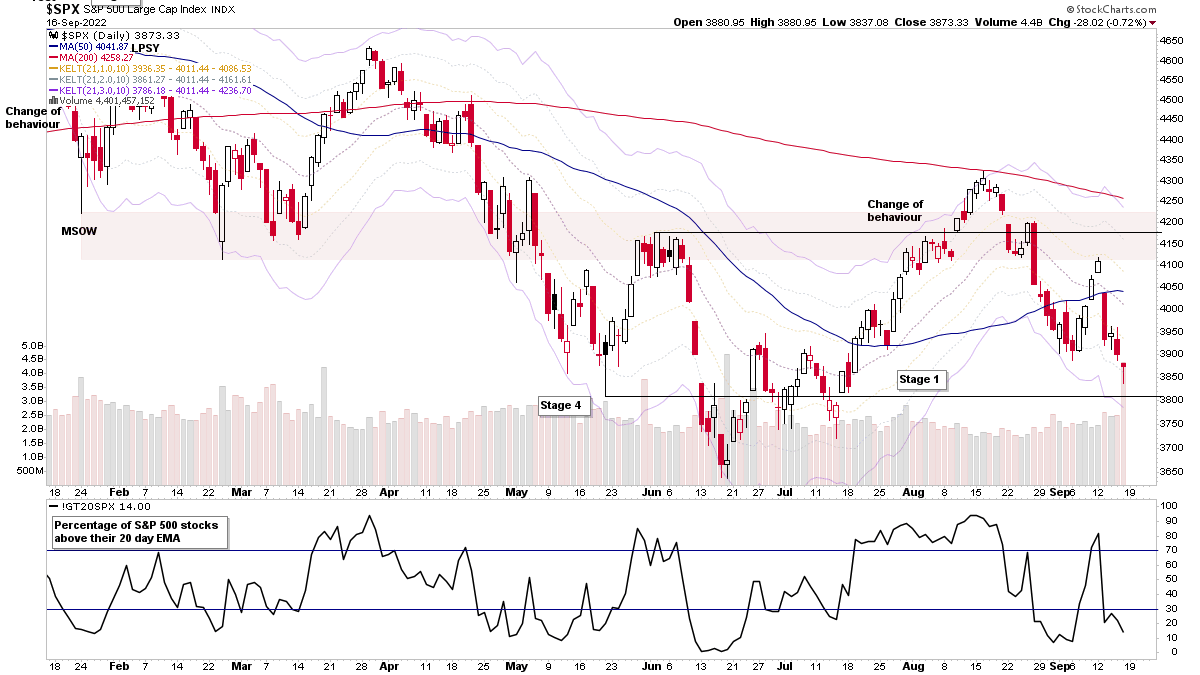
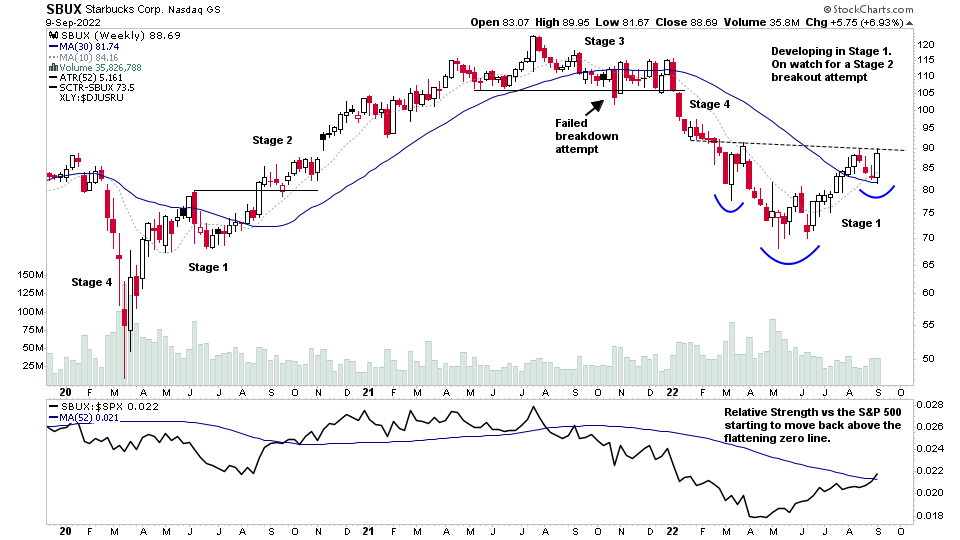
The weekend video begins with a detailed look at some of the weeks strong volume Stage 2 movers weekly charts and some interesting Stage 1 stocks too. Then an update on the major indexes developing Stage 1 base structures. What's moving in the US Industry Groups Relative Strength Rankings and the IBD Industry Groups Bell Curve – Bullish Percent...
Read More
04 September, 2022
Part 1 – Stage Analysis Members Weekend Video – 4 September 2022 (1hr 3mins)
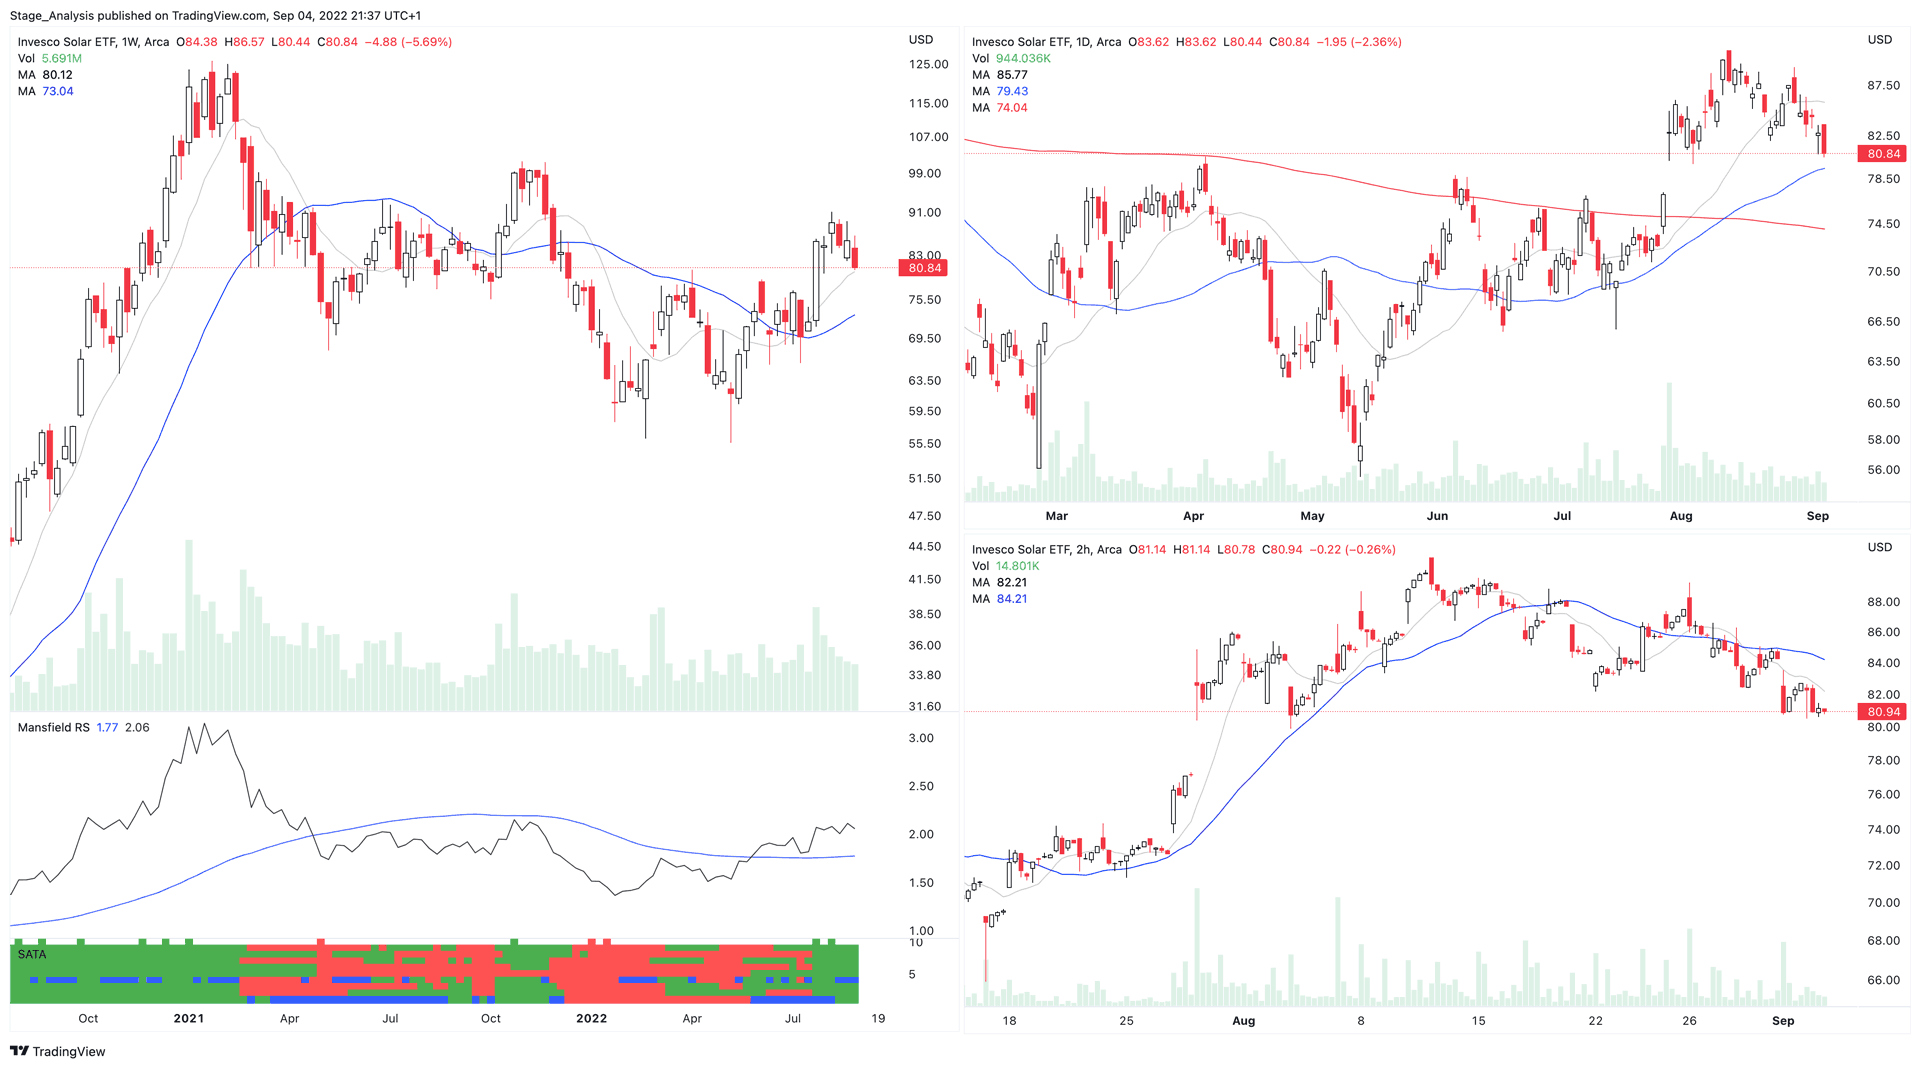
Part 1 of the weekend video begins with an explanation of how to use the new SATA - Stage Analysis Technical Attributes Indicator. Followed by a look at a few of this weeks high volume Stage 2 breakout attempts. Then a rundown of the price action in the major US indexes and Industry Groups RS Rankings...
Read More
28 August, 2022
Stage Analysis Members Weekend Video – 28 August 2022 (1hr 32mins)
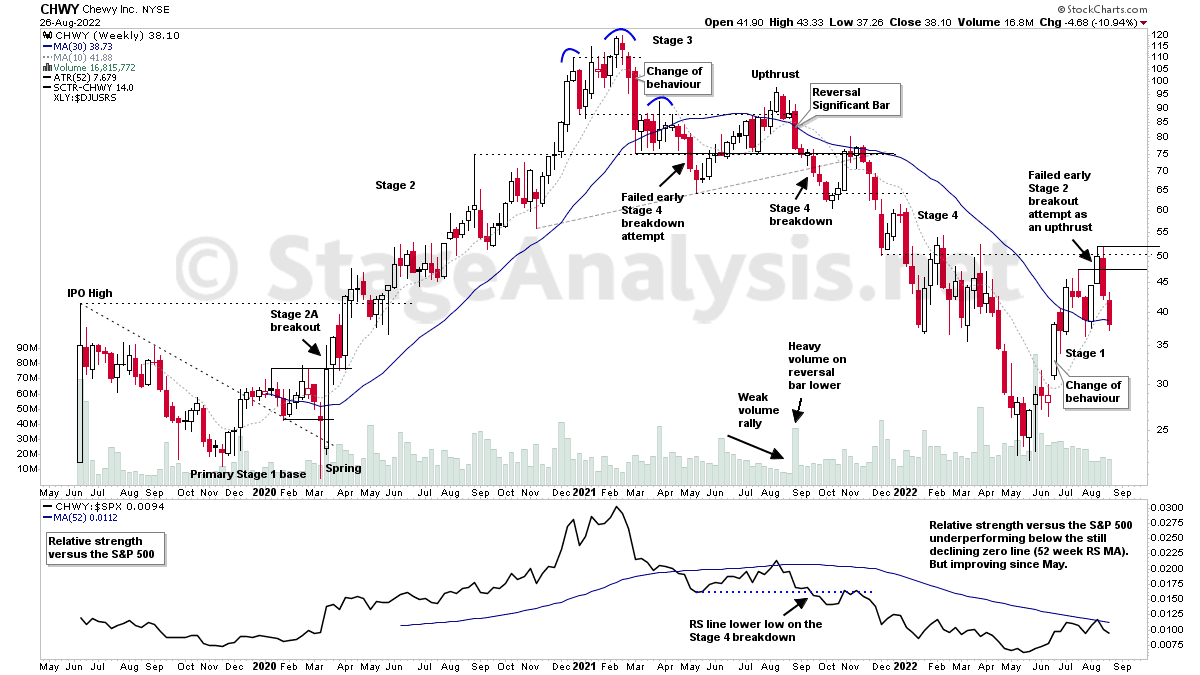
This weekends videos begins with an educational feature on the full Stage Analysis cycle from Stan Weinstein's method, discussing the entire four stages since the IPO in CHWY, and the multiple failed attempts to change Stage that is often seen. As real life is not like the textbooks...
Read More
21 August, 2022
Stage Analysis Members Weekend Video – 21 August 2022 (1hr 34mins)
This weeks Stage Analysis Members video begins with a discussion of a more complex Stage 1 base structure that can develop when a stock has a very early Stage 2 breakout attempt from a small base that then quickly fails and broadens out into much larger Stage 1 base structure.
Read More
14 August, 2022
Stage Analysis Members Weekend Video – 14 August 2022 (1hr 32mins)
This weeks Stage Analysis Members weekend video begins with a detailed run through of the weekend watchlist stocks on multiple timeframes, with live markups of the charts and explanations of what we are looking for in each.
Read More

