The Stage Analysis members weekend video begins with discussion of the the US Watchlist Stocks in detail on multiple timeframes, Stages Summary, Relative Strength Rankings, the Sector breadth and Sub-industries Bell Curves, the key Market Breadth Charts to determine the Weight of Evidence, Bitcoin & Ethereum and the Major US Stock Market Indexes Update.
Read More

Blog
13 April, 2025
Stage Analysis Members Video – 13 April 2025 (1hr 5mins)
06 April, 2025
Stage Analysis Members Video – 6 April 2025 (26 mins)
The Stage Analysis members weekend video reviewing the major US indexes and mega cap stocks as well the usual regular features to help to determine the Weight of Evidence.
Read More
30 March, 2025
Stage Analysis Members Video – 30 March 2025 (43mins)
The Stage Analysis members weekend video this week reviews the Stages of the major mega cap stocks and some of the leaders of the current cycle – PLTR, APP, CVNA etc, as well the usual regular features to help to determine the Weight of Evidence.
Read More
22 March, 2025
Stage Analysis Members Video – 22 March 2025 (1hr)
The Stage Analysis members weekend video begins with discussion of the the US Watchlist Stocks in detail on multiple timeframes, Stages Summary, Relative Strength Rankings, the Sector breadth and Sub-industries Bell Curves, the key Market Breadth Charts to determine the Weight of Evidence, Bitcoin & Ethereum and the Major US Stock Market Indexes Update.
Read More
16 March, 2025
Stage Analysis Members Video – 16 March 2025 (58mins)
The Stage Analysis members weekend video begins with discussion of the the US Watchlist Stocks in detail on multiple timeframes, Stages Summary, Relative Strength Rankings, the Sector breadth and Sub-industries Bell Curves, the key Market Breadth Charts to determine the Weight of Evidence, Bitcoin & Ethereum and the Major US Stock Market Indexes Update.
Read More
11 March, 2025
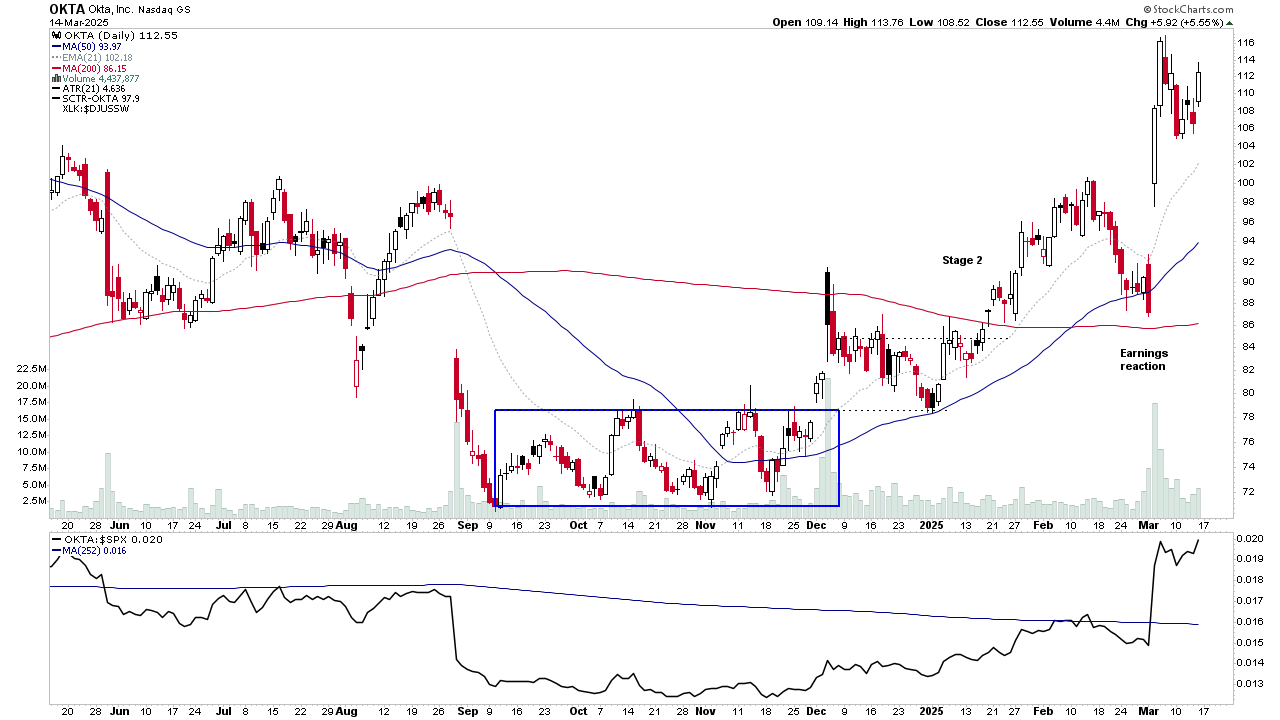
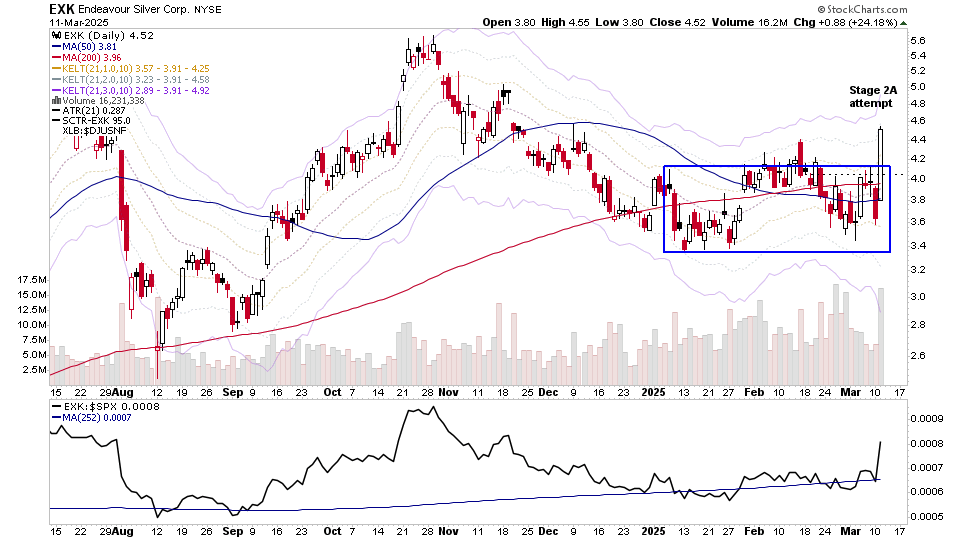
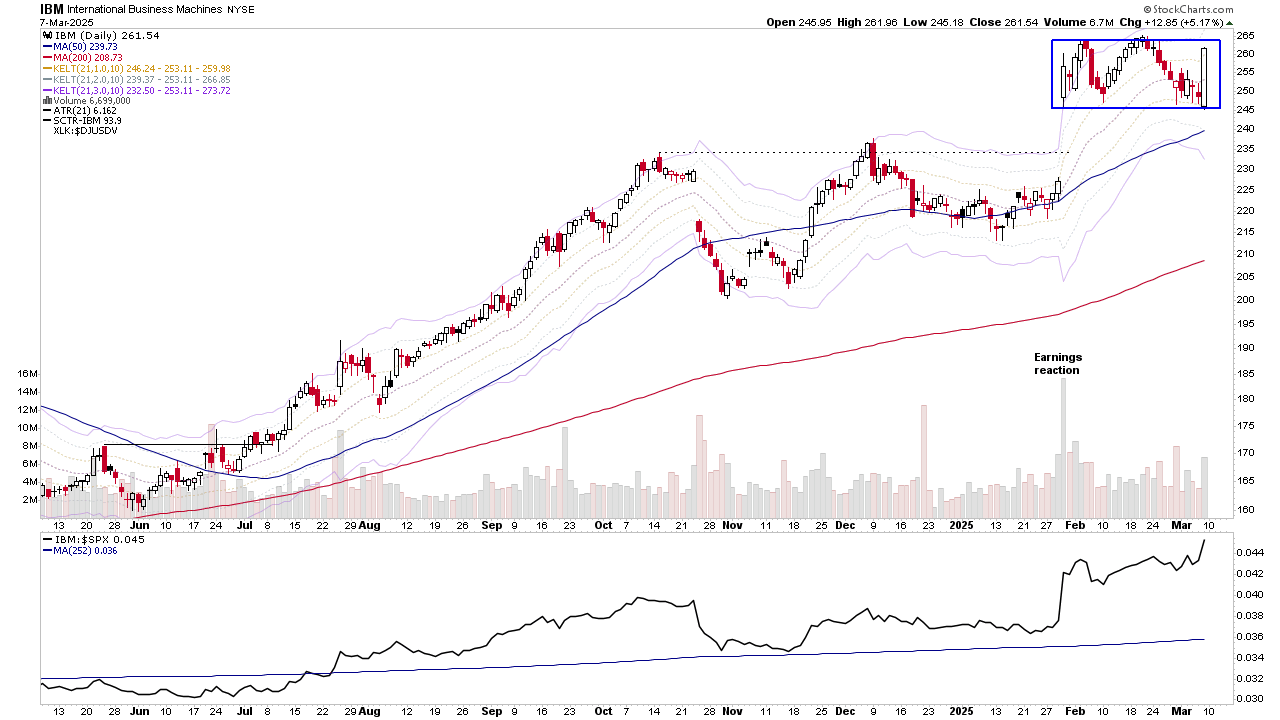
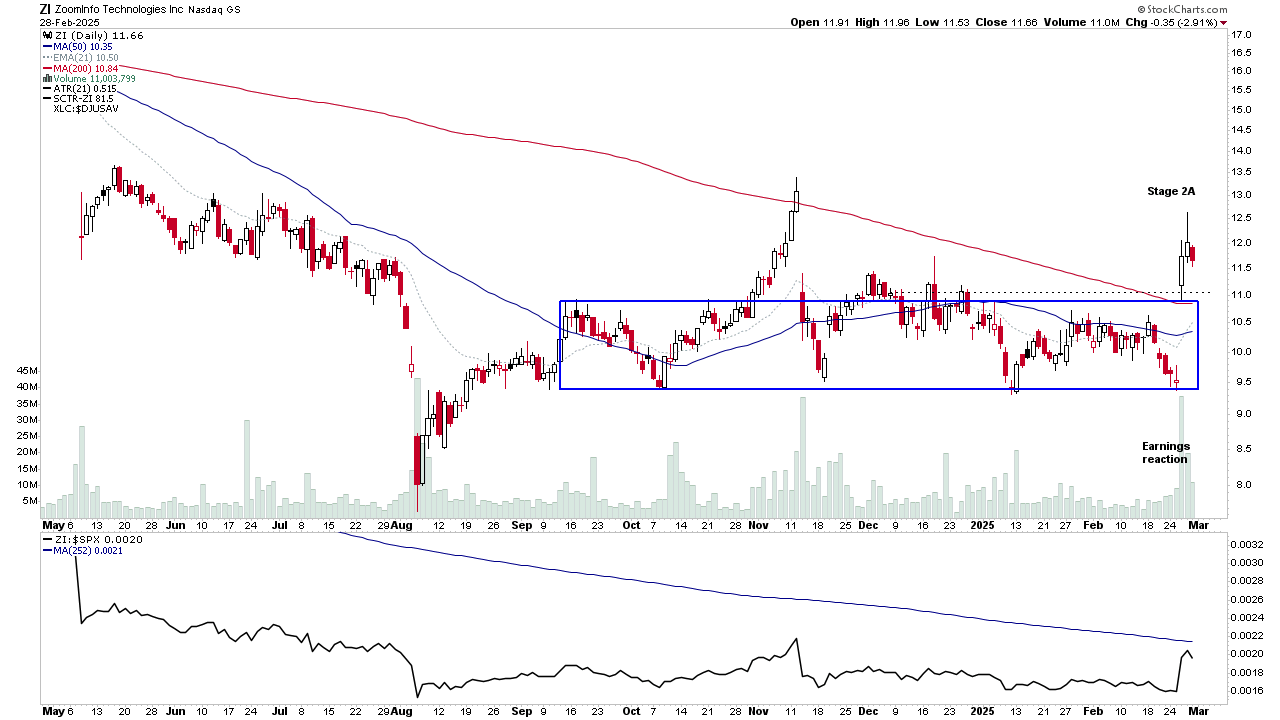
US Stocks Watchlist – 11 March 2025
There were 13 stocks highlighted from the US stocks watchlist scans today...
Read More
09 March, 2025
Stage Analysis Members Video – 9 March 2025 (44mins)
The Stage Analysis members weekend video begins with discussion of the the US Watchlist Stocks in detail on multiple timeframes, Stages Summary, Relative Strength Rankings, the Sector breadth and Sub-industries Bell Curves, the key Market Breadth Charts to determine the Weight of Evidence, Bitcoin & Ethereum and the Major US Stock Market Indexes Update.
Read More
02 March, 2025
Stage Analysis Members Video – 2 March 2025 (54mins)
The Stage Analysis members weekend video begins with discussion of the the US Watchlist Stocks in detail on multiple timeframes, Stages Summary including the new Sub-stages summary added this week. Relative Strength Rankings, the Sector breadth and Sub-industries Bell Curves, the key Market Breadth Charts to determine the Weight of Evidence, Bitcoin & Ethereum and the Major US Stock Market Indexes Update and ETFs on the move...
Read More
23 February, 2025
Stage Analysis Members Video – 23 February 2025 (38mins)
The Stage Analysis members weekend video begins with a discussion of the major US stocks and how to use the Stage Analysis Screener to find weakness. Followed by the Stages Summary, Relative Strength Rankings, the Sector breadth and Sub-industries Bell Curves, the key Market Breadth Charts to determine the Weight of Evidence, Bitcoin & Ethereum and the Major US Stock Market Indexes Update and ETFs on the move.
Read More
16 February, 2025
Stage Analysis Members Video – 16 February 2025 (58mins)
The Stage Analysis members weekend video begins with discussion of the the US Watchlist Stocks in detail on multiple timeframes, Stages Summary including the new Sub-stages summary added this week. Relative Strength Rankings, the Sector breadth and Sub-industries Bell Curves, the key Market Breadth Charts to determine the Weight of Evidence, Bitcoin & Ethereum and the Major US Stock Market Indexes Update and ETFs on the move.
Read More