
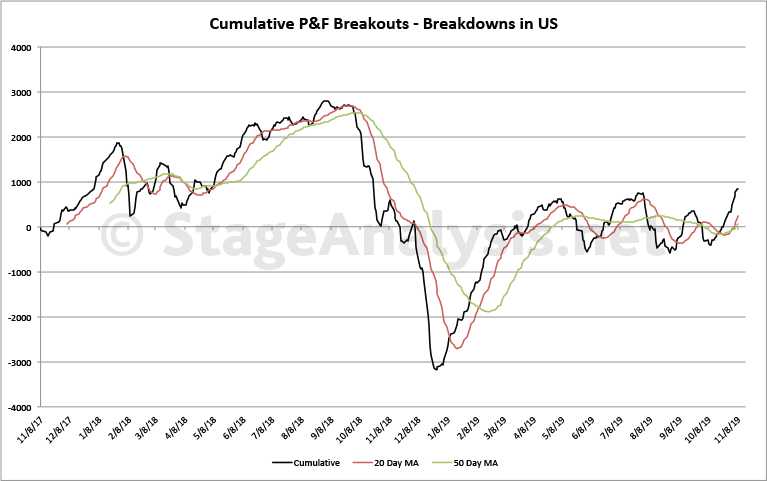
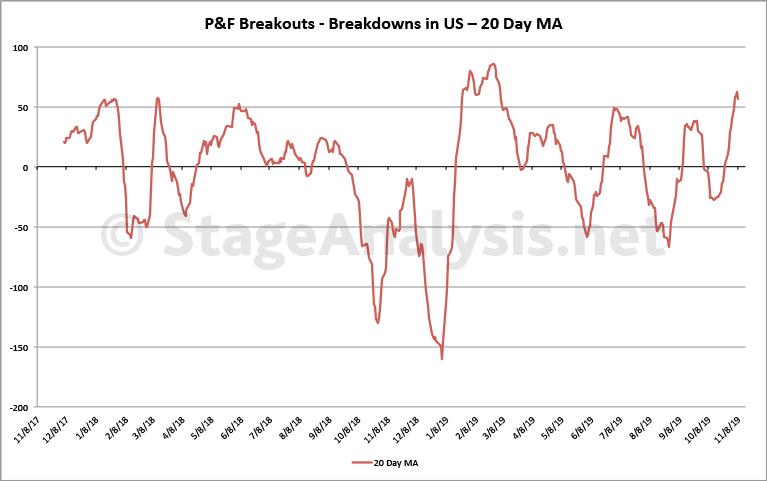
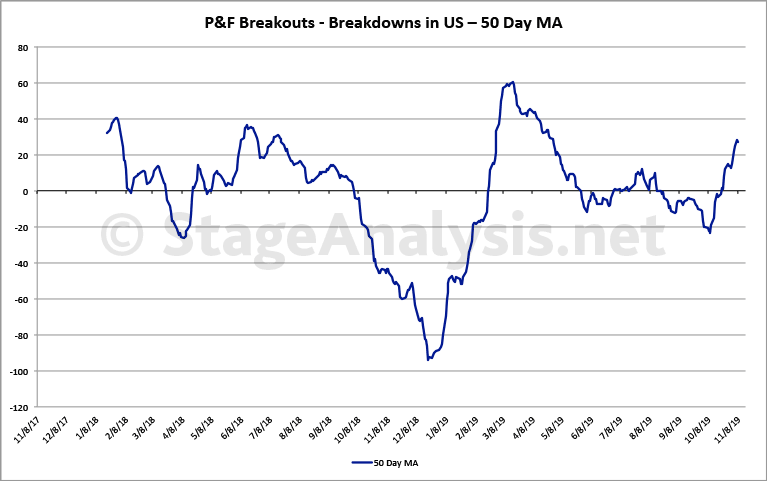
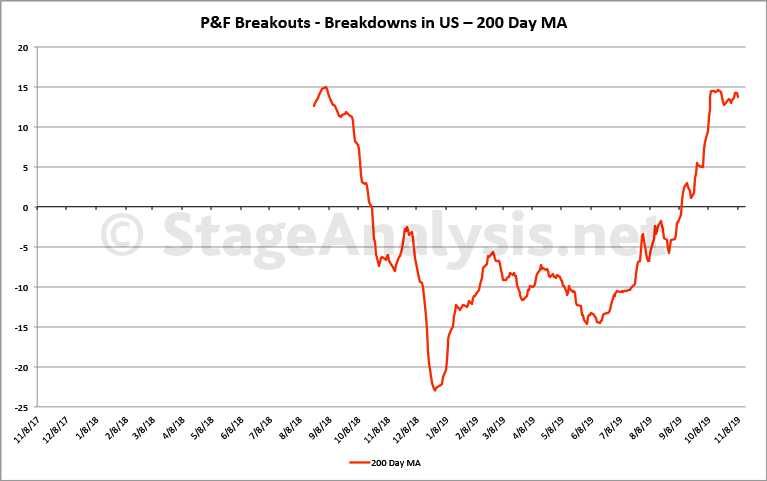
Cumulative P&F Breakouts - Breakdowns custom Breadth charts
Attached is my updated custom breadth charts that I do based on the daily point and figure double top breakouts and double bottom breakdowns.
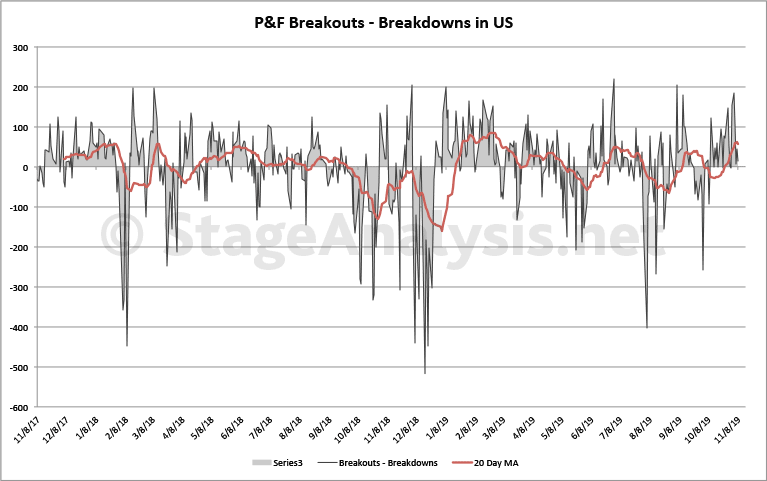
Totals for the week:
+654 double top breakouts
-300 double bottom breakdowns
+354 net breakouts - breakdowns
Note: The Cumulative P&F Breakouts - Breakdowns chart made a new 52 week high this week, after spending the majority of the year in a defined sideways Stage 1 range. The breakout is still only just above the range, and so like the markets it's only a fledgling Stage 2 breakout, and may yet fall back again. So caution still seems like the most sensible strategy currently with some test buys and tight risk control imo.
Disclaimer: For educational purpose only. Not investment advice. Seek professional advice from a financial advisor before making any investing decisions.