
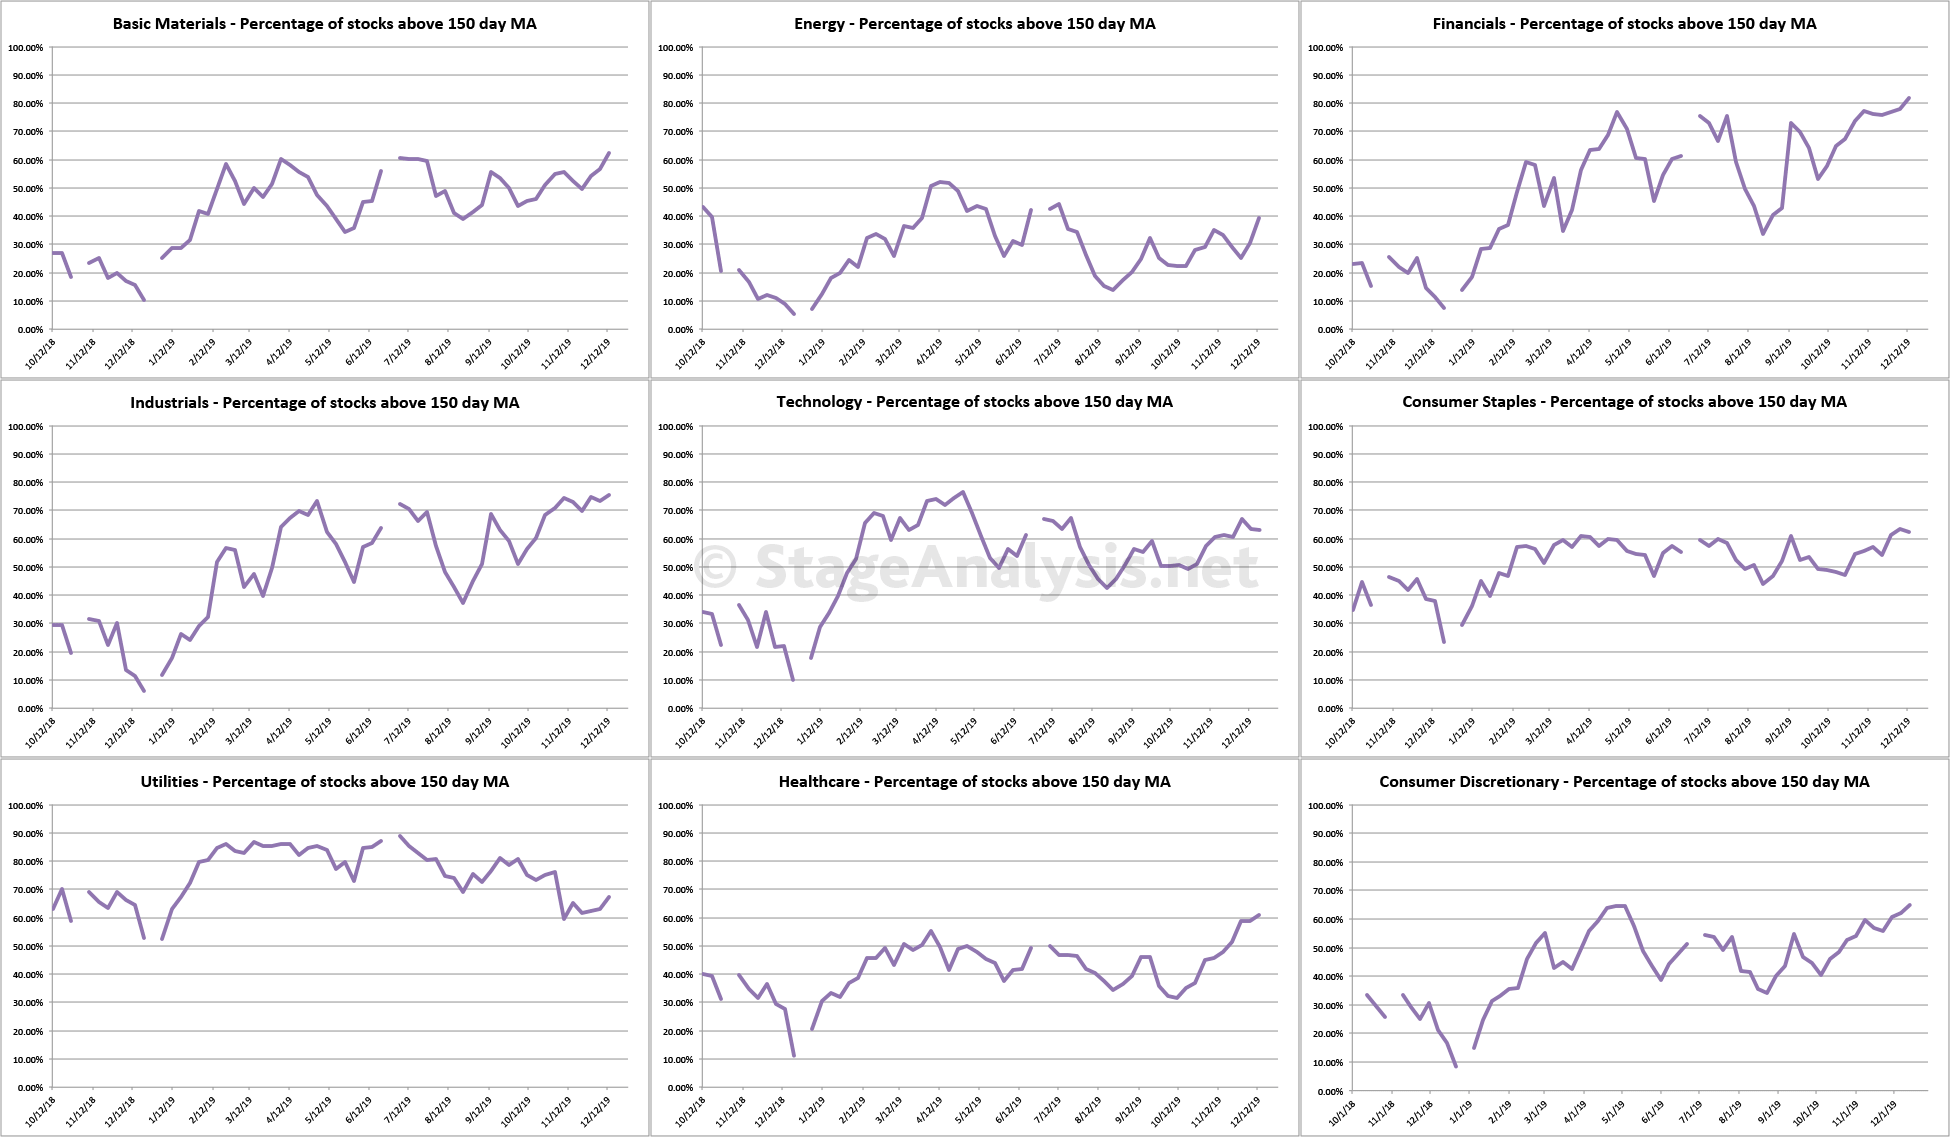
US Sectors - Percent of Stocks Above their 150 Day Moving Average - Individual Charts
Attached is the US Sectors - Percent of Stocks Above their 150 Day Moving Average - Individual Line Charts.
There's a few gaps where I missed weeks, but it shouldn't affect the overall result that you can see.
Disclaimer: For educational purpose only. Not investment advice. Seek professional advice from a financial advisor before making any investing decisions.