+- Stage Analysis Forum - Trading & Investing using Stan Weinstein's Stocks Breakout method (https://www.stageanalysis.net/forum)
+-- Forum: Main Board (https://www.stageanalysis.net/forum/Forum-Main-Board)
+--- Forum: Stan Weinstein's Stage Analysis - Stock Charts, Technical Analysis, Learn to Trade, Stocks, ETF, NYSE, Nasdaq (https://www.stageanalysis.net/forum/Forum-Stan-Weinstein-s-Stage-Analysis-Stock-Charts-Technical-Analysis-Learn-to-Trade-Stocks-ETF-NYSE-Nasdaq)
+--- Thread: Stan Weinstein's Stage Analysis and Market Breadth - Technical Analysis (/Thread-Stan-Weinstein-s-Stage-Analysis-and-Market-Breadth-Technical-Analysis)
Pages:
1
2
3
4
5
6
7
8
9
10
11
12
13
14
15
16
17
18
19
20
21
22
23
24
25
26
27
28
29
30
31
32
33
34
35
36
37
38
39
40
41
42
43
44
45
46
47
48
49
50
51
52
53
54
55
56
57
58
59
60
61
62
63
64
65
66
67
68
69
70
71
72
73
74
75
76
77
78
79
80
81
82
83
84
85
86
87
88
89
90
91
92
93
94
95
96
97
98
99
100
101
102
103
104
105
106
107
108
109
110
111
112
113
114
115
116
117
118
119
120
121
122
123
124
125
126
127
128
129
130
131
132
133
134
135
136
137
138
139
140
141
142
143
144
145
146
147
148
149
150
151
152
153
154
155
156
157
158
159
160
161
162
163
164
165
166
167
168
169
170
171
172
173
174
175
176
177
178
179
180
181
182
183
184
185
186
187
188
189
190
191
192
193
194
195
196
197
198
199
200
201
202
203
204
205
206
207
208
209
210
211
212
213
214
215
216
217
218
219
220
221
222
223
224
225
226
227
228
229
230
231
232
233
234
235
236
237
238
239
240
241
242
243
244
245
246
247
248
249
250
251
252
253
254
255
256
257
258
259
260
261
262
263
264
265
266
267
268
269
270
271
272
273
274
275
276
277
278
279
280
281
282
283
284
285
286
287
288
289
290
291
292
293
294
295
296
297
298
299
300
301
302
303
304
305
306
307
308
309
310
311
312
313
314
315
316
317
318
319
320
321
322
323
324
325
326
327
328
329
330
331
332
333
334
335
336
337
338
339
340
341
342
343
344
345
346
347
348
349
350
351
352
353
354
355
356
357
358
359
360
361
362
363
364
365
366
367
368
369
370
371
372
373
374
375
376
377
378
379
380
381
382
383
384
385
386
387
388
389
390
391
392
393
394
395
396
397
398
399
400
401
402
403
404
405
406
407
408
409
410
411
412
413
414
415
416
417
418
419
420
421
422
423
424
425
426
427
428
429
430
431
432
433
434
435
436
437
438
439
440
441
442
443
444
445
446
447
448
449
450
451
452
453
454
455
456
457
458
459
460
461
462
463
464
465
466
467
468
469
470
471
472
473
474
475
476
477
478
479
480
481
482
483
484
US Industry Sectors - isatrader - 2013-08-24
Attached are the updated US Industry Sector Charts and relative performance table.
Note: Basic materials continued to move higher this week.
RE: Stan Weinstein's Stage Analysis - isatrader - 2013-08-26
I've just put up a new thread with a poll called What market do you trade the most? in the members section. So please go to the thread for 1 minute and participate in the poll, as it will help me to know what markets to focus on more for the members.
Cheers
New Daily Breakouts and Breakdowns in the US Market Thread in Elite Section - isatrader - 2013-08-27
Just a quick announcement to say that I've started a new Daily Breakouts and Breakdowns in the US Market thread in the elite section, which will be the same format as Daily Breakouts and Breakdowns in S&P 500 thread in the free section of the site, except that it will cover the entire US market with shares of a market cap of 50million or over.
Below is yesterday's post so that guests and standard members can see what it is:
(2013-08-27, 12:26 AM)isatrader Wrote: This thread will show daily breakouts and breakdowns lists from the entire US market with a market cap of 50million or above, and will include stocks and etfs.
I will try to go through the daily list when I have time and pick out the best looking charts imo, and will aim to go back through the weeks list at the weekend and pick out the best charts of the week that managed to close the week strongly as well.
Below is the table of Monday's breakouts and breakdowns in the US market. There was 48 breakouts and 7 breakdowns.
US Market Breakouts - 26/8/13
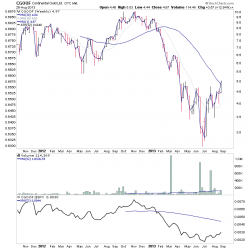
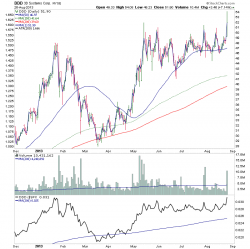
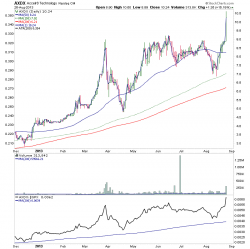
A couple of breakouts that look interesting are: CGOOF, DDD and AXDX. Head and shoulders Stage 1 base pattern on CGOOF, but it still has a declining 30 week MA and average volume. DDD and AXDX are both trader continuation moves with some reasonable volume on the breakouts.


US Market Breakdowns - 26/8/13
So to see the breakouts and breakdowns list daily for the entire US market you need to go to the Elite Membership section on the front page.
Cheers
NYSE Percentage of Stocks above their 50 day MA - status change - isatrader - 2013-08-27
The NYSE Percentage of Stocks above their 50 Day Moving Averages chart reversed to Bear Confirmed status today.
RE: Stan Weinstein's Stage Analysis - goodtyneguy - 2013-08-28
I was looking in ProRealTime for a benchmark to use with the Mansfield RS for commodities rather than the S&P500 and I came across the Dow Jones-UBS commodity index. Fact sheets here
There are two indices, from the methodology fact sheet:
Indices in the DJ-UBSCI family are calculated on both an excess return
and total return basis. The excess return indices reflect the return of
underlying commodity futures price movements only, whereas the
total return indices reflect the return on fully collateralized futures
positions. Twenty-two commodities are included in the DJ-UBSCI,
representing the following commodity sectors: energy, precious
metals, industrial metals, livestock and agriculture.
Four main themes underlie the construction
Excess return and total return, confused.com?
Anyone....?
RE: Stan Weinstein's Stage Analysis - isatrader - 2013-08-28
I don't know the answer to that one, but for commodities you should be using the Continuous Commodity Index ($CCI) imo, as it doesn't have the bias towards energy that the $CRB does as it is equal weighted.
The Continuous Commodity Index is an equal weighted index and comprises of 17 commodity futures that are continuously rebalanced: Cocoa, Coffee ‘C’, Copper, Corn, Cotton, Crude Oil, Gold, Heating Oil, Live Cattle, Live Hogs, Natural Gas, Orange juice, Platinum, Silver, Soybeans, Sugar No. 11, and Wheat.
If ProRealTime doesn't have the Continuous Commodity Index available, then an ETF with reasonable tracking error seems to be the GreenHaven Continuous Commodity Index Fund (GCC)
Ideal Short Sale Chart - isatrader - 2013-08-29
With the US markets beginning to look like they could be moving into early Stage 3 soon, I thought it would be a good time to post Chart 7-13 from Chapter 7 of the book as a reminder, which shows the ideal short sale entry points and general pattern as a number of stocks are beginning to break down into Stage 4.
Reread Chapter 7 to get a full refresher on the methods recommendations for shorting.
RE: Market Breadth Update - Jere - 2013-08-30
Does any one here use the Summation Index and McClellan market breath indicators?
The McClellan Summation Index: The Mother of Market Timing Tools[/b]
The McClellan Summation Index is an indicator that forecasts future market movements using the number of advancing and declining securities on the New York Stock Exchange (NYSE) opposed to being calculated on price change.
The McClellan Summation Index (MSI) is the cumulative sum of the daily McClellan oscillator figures. The McClellan oscillator (MO) takes the difference between two exponential moving averages (EMAs) of the daily NYSE advance-decline $NYAD) net values. The MO is the difference between the 19-day and the 39-day exponential moving averages (EMAs) of the daily net advance-decline figures. The MO is a market breadth indicator that helps us evaluate the money flow of the stock market. Its purpose is to help determine if money is entering or exiting the stock market, indicating whether overbought or oversold conditions exist. The McClellan Summation index is a version of the MO that is adapted for longer trends.
McClellan Summation Index is expressed as:
Oscillator = (19-day EMA of securities advancing - securities declining) - (39-day EMA of securities advancing - securities declining) + Previous day's McClellan Summation Index
Both the McClellan Oscillator and Summation Index are market breadth indicators. Market breadth simply refers to the measurement of the number of issues advancing versus the number of issues declining on a given day or by expressing that information using moving averages.
The bottom window of the graphic below shows the 19-day and 39-day EMAs of the NYSE Advance/Decline Issues ($NYAD). Notice when the 19-day EMA crossed above the 39-day EMA that the McClellan Oscillator moves above its zero line (see the middle window). In contrast, when the 19-day EMA moves below the 39-day EMA, the MO falls below the zero line.
In mid-February, the 19-day EMA crossed above the 39-day EMA of $NYAD, while simultaneously, the McClellan Oscillator moved above its zero line, marking the February lows. Then on March 24, 2010, the 19-day EMA crossed back below the 39-day EMA of the EMYA Advance/Decline Issues, causing the MO to fall back below zero. Two days later, on March 26, 2010, the MSI toppled below its five-day EMA, tipping traders off to a possible top.
The upper window showcases the McClellan Summation Index (MSI), which again is a longer-range version of the MO (Figure 1). It is used to spot major market turning points in the market, giving traders a longer-range view of market breadth. The Summation Index is a proxy that identifies whether money is flowing in or out of the market. Additionally, the MSI oscillates between readings of positive and negative territory with a zero line separating the two, which can help determine if a bull or bear market is present.
The MSI current assessment of market conditions is bearish in spite of the growing bullish optimism. Despite the MSI being in positive territory, it has crossed below its five-day EMA, which I use to confirm bullish and bearish trading signals. When the MSI flies above its five-day EMA, the stock market is usually advancing, and when it is riding below it, the market is more than likely correcting. The recent bearish conditions on the MSI hint that the market is likely in store for a correction. Using the five-day EMA of the MSI helps separate the good from the bad signals given from the MO. If a MO signal is legitimate, it will be usually be confirmed by the MSI moving above or below its five-day EMA a few days later. Using this signal helps prevent whipsaws.
The system isn’t perfect though, because it gave inconsistent signals back in November of 2009 when the NYSE was moving sideways. But ultimately, the market moved higher, which was validated by the Summation Index. Nevertheless, the MSI currently suggests that the market is overbought and that traders are taking money off the table.
By using the MSI, you will improve your trading skills by taking a lot of the guessing out of your investment decisions. You will get more accurate and predictable results of directional moves by using this trustworthy market breadth indicator.