Stage Analysis Video Training Course

UK Stocks and ETFs - Watchlist and Discussion - Page 208

RE: UK Stocks and ETFs - Watchlist and Discussion

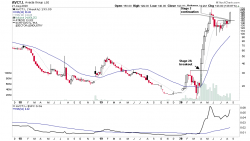
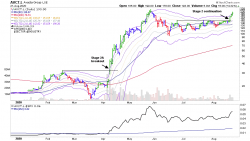
AVCT.L is showing the signs of Volatility Contraction Pattern, following a massive 500%+ move in April/May, and currently sitting just under the pivot level above the 50 day MA with very quiet volume. Watching for breakout on strong relative volume


isatrader

Fate does not always let you fix the tuition fee. She delivers the educational wallop and presents her own bill - Reminiscences of a Stock Operator.

RE: UK Stocks and ETFs - Watchlist and Discussion

(2020-08-18, 10:27 AM)isatrader Wrote: AVCT.L is showing the signs of Volatility Contraction Pattern, following a massive 500%+ move in April/May, and currently sitting just under the pivot level above the 50 day MA with very quiet volume. Watching for breakout on strong relative volume

WOW!! this was a textbook-perfect buy back in April when it broke out around 30 to 40 bucks. I keep seeing these stocks that broke out in April-May but I can't find anything right now that resembles what we are looking for (breakout on huge volume, rising MA and no overhead resistance). 

Isa, in your experience, how often do these perfect patterns come by? Also, do you have an advice to spot them early? I know this is the $1M question but just wondering if you developed something over the years that helps you identify these stocks as they breakout into Stage 2.

Thanks

(This post was last modified: 2020-08-20, 10:15 PM by the_manassa_mauler.)

RE: UK Stocks and ETFs - Watchlist and Discussion

anyone scoping Ford?... takes?

RE: UK Stocks and ETFs - Watchlist and Discussion

(2020-08-18, 10:27 AM)isatrader Wrote: AVCT.L is showing the signs of Volatility Contraction Pattern, following a massive 500%+ move in April/May, and currently sitting just under the pivot level above the 50 day MA with very quiet volume. Watching for breakout on strong relative volume

Hi isa (or anyone else),

Did you get a chance to look into my question above?

Thank you.

RE: UK Stocks and ETFs - Watchlist and Discussion

(2020-08-19, 01:35 AM)moneymaker Wrote:
(2020-08-18, 10:27 AM)isatrader Wrote: AVCT.L is showing the signs of Volatility Contraction Pattern, following a massive 500%+ move in April/May, and currently sitting just under the pivot level above the 50 day MA with very quiet volume. Watching for breakout on strong relative volume

WOW!! this was a textbook-perfect buy back in April when it broke out around 30 to 40 bucks. I keep seeing these stocks that broke out in April-May but I can't find anything right now that resembles what we are looking for (breakout on huge volume, rising MA and no overhead resistance). 

Isa, in your experience, how often do these perfect patterns come by? Also, do you have an advice to spot them early? I know this is the $1M question but just wondering if you developed something over the years that helps you identify these stocks as they breakout into Stage 2.

Thanks

You will generally only see these kinds of breakouts in multiple stocks at the same time following a major market crash. However, in normal times they are much more rare and require an event in order to spark the heavy volume buying by institutional investors, such sudden massive earnings growth, a new product that starts to achieve accelerating sales growth. Or front running ahead of a merger. Major news event in the stock or sector etc. Generally there needs to be a catalyst from my experience of some kind. In AVCT.L case it was the announcement on April 6th that they were developing a COVID-19 Rapid Test. Which brought in big volume to the stock and propelled it higher.

But the key to finding them is to simply follow the rules and focus on the stocks with the Triple Confirmation Pattern (see page 148 to 152 in the book) as a minimum requirement. i.e substantially larger volume on the breakout than anything during the Stage 1 base. Relative strength versus the S&P 500 must move decisively above the "Zero line" (52 week MA of the RS Line versus the S&P 500) on the breakout. And finally the stock should have a big move before the breakout. I would say it should be at least 100% above the 52 week low personally when it breaks out into Stage 2A.

Often these kinds of stocks can be hard to enter though, because of the rapid moves. So you need to look for the signs in advance of the breakout and then be ready to enter if it breaks out on substantial volume. At least 5x the weekly average, but generally much more than that even. As it should eclipse all the volume that's gone before it by a long way and literally stand out like a sore thumb on the right edge of the chart.

I use alerts in my trading software for breakouts, as it's impossible to keep track of all the stocks that you want to manually and the breakouts happen quickly.

This one is a good example of why alerts are useful, as I forgot to set an alert at the continuation level after posting this, and since it's broken out strongly and moved +28% this week. So I've missed the entry point, as I try not to buy at more than +5% above the breakout level.
       

isatrader

Fate does not always let you fix the tuition fee. She delivers the educational wallop and presents her own bill - Reminiscences of a Stock Operator.

RE: UK Stocks and ETFs - Watchlist and Discussion

Thanks for sharing that.

Yes, for this particular stock, the first huge volume spike early April should've put this stock in everybody's watchlist. That was a sign that something was cooking. Then the breakout after that should've been a clear buy-signal. So looking at this chart, I'd say we had at least 2 days to enter it at high 30s/low 40s.

What is an example of alerts that would help us find these stocks just when they breakout?

I'd say new 6-month high and huge relative volume would be a good start. What do you think?

RE: UK Stocks and ETFs - Watchlist and Discussion

(2020-08-22, 04:11 PM)moneymaker Wrote: What is an example of alerts that would help us find these stocks just when they breakout?

I'd say new 6-month high and huge relative volume would be a good start. What do you think?

See the https://www.stageanalysis.net/forum/Thre...k-Scanners thread for the types of scans I run to find breakouts and stocks setting up before the breakout.

isatrader

Fate does not always let you fix the tuition fee. She delivers the educational wallop and presents her own bill - Reminiscences of a Stock Operator.

RE: UK Stocks and ETFs - Watchlist and Discussion

Thanks isa.


Forum Jump:


Users browsing this thread: 3 Guest(s)